Races in Exeter, New Hampshire (NH) Detailed Stats
Data:
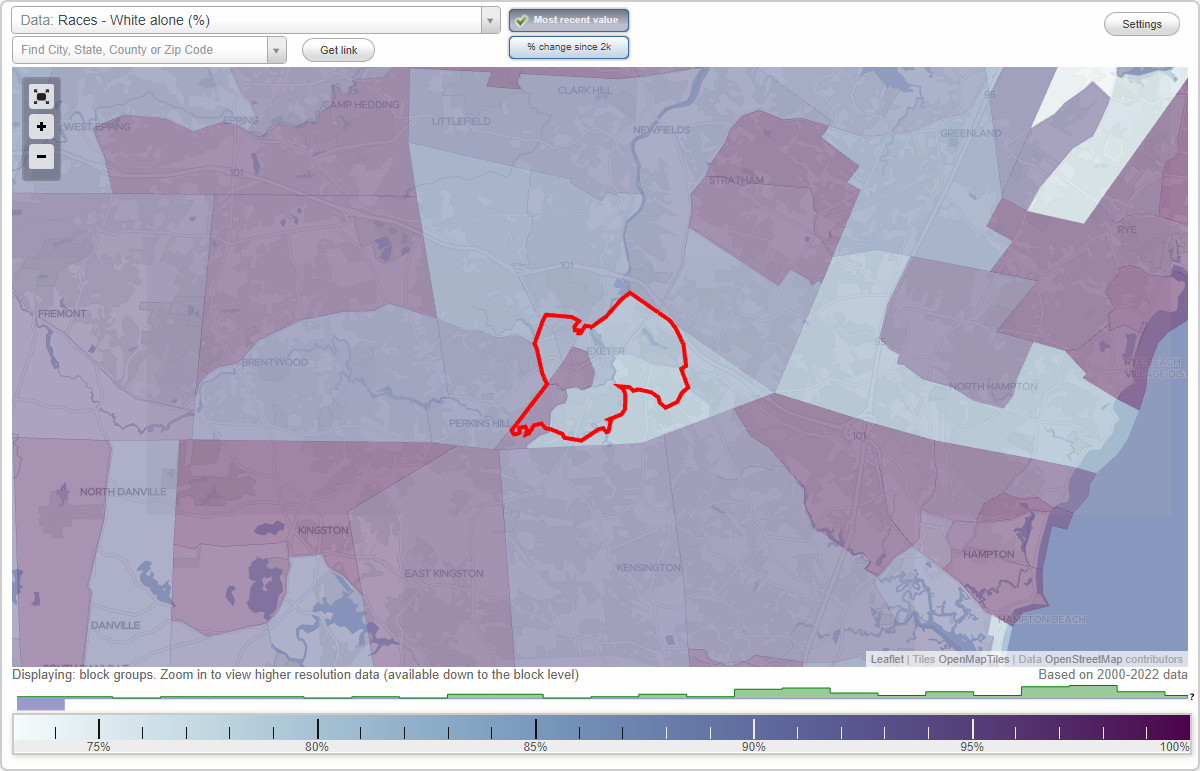
Races - White alone (%)
Races - White alone (% change since 2000)
Races - Black alone (%)
Races - Black alone (% change since 2000)
Races - American Indian alone (%)
Races - American Indian alone (% change since 2000)
Races - Asian alone (%)
Races - Asian alone (% change since 2000)
Races - Hispanic (%)
Races - Hispanic (% change since 2000)
Races - Native Hawaiian and Other Pacific Islander alone (%)
Races - Native Hawaiian and Other Pacific Islander alone (% change since 2000)
Races - Two or more races(%)
Races - Two or more races(% change since 2000)
Races - Other race alone (%)
Races - Other race alone (% change since 2000)
Racial diversity
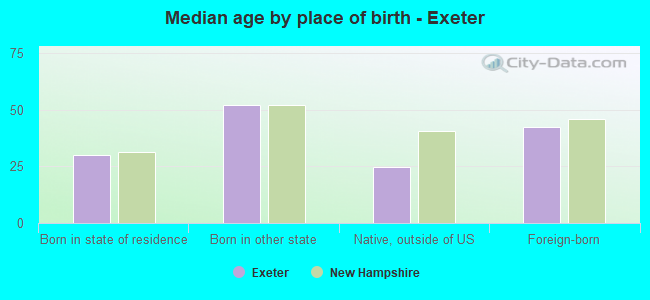
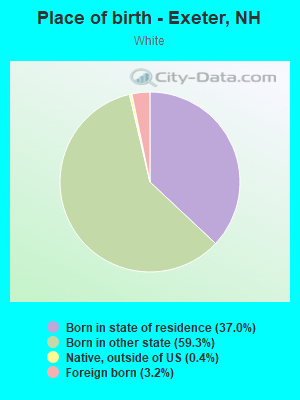
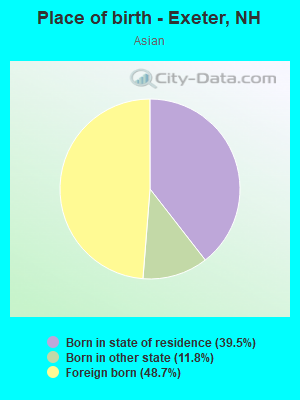
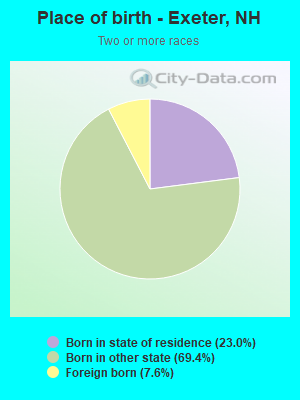
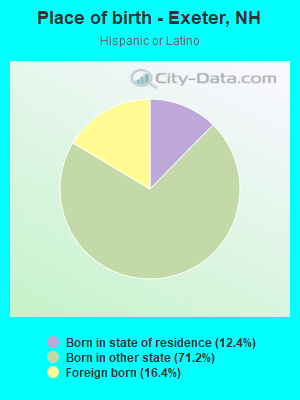
Place of birth - Born in state of residence (%)
Place of birth - Born in state of residence (%) - White
Place of birth - Born in state of residence (%) - Black or African American
Place of birth - Born in state of residence (%) - Asian
Place of birth - Born in state of residence (%) - Hispanic or Latino
Place of birth - Born in state of residence (%) - American Indian and Alaska Native
Place of birth - Born in state of residence (%) - Multirace
Place of birth - Born in state of residence (%) - Other Race
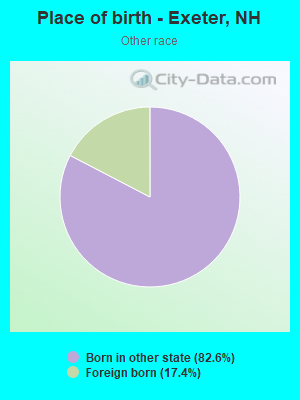
Place of birth - Born in other state (%)
Place of birth - Born in other state (%) - White
Place of birth - Born in other state (%) - Black or African American
Place of birth - Born in other state (%) - Asian
Place of birth - Born in other state (%) - Hispanic or Latino
Place of birth - Born in other state (%) - American Indian and Alaska Native
Place of birth - Born in other state (%) - Multirace
Place of birth - Born in other state (%) - Other Race
Place of birth - Native, outside of US (%)
Place of birth - Native, outside of US (%) - White
Place of birth - Native, outside of US (%) - Black or African American
Place of birth - Native, outside of US (%) - Asian
Place of birth - Native, outside of US (%) - Hispanic or Latino
Place of birth - Native, outside of US (%) - American Indian and Alaska Native
Place of birth - Native, outside of US (%) - Multirace
Place of birth - Native, outside of US (%) - Other Race
Place of birth - Foreign born (%)
Place of birth - Foreign born (%) - White
Place of birth - Foreign born (%) - Black or African American
Place of birth - Foreign born (%) - Asian
Place of birth - Foreign born (%) - Hispanic or Latino
Place of birth - Foreign born (%) - American Indian and Alaska Native
Place of birth - Foreign born (%) - Multirace
Place of birth - Foreign born (%) - Other Race
Residents speaking English at home (%)
Residents speaking English at home - Born in the United States (%)
Residents speaking English at home - Native, born elsewhere (%)
Residents speaking English at home - Foreign born (%)
Residents speaking Spanish at home (%)
Residents speaking Spanish at home - Born in the United States (%)
Residents speaking Spanish at home - Native, born elsewhere (%)
Residents speaking Spanish at home - Foreign born (%)
Residents speaking other language at home (%)
Residents speaking other language at home - Born in the United States (%)
Residents speaking other language at home - Native, born elsewhere (%)
Residents speaking other language at home - Foreign born (%)
Marital status - Never married (%)
Marital status - Now married (%)
Marital status - Separated (%)
Marital status - Widowed (%)
Marital status - Divorced (%)
Ancestries Reported - Arab (%)
Ancestries Reported - Czech (%)
Ancestries Reported - Danish (%)
Ancestries Reported - Dutch (%)
Ancestries Reported - English (%)
Ancestries Reported - French (%)
Ancestries Reported - French Canadian (%)
Ancestries Reported - German (%)
Ancestries Reported - Greek (%)
Ancestries Reported - Hungarian (%)
Ancestries Reported - Irish (%)
Ancestries Reported - Italian (%)
Ancestries Reported - Lithuanian (%)
Ancestries Reported - Norwegian (%)
Ancestries Reported - Polish (%)
Ancestries Reported - Portuguese (%)
Ancestries Reported - Russian (%)
Ancestries Reported - Scotch-Irish (%)
Ancestries Reported - Scottish (%)
Ancestries Reported - Slovak (%)
Ancestries Reported - Subsaharan African (%)
Ancestries Reported - Swedish (%)
Ancestries Reported - Swiss (%)
Ancestries Reported - Ukrainian (%)
Ancestries Reported - United States (%)
Ancestries Reported - Welsh (%)
Ancestries Reported - West Indian (%)
Ancestries Reported - Other (%)
Geographical mobility - Same house 1 year ago (%)
Geographical mobility - Same house 1 year ago (%) - White
Geographical mobility - Same house 1 year ago (%) - Black or African American
Geographical mobility - Same house 1 year ago (%) - Asian
Geographical mobility - Same house 1 year ago (%) - Hispanic or Latino
Geographical mobility - Same house 1 year ago (%) - American Indian and Alaska Native
Geographical mobility - Same house 1 year ago (%) - Multirace
Geographical mobility - Same house 1 year ago (%) - Other Race
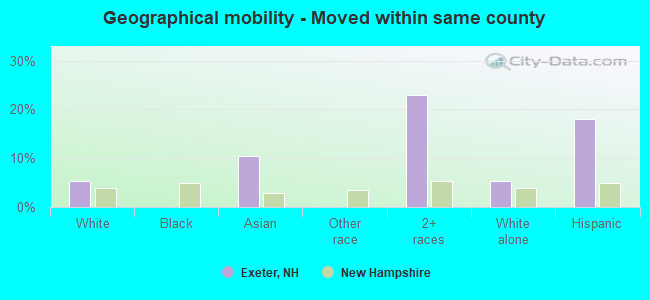
Geographical mobility - Moved within same county (%)
Geographical mobility - Moved within same county (%) - White
Geographical mobility - Moved within same county (%) - Black or African American
Geographical mobility - Moved within same county (%) - Asian
Geographical mobility - Moved within same county (%) - Hispanic or Latino
Geographical mobility - Moved within same county (%) - American Indian and Alaska Native
Geographical mobility - Moved within same county (%) - Multirace
Geographical mobility - Moved within same county (%) - Other Race
Geographical mobility - Moved from different county within same state (%)
Geographical mobility - Moved from different county within same state (%) - White
Geographical mobility - Moved from different county within same state (%) - Black or African American
Geographical mobility - Moved from different county within same state (%) - Asian
Geographical mobility - Moved from different county within same state (%) - Hispanic or Latino
Geographical mobility - Moved from different county within same state (%) - American Indian and Alaska Native
Geographical mobility - Moved from different county within same state (%) - Multirace
Geographical mobility - Moved from different county within same state (%) - Other Race
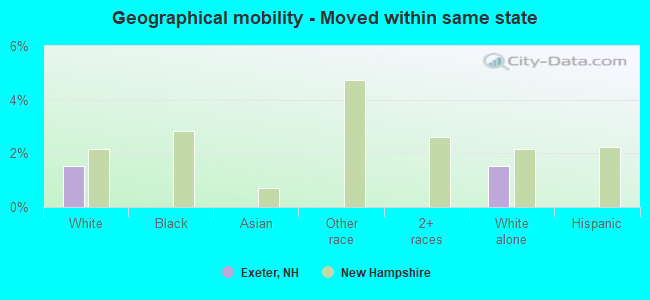
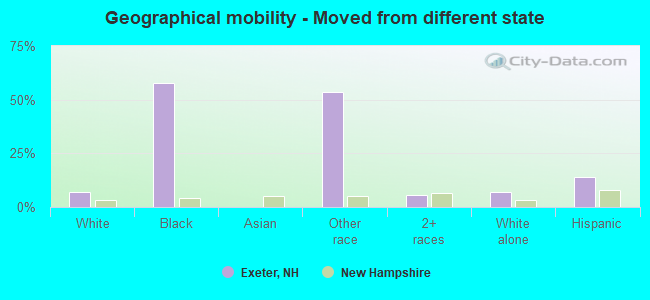
Geographical mobility - Moved from different state (%)
Geographical mobility - Moved from different state (%) - White
Geographical mobility - Moved from different state (%) - Black or African American
Geographical mobility - Moved from different state (%) - Asian
Geographical mobility - Moved from different state (%) - Hispanic or Latino
Geographical mobility - Moved from different state (%) - American Indian and Alaska Native
Geographical mobility - Moved from different state (%) - Multirace
Geographical mobility - Moved from different state (%) - Other Race
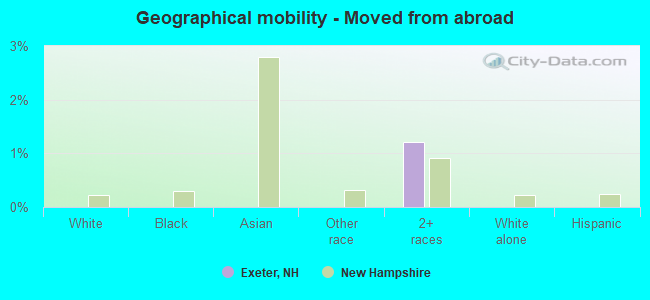
Geographical mobility - Moved from abroad (%)
Geographical mobility - Moved from abroad (%) - White
Geographical mobility - Moved from abroad (%) - Black or African American
Geographical mobility - Moved from abroad (%) - Asian
Geographical mobility - Moved from abroad (%) - Hispanic or Latino
Geographical mobility - Moved from abroad (%) - American Indian and Alaska Native
Geographical mobility - Moved from abroad (%) - Multirace
Geographical mobility - Moved from abroad (%) - Other Race
Place of birth for the foreign-born population - Ireland (%)
Place of birth for the foreign-born population - Denmark (%)
Place of birth for the foreign-born population - Norway (%)
Place of birth for the foreign-born population - Sweden (%)
Place of birth for the foreign-born population - United Kingdom (%)
Place of birth for the foreign-born population - England (%)
Place of birth for the foreign-born population - Scotland (%)
Place of birth for the foreign-born population - Other Northern Europe (%)
Place of birth for the foreign-born population - Austria (%)
Place of birth for the foreign-born population - Belgium (%)
Place of birth for the foreign-born population - France (%)
Place of birth for the foreign-born population - Germany (%)
Place of birth for the foreign-born population - Netherlands (%)
Place of birth for the foreign-born population - Switzerland (%)
Place of birth for the foreign-born population - Other Western Europe (%)
Place of birth for the foreign-born population - Greece (%)
Place of birth for the foreign-born population - Italy (%)
Place of birth for the foreign-born population - Portugal (%)
Place of birth for the foreign-born population - Spain (%)
Place of birth for the foreign-born population - Other Southern Europe (%)
Place of birth for the foreign-born population - Albania (%)
Place of birth for the foreign-born population - Belarus (%)
Place of birth for the foreign-born population - Bosnia and Herzegovina (%)
Place of birth for the foreign-born population - Bulgaria (%)
Place of birth for the foreign-born population - Croatia (%)
Place of birth for the foreign-born population - Czechoslovakia (%)
Place of birth for the foreign-born population - Hungary (%)
Place of birth for the foreign-born population - Latvia (%)
Place of birth for the foreign-born population - Lithuania (%)
Place of birth for the foreign-born population - North Macedonia (Macedonia) (%)
Place of birth for the foreign-born population - Moldova (%)
Place of birth for the foreign-born population - Poland (%)
Place of birth for the foreign-born population - Romania (%)
Place of birth for the foreign-born population - Russia (%)
Place of birth for the foreign-born population - Serbia (%)
Place of birth for the foreign-born population - Ukraine (%)
Place of birth for the foreign-born population - Other Eastern Europe (%)
Place of birth for the foreign-born population - China (%)
Place of birth for the foreign-born population - Hong Kong (%)
Place of birth for the foreign-born population - Taiwan (%)
Place of birth for the foreign-born population - Japan (%)
Place of birth for the foreign-born population - Korea (%)
Place of birth for the foreign-born population - Other Eastern Asia (%)
Place of birth for the foreign-born population - Afghanistan (%)
Place of birth for the foreign-born population - Bangladesh (%)
Place of birth for the foreign-born population - India (%)
Place of birth for the foreign-born population - Iran (%)
Place of birth for the foreign-born population - Kazakhstan (%)
Place of birth for the foreign-born population - Nepal (%)
Place of birth for the foreign-born population - Pakistan (%)
Place of birth for the foreign-born population - Sri Lanka (%)
Place of birth for the foreign-born population - Uzbekistan (%)
Place of birth for the foreign-born population - Other South Central Asia (%)
Place of birth for the foreign-born population - Burma (%)
Place of birth for the foreign-born population - Cambodia (%)
Place of birth for the foreign-born population - Indonesia (%)
Place of birth for the foreign-born population - Laos (%)
Place of birth for the foreign-born population - Malaysia (%)
Place of birth for the foreign-born population - Philippines (%)
Place of birth for the foreign-born population - Singapore (%)
Place of birth for the foreign-born population - Thailand (%)
Place of birth for the foreign-born population - Vietnam (%)
Place of birth for the foreign-born population - Other South Eastern Asia (%)
Place of birth for the foreign-born population - Armenia (%)
Place of birth for the foreign-born population - Iraq (%)
Place of birth for the foreign-born population - Israel (%)
Place of birth for the foreign-born population - Jordan (%)
Place of birth for the foreign-born population - Kuwait (%)
Place of birth for the foreign-born population - Lebanon (%)
Place of birth for the foreign-born population - Saudi Arabia (%)
Place of birth for the foreign-born population - Syria (%)
Place of birth for the foreign-born population - Turkey (%)
Place of birth for the foreign-born population - Yemen (%)
Place of birth for the foreign-born population - Other Western Asia (%)
Place of birth for the foreign-born population - Eritrea (%)
Place of birth for the foreign-born population - Ethiopia (%)
Place of birth for the foreign-born population - Kenya (%)
Place of birth for the foreign-born population - Somalia (%)
Place of birth for the foreign-born population - Uganda (%)
Place of birth for the foreign-born population - Zimbabwe (%)
Place of birth for the foreign-born population - Other Eastern Africa (%)
Place of birth for the foreign-born population - Cameroon (%)
Place of birth for the foreign-born population - Congo (%)
Place of birth for the foreign-born population - Democratic Republic of Congo (Zaire) (%)
Place of birth for the foreign-born population - Other Middle Africa (%)
Place of birth for the foreign-born population - Egypt (%)
Place of birth for the foreign-born population - Morocco (%)
Place of birth for the foreign-born population - Sudan (%)
Place of birth for the foreign-born population - Other Northern Africa (%)
Place of birth for the foreign-born population - South Africa (%)
Place of birth for the foreign-born population - Other Southern Africa (%)
Place of birth for the foreign-born population - Cabo Verde (%)
Place of birth for the foreign-born population - Ghana (%)
Place of birth for the foreign-born population - Liberia (%)
Place of birth for the foreign-born population - Nigeria (%)
Place of birth for the foreign-born population - Senegal (%)
Place of birth for the foreign-born population - Sierra Leone (%)
Place of birth for the foreign-born population - Other Western Africa (%)
Place of birth for the foreign-born population - Australia (%)
Place of birth for the foreign-born population - New Zealand (%)
Place of birth for the foreign-born population - Fiji (%)
Place of birth for the foreign-born population - Micronesia (%)
Place of birth for the foreign-born population - Bahamas (%)
Place of birth for the foreign-born population - Barbados (%)
Place of birth for the foreign-born population - Cuba (%)
Place of birth for the foreign-born population - Dominica (%)
Place of birth for the foreign-born population - Dominican Republic (%)
Place of birth for the foreign-born population - Grenada (%)
Place of birth for the foreign-born population - Haiti (%)
Place of birth for the foreign-born population - Jamaica (%)
Place of birth for the foreign-born population - St. Vincent and the Grenadines (%)
Place of birth for the foreign-born population - Trinidad and Tobago (%)
Place of birth for the foreign-born population - West Indies (%)
Place of birth for the foreign-born population - Other Caribbean (%)
Place of birth for the foreign-born population - Belize (%)
Place of birth for the foreign-born population - Costa Rica (%)
Place of birth for the foreign-born population - El Salvador (%)
Place of birth for the foreign-born population - Guatemala (%)
Place of birth for the foreign-born population - Honduras (%)
Place of birth for the foreign-born population - Mexico (%)
Place of birth for the foreign-born population - Nicaragua (%)
Place of birth for the foreign-born population - Panama (%)
Place of birth for the foreign-born population - Other Central America (%)
Place of birth for the foreign-born population - Argentina (%)
Place of birth for the foreign-born population - Bolivia (%)
Place of birth for the foreign-born population - Brazil (%)
Place of birth for the foreign-born population - Chile (%)
Place of birth for the foreign-born population - Colombia (%)
Place of birth for the foreign-born population - Ecuador (%)
Place of birth for the foreign-born population - Guyana (%)
Place of birth for the foreign-born population - Peru (%)
Place of birth for the foreign-born population - Uruguay (%)
Place of birth for the foreign-born population - Venezuela (%)
Place of birth for the foreign-born population - Other South America (%)
Place of birth for the foreign-born population - Canada (%)
Place of birth for the foreign-born population - Other Northern America (%)
Place of birth for the foreign-born population - Other (%)
Latest news about races in Exeter, NH collected exclusively by city-data.com from local newspapers, TV, and radio stations
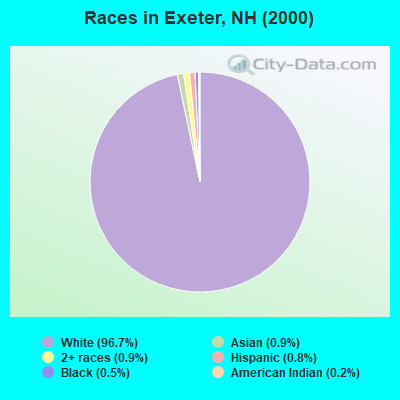
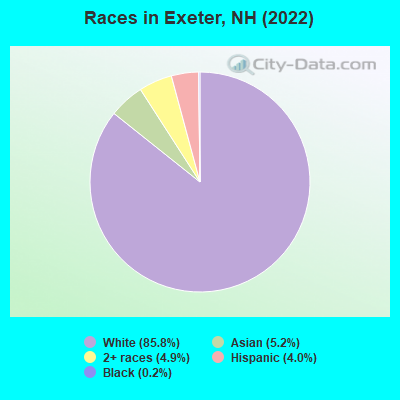
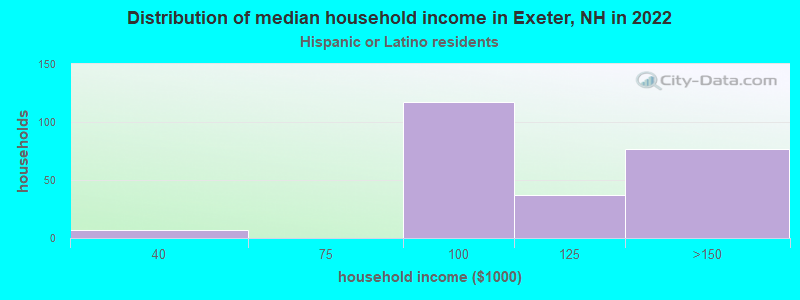
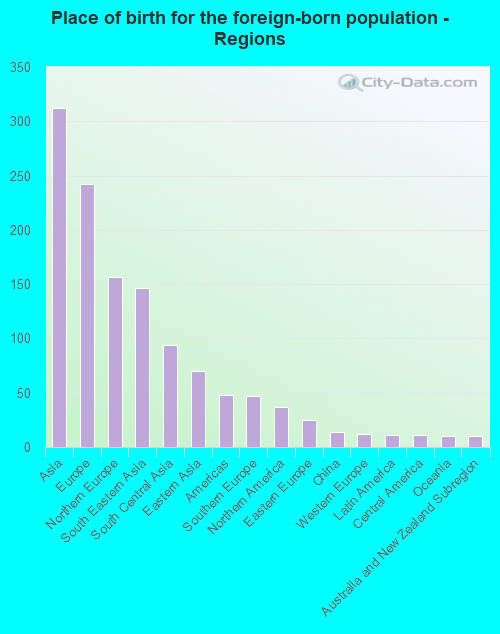
According to 2022 data, the most numerous races in Exeter, NH are White alone (8,620 residents), Hispanic (406 residents), and Two or more races (492 residents). 92.3% of Exeter residents speak English at home. 6.1% of Exeter, NH residents are foreign-born (3.1% born in Asia, 2.4% born in Europe), which is 18.0% greater than the foreign-born rate of 5.0% across the entire state of New Hampshire.
Race distribution in Exeter
2000 2022
1,175,252 95.1% White alone 20,489 1.7% Hispanic 15,803 1.3% Asian alone 11,606 0.9% Two or more races 8,354 0.7% Black alone 2,698 0.2% American Indian alone 1,254 0.1% Other race alone 330 0.03% Native Hawaiian and Other
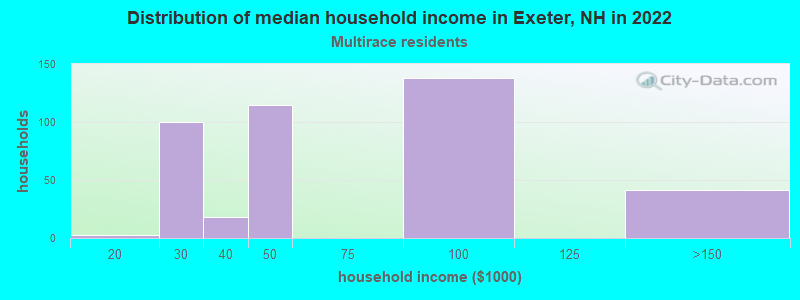
1,208,101 86.6% White alone 63,479 4.5% Hispanic 60,724 4.4% Two or more races 36,519 2.6% Asian alone 17,931 1.3% Black alone 6,615 0.5% Other race alone 1,014 0.07% American Indian alone 848 0.06% Native Hawaiian and Other
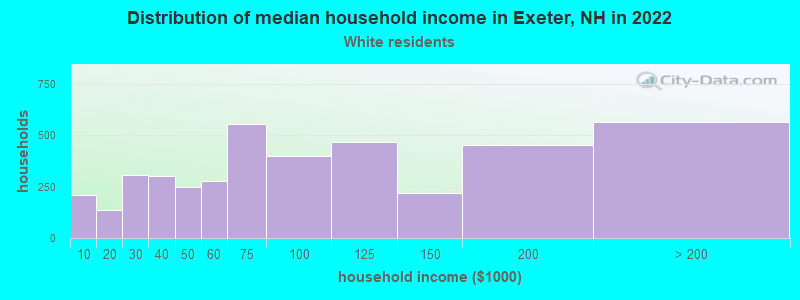
Income and house value in Exeter Median household income in 2022 $77,222 White non-Hispanic householders$90,170 Hispanic or Latino race householdersMedian 2022 house value $440,059 White Non-Hispanic householders $448,070 Asian householders$393,420 Two or more races householders
Median age by race in Exeter
48.9 Median age for White residents47.0 50.0 -701,973,000.3 Median age for Black or African American residents-670,623,144.7 -772,779,699.3 -859,452,735.5 Median age for American Indian / Alaska Native residents-772,357,722.8 -763,157,894.0 39.0 Median age for Asian residents55.2 37.9 -633,846,153.2 Median age for Native Hawaiian / Pacific Islander residents-666,666,666.0 -666,666,666.0 26.8 Median age for Other race residents-664,734,298.9 -594,752,186.0 47.4 Median age for Two or more races residents49.9 47.5 49.2 Median age for White alone residents46.4 50.3 45.6 Median age for Hispanic or Latino residents53.4 26.1
Owner/renter occupied households by race in Exeter
House owners and renters - White residents 2,566 61.8% Owner occupied1,584 38.2% Renter occupiedHouse owners and renters - Black or African American residents 56 100.0% Renter occupiedHouse owners and renters - Asian residents 40 55.7% Owner occupied32 44.3% Renter occupiedHouse owners and renters - Other race residents 74 100.0% Renter occupiedHouse owners and renters - Two or more races residents 92 26.3% Owner occupied257 73.7% Renter occupiedHouse owners and renters - White alone residents 2,561 61.6% Owner occupied1,598 38.4% Renter occupiedHouse owners and renters - Hispanic or Latino residents 12 4.1% Owner occupied279 95.9% Renter occupied
Language usage in Exeter
English speakers - Total 92.3% of residents of Exeter speak English at home.
3.8% of residents speak Spanish at home 337 91.1% Speak English very well33 8.9% Speak English less than very well4.2% of residents speak other language at home 306 74.8% Speak English very well103 25.2% Speak English less than very well
English speakers - Born in the United States 95.5% of residents of Exeter speak English at home.
4.4% of residents speak Spanish at home 224 86.8% Speak English very well34 13.2% Speak English less than very well0.8% of residents speak other language at home 22 44.9% Speak English very well27 55.1% Speak English less than very well
English speakers - Native, born elsewhere 90.0% of residents of Exeter speak English at home.
English speakers - Foreign-born 39.9% of residents of Exeter speak English at home.
8.4% of residents speak Spanish at home 55 100.0% Speak English very well47.2% of residents speak other language at home 229 74.1% Speak English very well80 25.9% Speak English less than very well
White (Caucasian) - Speak only English Native:
98.4% (8,036)Foreign-born:
80.2% (223)
White (Caucasian) - Speak another language Native:
1.6% (133)Foreign-born:
15.8% (44)
Asian - Speak only English Native:
77.9% (153)Foreign-born:
11.3% (32)
Asian - Speak another language Native:
24.7% (49)Foreign-born:
91.4% (254)
Other race - Speak another language Native:
62.1% (65)Foreign-born:
100.0% (23)
Two or more races - Speak another language Native:
29.3% (208)Foreign-born:
99.5% (61)
White alone - Speak only English Native:
98.1% (7,997)Foreign-born:
71.8% (214)
White alone - Speak another language Native:
1.9% (158)Foreign-born:
17.5% (52)
Hispanic or Latino - Speak another language Native:
40.4% (119)Foreign-born:
94.9% (59)
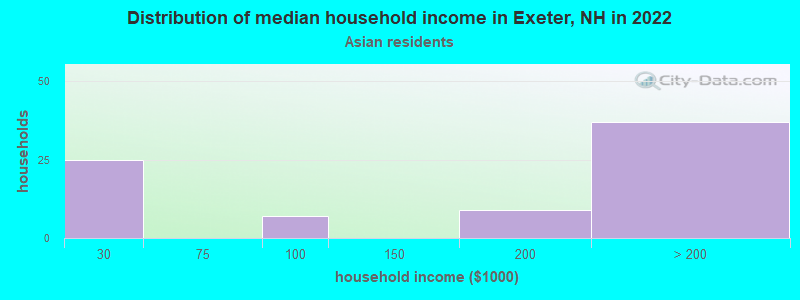
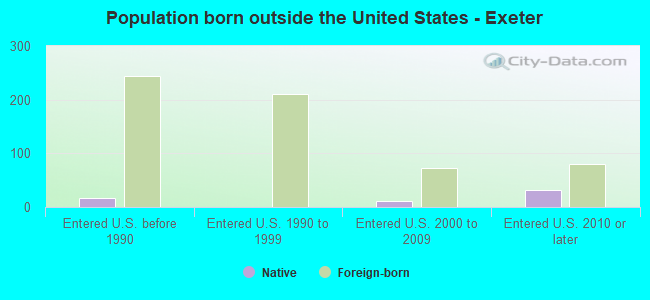
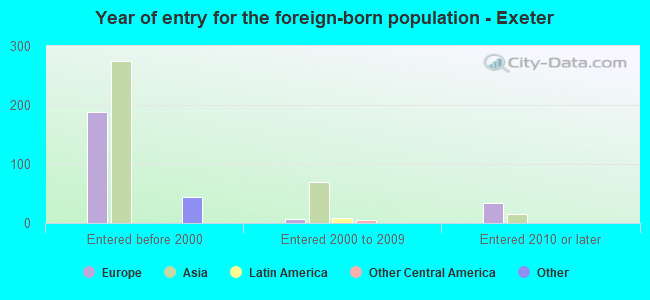
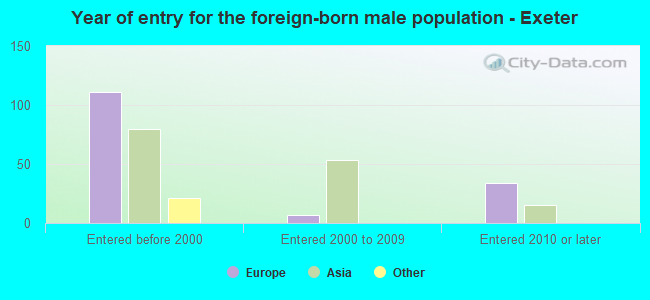
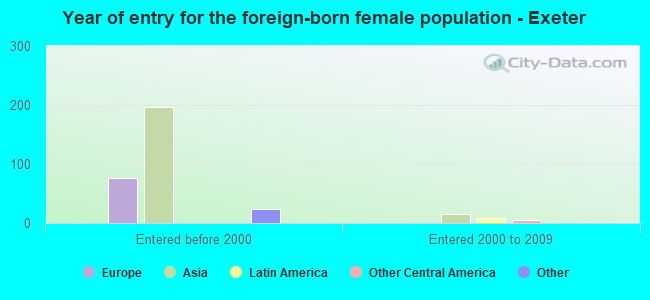
Foreign-born residents in Exeter 613 residents are foreign born (3.1% Asia , 2.4% Europe ).
This city:
6.1%New Hampshire:
6.0%
Marital status for residents in Exeter Marital status - White (Caucasian) population 15 years and over
Males 40.6% Never married47.0% Now married0.7% Separated5.2% Widowed6.5% DivorcedFemales 22.5% Never married38.4% Now married1.4% Separated11.2% Widowed26.5% DivorcedWomen who gave birth in the past 12 months Now married:
100.0% (112)Unmarried:
0.0% (0)
Women who did not give birth in the past 12 months Now married:
33.1% (595)Unmarried:
66.9% (1,201)
Marital status - Asian population 15 years and over
Males 18.8% Never married81.2% Now married0.0% Separated0.0% Widowed0.0% DivorcedFemales 77.1% Never married20.6% Now married0.0% Separated0.0% Widowed2.3% DivorcedWomen who did not give birth in the past 12 months Now married:
18.6% (55)Unmarried:
81.4% (240)
Marital status - Other race population 15 years and over
Males 0.0% Never married100.0% Now married0.0% Separated0.0% Widowed0.0% DivorcedFemales 0.0% Never married100.0% Now married0.0% Separated0.0% Widowed0.0% DivorcedWomen who did not give birth in the past 12 months Now married:
100.0% (20)Unmarried:
0.0% (0)
Marital status - Two or more races population 15 years and over
Males 45.3% Never married53.3% Now married0.0% Separated0.0% Widowed1.4% DivorcedFemales 14.6% Never married49.7% Now married0.0% Separated32.6% Widowed3.1% DivorcedWomen who did not give birth in the past 12 months Now married:
74.9% (171)Unmarried:
25.1% (57)
Marital status - White alone, not Hispanic / Latino population 15 years and over
Males 41.0% Never married46.4% Now married0.7% Separated5.3% Widowed6.6% DivorcedFemales 22.6% Never married38.2% Now married1.4% Separated11.2% Widowed26.6% DivorcedWomen who gave birth in the past 12 months Now married:
100.0% (112)Unmarried:
0.0% (0)
Women who did not give birth in the past 12 months Now married:
32.8% (590)Unmarried:
67.2% (1,208)
Marital status - Hispanic or Latino population 15 years and over
Males 0.0% Never married100.0% Now married0.0% Separated0.0% Widowed0.0% DivorcedFemales 14.9% Never married60.6% Now married0.0% Separated14.9% Widowed9.6% DivorcedWomen who did not give birth in the past 12 months Now married:
70.2% (38)Unmarried:
29.8% (16)
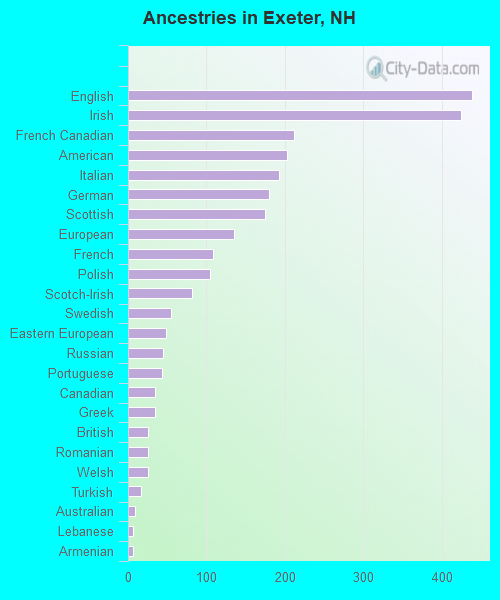
Ancestries in Exeter
438 13.6% English424 13.1% Irish211 6.5% French Canadian202 6.3% American192 5.9% Italian179 5.5% German174 5.4% Scottish135 4.2% European108 3.3% French105 3.3% Polish82 2.5% Scotch-Irish55 1.7% Swedish49 1.5% Eastern European44 1.4% Russian43 1.3% Portuguese35 1.1% Canadian34 1.1% Greek26 0.8% British25 0.8% Romanian25 0.8% Welsh17 0.5% Turkish9 0.3% Australian7 0.2% Lebanese7 0.2% Armenian
Children Nativity (place of birth) in Exeter
Children under 6 years - Living with two parents Both parents native 218 100.0% NativeOne native, one foreign-born parent 87 100.0% NativeChildren under 6 years - Living with one parent Native parent 30 100.0% NativeChildren 6 to 17 years - Living with two parents Both parents native 743 100.0% NativeBoth parents foreign-born 8 100.0% NativeChildren 6 to 17 years - Living with one parent Native parent 150 100.0% NativeForeign-born parent 51 50.0% Native51 50.0% Foreign-born