Races in Fair Lawn, New Jersey (NJ) Detailed Stats
Data:
Races - White alone (%)
Races - White alone (% change since 2000)
Races - Black alone (%)
Races - Black alone (% change since 2000)
Races - American Indian alone (%)
Races - American Indian alone (% change since 2000)
Races - Asian alone (%)
Races - Asian alone (% change since 2000)
Races - Hispanic (%)
Races - Hispanic (% change since 2000)
Races - Native Hawaiian and Other Pacific Islander alone (%)
Races - Native Hawaiian and Other Pacific Islander alone (% change since 2000)
Races - Two or more races(%)
Races - Two or more races(% change since 2000)
Races - Other race alone (%)
Races - Other race alone (% change since 2000)
Racial diversity
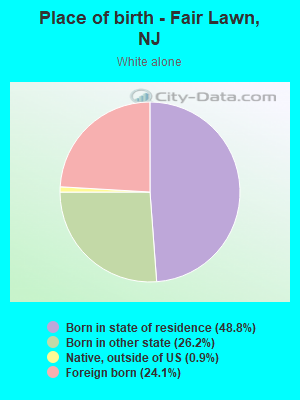
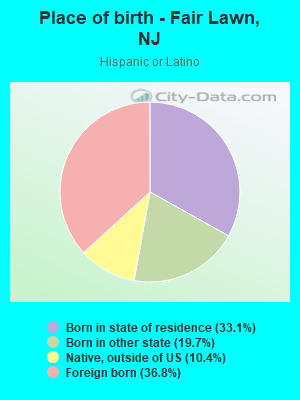
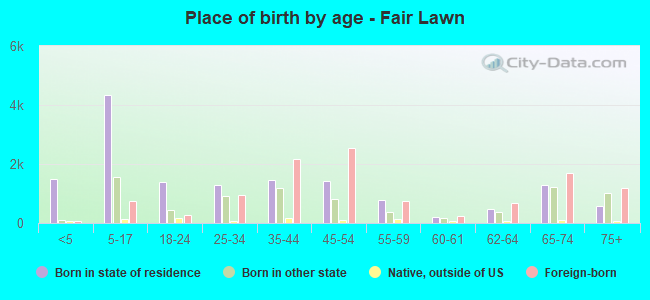
Place of birth - Born in state of residence (%)
Place of birth - Born in state of residence (%) - White
Place of birth - Born in state of residence (%) - Black or African American
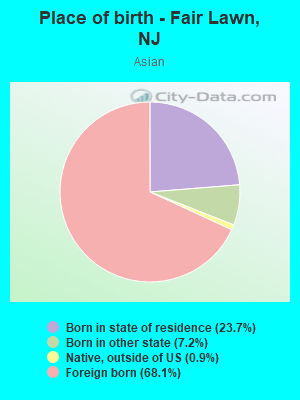
Place of birth - Born in state of residence (%) - Asian
Place of birth - Born in state of residence (%) - Hispanic or Latino
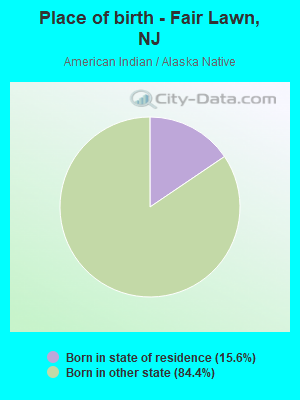
Place of birth - Born in state of residence (%) - American Indian and Alaska Native
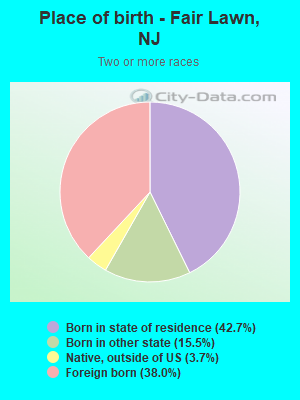
Place of birth - Born in state of residence (%) - Multirace
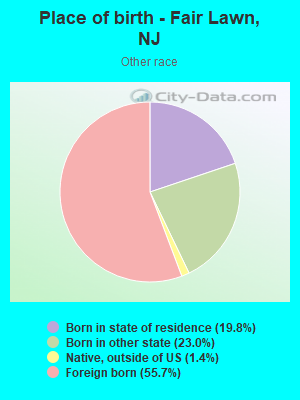
Place of birth - Born in state of residence (%) - Other Race
Place of birth - Born in other state (%)
Place of birth - Born in other state (%) - White
Place of birth - Born in other state (%) - Black or African American
Place of birth - Born in other state (%) - Asian
Place of birth - Born in other state (%) - Hispanic or Latino
Place of birth - Born in other state (%) - American Indian and Alaska Native
Place of birth - Born in other state (%) - Multirace
Place of birth - Born in other state (%) - Other Race
Place of birth - Native, outside of US (%)
Place of birth - Native, outside of US (%) - White
Place of birth - Native, outside of US (%) - Black or African American
Place of birth - Native, outside of US (%) - Asian
Place of birth - Native, outside of US (%) - Hispanic or Latino
Place of birth - Native, outside of US (%) - American Indian and Alaska Native
Place of birth - Native, outside of US (%) - Multirace
Place of birth - Native, outside of US (%) - Other Race
Place of birth - Foreign born (%)
Place of birth - Foreign born (%) - White
Place of birth - Foreign born (%) - Black or African American
Place of birth - Foreign born (%) - Asian
Place of birth - Foreign born (%) - Hispanic or Latino
Place of birth - Foreign born (%) - American Indian and Alaska Native
Place of birth - Foreign born (%) - Multirace
Place of birth - Foreign born (%) - Other Race
Residents speaking English at home (%)
Residents speaking English at home - Born in the United States (%)
Residents speaking English at home - Native, born elsewhere (%)
Residents speaking English at home - Foreign born (%)
Residents speaking Spanish at home (%)
Residents speaking Spanish at home - Born in the United States (%)
Residents speaking Spanish at home - Native, born elsewhere (%)
Residents speaking Spanish at home - Foreign born (%)
Residents speaking other language at home (%)
Residents speaking other language at home - Born in the United States (%)
Residents speaking other language at home - Native, born elsewhere (%)
Residents speaking other language at home - Foreign born (%)
Marital status - Never married (%)
Marital status - Now married (%)
Marital status - Separated (%)
Marital status - Widowed (%)
Marital status - Divorced (%)
Ancestries Reported - Arab (%)
Ancestries Reported - Czech (%)
Ancestries Reported - Danish (%)
Ancestries Reported - Dutch (%)
Ancestries Reported - English (%)
Ancestries Reported - French (%)
Ancestries Reported - French Canadian (%)
Ancestries Reported - German (%)
Ancestries Reported - Greek (%)
Ancestries Reported - Hungarian (%)
Ancestries Reported - Irish (%)
Ancestries Reported - Italian (%)
Ancestries Reported - Lithuanian (%)
Ancestries Reported - Norwegian (%)
Ancestries Reported - Polish (%)
Ancestries Reported - Portuguese (%)
Ancestries Reported - Russian (%)
Ancestries Reported - Scotch-Irish (%)
Ancestries Reported - Scottish (%)
Ancestries Reported - Slovak (%)
Ancestries Reported - Subsaharan African (%)
Ancestries Reported - Swedish (%)
Ancestries Reported - Swiss (%)
Ancestries Reported - Ukrainian (%)
Ancestries Reported - United States (%)
Ancestries Reported - Welsh (%)
Ancestries Reported - West Indian (%)
Ancestries Reported - Other (%)
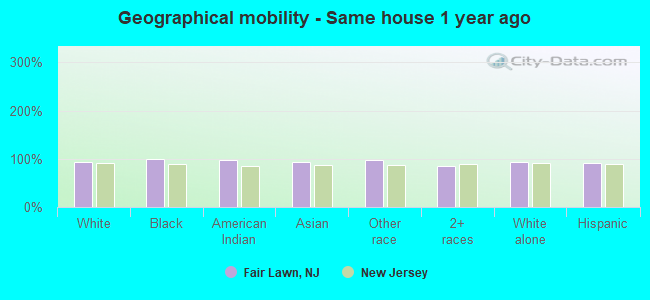
Geographical mobility - Same house 1 year ago (%)
Geographical mobility - Same house 1 year ago (%) - White
Geographical mobility - Same house 1 year ago (%) - Black or African American
Geographical mobility - Same house 1 year ago (%) - Asian
Geographical mobility - Same house 1 year ago (%) - Hispanic or Latino
Geographical mobility - Same house 1 year ago (%) - American Indian and Alaska Native
Geographical mobility - Same house 1 year ago (%) - Multirace
Geographical mobility - Same house 1 year ago (%) - Other Race
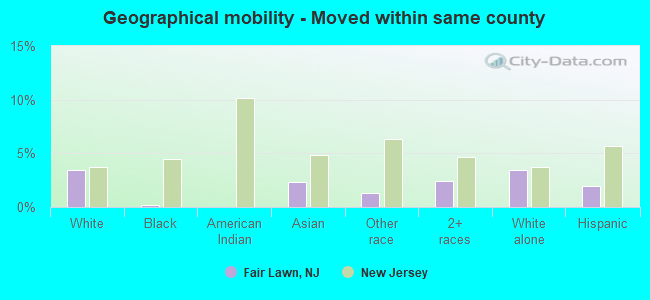
Geographical mobility - Moved within same county (%)
Geographical mobility - Moved within same county (%) - White
Geographical mobility - Moved within same county (%) - Black or African American
Geographical mobility - Moved within same county (%) - Asian
Geographical mobility - Moved within same county (%) - Hispanic or Latino
Geographical mobility - Moved within same county (%) - American Indian and Alaska Native
Geographical mobility - Moved within same county (%) - Multirace
Geographical mobility - Moved within same county (%) - Other Race
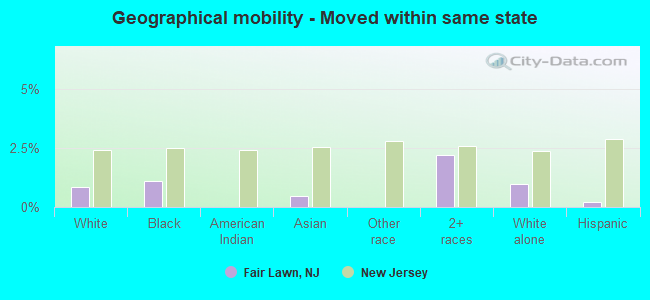
Geographical mobility - Moved from different county within same state (%)
Geographical mobility - Moved from different county within same state (%) - White
Geographical mobility - Moved from different county within same state (%) - Black or African American
Geographical mobility - Moved from different county within same state (%) - Asian
Geographical mobility - Moved from different county within same state (%) - Hispanic or Latino
Geographical mobility - Moved from different county within same state (%) - American Indian and Alaska Native
Geographical mobility - Moved from different county within same state (%) - Multirace
Geographical mobility - Moved from different county within same state (%) - Other Race
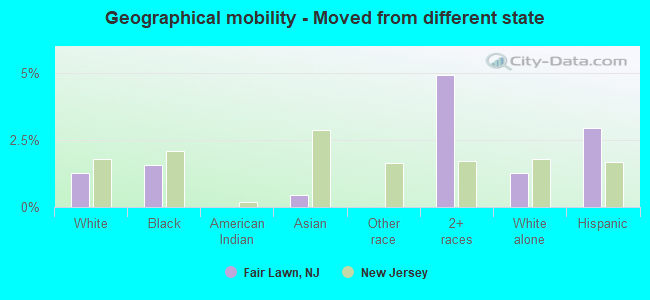
Geographical mobility - Moved from different state (%)
Geographical mobility - Moved from different state (%) - White
Geographical mobility - Moved from different state (%) - Black or African American
Geographical mobility - Moved from different state (%) - Asian
Geographical mobility - Moved from different state (%) - Hispanic or Latino
Geographical mobility - Moved from different state (%) - American Indian and Alaska Native
Geographical mobility - Moved from different state (%) - Multirace
Geographical mobility - Moved from different state (%) - Other Race
Geographical mobility - Moved from abroad (%)
Geographical mobility - Moved from abroad (%) - White
Geographical mobility - Moved from abroad (%) - Black or African American
Geographical mobility - Moved from abroad (%) - Asian
Geographical mobility - Moved from abroad (%) - Hispanic or Latino
Geographical mobility - Moved from abroad (%) - American Indian and Alaska Native
Geographical mobility - Moved from abroad (%) - Multirace
Geographical mobility - Moved from abroad (%) - Other Race
Place of birth for the foreign-born population - Ireland (%)
Place of birth for the foreign-born population - Denmark (%)
Place of birth for the foreign-born population - Norway (%)
Place of birth for the foreign-born population - Sweden (%)
Place of birth for the foreign-born population - United Kingdom (%)
Place of birth for the foreign-born population - England (%)
Place of birth for the foreign-born population - Scotland (%)
Place of birth for the foreign-born population - Other Northern Europe (%)
Place of birth for the foreign-born population - Austria (%)
Place of birth for the foreign-born population - Belgium (%)
Place of birth for the foreign-born population - France (%)
Place of birth for the foreign-born population - Germany (%)
Place of birth for the foreign-born population - Netherlands (%)
Place of birth for the foreign-born population - Switzerland (%)
Place of birth for the foreign-born population - Other Western Europe (%)
Place of birth for the foreign-born population - Greece (%)
Place of birth for the foreign-born population - Italy (%)
Place of birth for the foreign-born population - Portugal (%)
Place of birth for the foreign-born population - Spain (%)
Place of birth for the foreign-born population - Other Southern Europe (%)
Place of birth for the foreign-born population - Albania (%)
Place of birth for the foreign-born population - Belarus (%)
Place of birth for the foreign-born population - Bosnia and Herzegovina (%)
Place of birth for the foreign-born population - Bulgaria (%)
Place of birth for the foreign-born population - Croatia (%)
Place of birth for the foreign-born population - Czechoslovakia (%)
Place of birth for the foreign-born population - Hungary (%)
Place of birth for the foreign-born population - Latvia (%)
Place of birth for the foreign-born population - Lithuania (%)
Place of birth for the foreign-born population - North Macedonia (Macedonia) (%)
Place of birth for the foreign-born population - Moldova (%)
Place of birth for the foreign-born population - Poland (%)
Place of birth for the foreign-born population - Romania (%)
Place of birth for the foreign-born population - Russia (%)
Place of birth for the foreign-born population - Serbia (%)
Place of birth for the foreign-born population - Ukraine (%)
Place of birth for the foreign-born population - Other Eastern Europe (%)
Place of birth for the foreign-born population - China (%)
Place of birth for the foreign-born population - Hong Kong (%)
Place of birth for the foreign-born population - Taiwan (%)
Place of birth for the foreign-born population - Japan (%)
Place of birth for the foreign-born population - Korea (%)
Place of birth for the foreign-born population - Other Eastern Asia (%)
Place of birth for the foreign-born population - Afghanistan (%)
Place of birth for the foreign-born population - Bangladesh (%)
Place of birth for the foreign-born population - India (%)
Place of birth for the foreign-born population - Iran (%)
Place of birth for the foreign-born population - Kazakhstan (%)
Place of birth for the foreign-born population - Nepal (%)
Place of birth for the foreign-born population - Pakistan (%)
Place of birth for the foreign-born population - Sri Lanka (%)
Place of birth for the foreign-born population - Uzbekistan (%)
Place of birth for the foreign-born population - Other South Central Asia (%)
Place of birth for the foreign-born population - Burma (%)
Place of birth for the foreign-born population - Cambodia (%)
Place of birth for the foreign-born population - Indonesia (%)
Place of birth for the foreign-born population - Laos (%)
Place of birth for the foreign-born population - Malaysia (%)
Place of birth for the foreign-born population - Philippines (%)
Place of birth for the foreign-born population - Singapore (%)
Place of birth for the foreign-born population - Thailand (%)
Place of birth for the foreign-born population - Vietnam (%)
Place of birth for the foreign-born population - Other South Eastern Asia (%)
Place of birth for the foreign-born population - Armenia (%)
Place of birth for the foreign-born population - Iraq (%)
Place of birth for the foreign-born population - Israel (%)
Place of birth for the foreign-born population - Jordan (%)
Place of birth for the foreign-born population - Kuwait (%)
Place of birth for the foreign-born population - Lebanon (%)
Place of birth for the foreign-born population - Saudi Arabia (%)
Place of birth for the foreign-born population - Syria (%)
Place of birth for the foreign-born population - Turkey (%)
Place of birth for the foreign-born population - Yemen (%)
Place of birth for the foreign-born population - Other Western Asia (%)
Place of birth for the foreign-born population - Eritrea (%)
Place of birth for the foreign-born population - Ethiopia (%)
Place of birth for the foreign-born population - Kenya (%)
Place of birth for the foreign-born population - Somalia (%)
Place of birth for the foreign-born population - Uganda (%)
Place of birth for the foreign-born population - Zimbabwe (%)
Place of birth for the foreign-born population - Other Eastern Africa (%)
Place of birth for the foreign-born population - Cameroon (%)
Place of birth for the foreign-born population - Congo (%)
Place of birth for the foreign-born population - Democratic Republic of Congo (Zaire) (%)
Place of birth for the foreign-born population - Other Middle Africa (%)
Place of birth for the foreign-born population - Egypt (%)
Place of birth for the foreign-born population - Morocco (%)
Place of birth for the foreign-born population - Sudan (%)
Place of birth for the foreign-born population - Other Northern Africa (%)
Place of birth for the foreign-born population - South Africa (%)
Place of birth for the foreign-born population - Other Southern Africa (%)
Place of birth for the foreign-born population - Cabo Verde (%)
Place of birth for the foreign-born population - Ghana (%)
Place of birth for the foreign-born population - Liberia (%)
Place of birth for the foreign-born population - Nigeria (%)
Place of birth for the foreign-born population - Senegal (%)
Place of birth for the foreign-born population - Sierra Leone (%)
Place of birth for the foreign-born population - Other Western Africa (%)
Place of birth for the foreign-born population - Australia (%)
Place of birth for the foreign-born population - New Zealand (%)
Place of birth for the foreign-born population - Fiji (%)
Place of birth for the foreign-born population - Micronesia (%)
Place of birth for the foreign-born population - Bahamas (%)
Place of birth for the foreign-born population - Barbados (%)
Place of birth for the foreign-born population - Cuba (%)
Place of birth for the foreign-born population - Dominica (%)
Place of birth for the foreign-born population - Dominican Republic (%)
Place of birth for the foreign-born population - Grenada (%)
Place of birth for the foreign-born population - Haiti (%)
Place of birth for the foreign-born population - Jamaica (%)
Place of birth for the foreign-born population - St. Vincent and the Grenadines (%)
Place of birth for the foreign-born population - Trinidad and Tobago (%)
Place of birth for the foreign-born population - West Indies (%)
Place of birth for the foreign-born population - Other Caribbean (%)
Place of birth for the foreign-born population - Belize (%)
Place of birth for the foreign-born population - Costa Rica (%)
Place of birth for the foreign-born population - El Salvador (%)
Place of birth for the foreign-born population - Guatemala (%)
Place of birth for the foreign-born population - Honduras (%)
Place of birth for the foreign-born population - Mexico (%)
Place of birth for the foreign-born population - Nicaragua (%)
Place of birth for the foreign-born population - Panama (%)
Place of birth for the foreign-born population - Other Central America (%)
Place of birth for the foreign-born population - Argentina (%)
Place of birth for the foreign-born population - Bolivia (%)
Place of birth for the foreign-born population - Brazil (%)
Place of birth for the foreign-born population - Chile (%)
Place of birth for the foreign-born population - Colombia (%)
Place of birth for the foreign-born population - Ecuador (%)
Place of birth for the foreign-born population - Guyana (%)
Place of birth for the foreign-born population - Peru (%)
Place of birth for the foreign-born population - Uruguay (%)
Place of birth for the foreign-born population - Venezuela (%)
Place of birth for the foreign-born population - Other South America (%)
Place of birth for the foreign-born population - Canada (%)
Place of birth for the foreign-born population - Other Northern America (%)
Place of birth for the foreign-born population - Other (%)
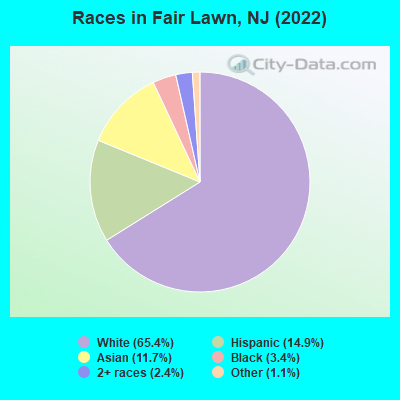
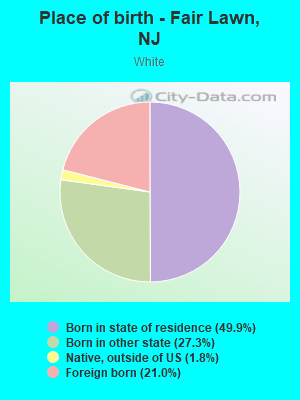
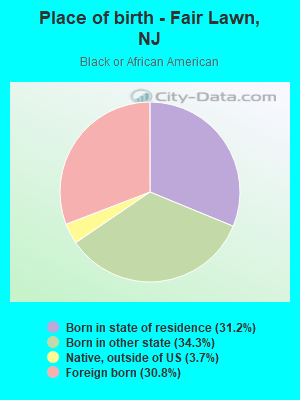
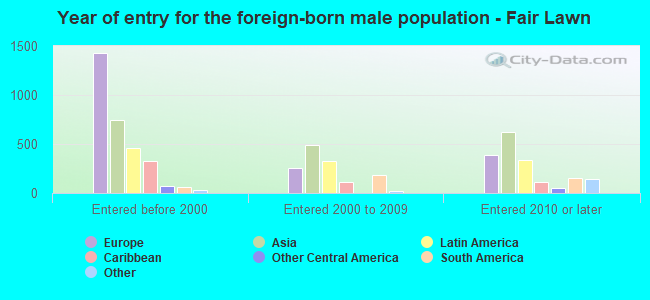
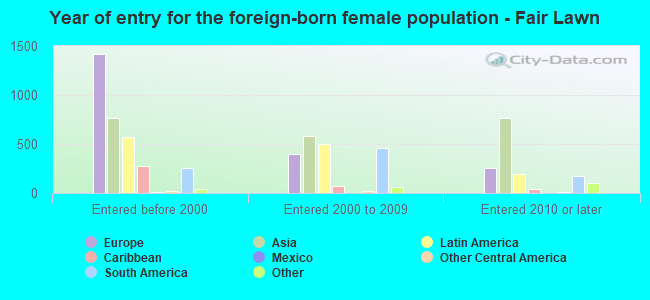
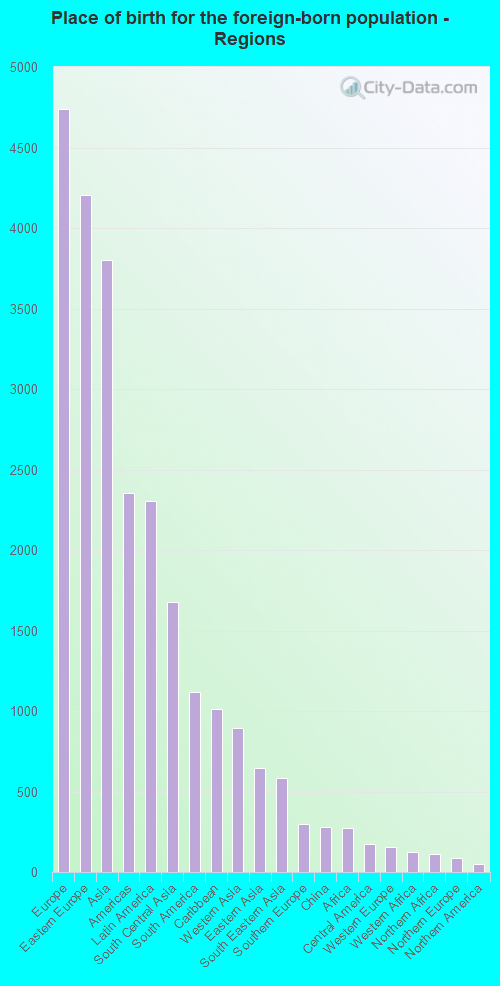
According to 2022 data, the most numerous races in Fair Lawn, NJ are White alone (22,855 residents), Hispanic (5,191 residents), and Black alone (1,194 residents). 57.9% of Fair Lawn residents speak English at home. 32.0% of Fair Lawn, NJ residents are foreign-born (13.2% born in Europe, 10.6% born in Asia, 6.4% born in Latin America), which is 28.1% greater than the foreign-born rate of 23.0% across the entire state of New Jersey.
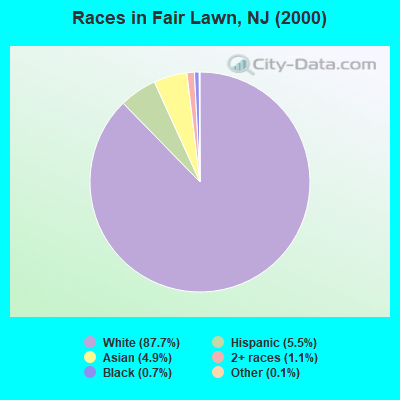
Race distribution in Fair Lawn
2000 2022
5,557,209 66.0% White alone 1,117,191 13.3% Hispanic 1,096,171 13.0% Black alone 477,012 5.7% Asian alone 133,689 1.6% Two or more races 19,565 0.2% Other race alone 11,338 0.1% American Indian alone 2,175 0.03% Native Hawaiian and Other
4,766,476 51.5% White alone 2,028,470 21.9% Hispanic 1,111,632 12.0% Black alone 923,546 10.0% Asian alone 332,237 3.6% Two or more races 89,847 1.0% Other race alone 8,557 0.09% American Indian alone 934 0.01% Native Hawaiian and Other
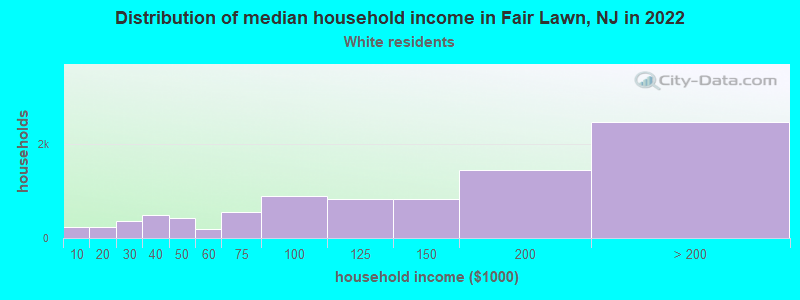
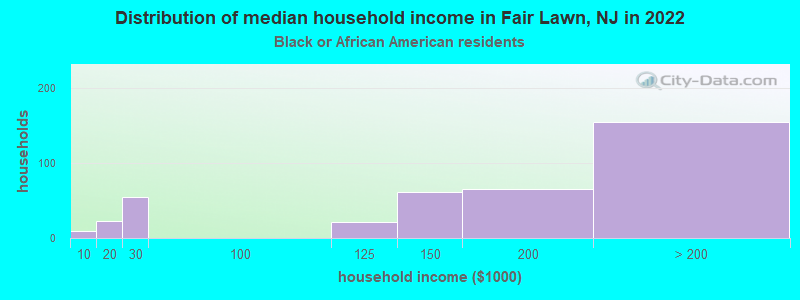
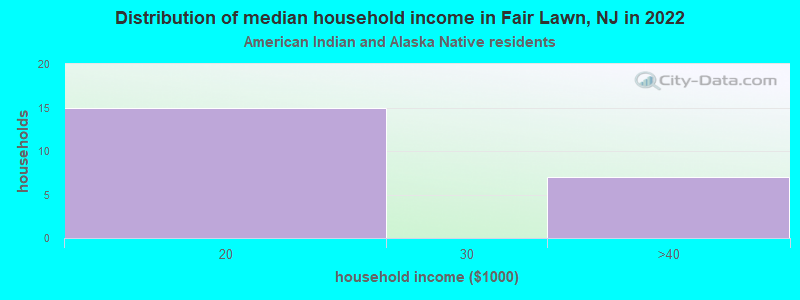
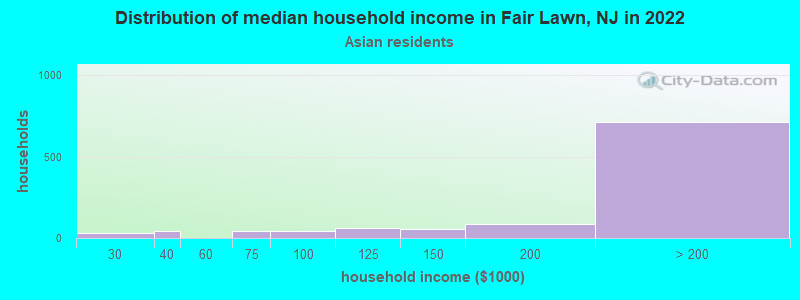
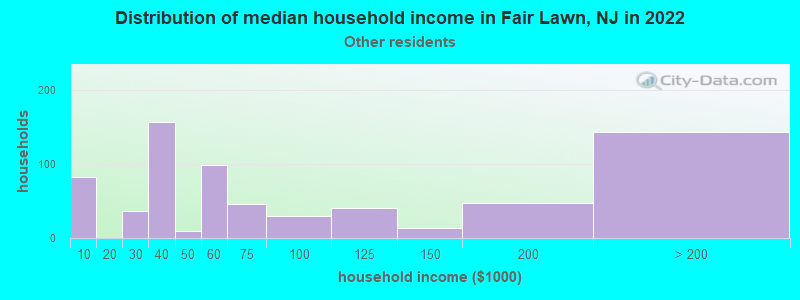
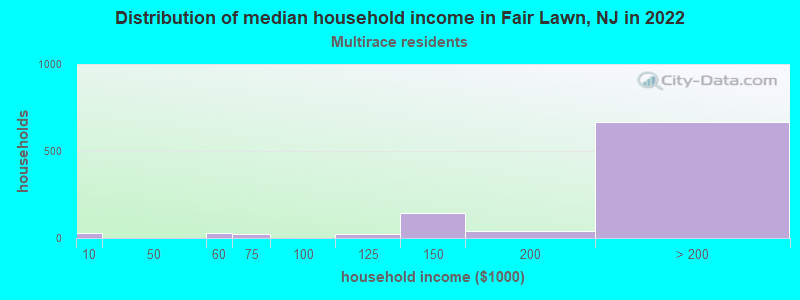
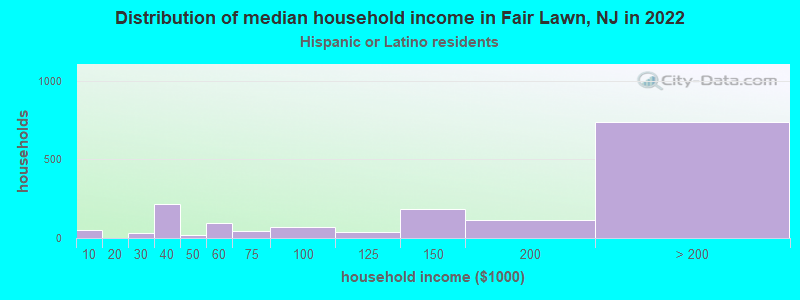
Income and house value in Fair Lawn Median household income in 2022 $125,214 White non-Hispanic householders$181,486 Black householdersover $200,000 Asian householders$53,985 Some other race householdersover $200,000 Two or more races householders$192,064 Hispanic or Latino race householdersMedian 2022 house value $506,426 White Non-Hispanic householders$523,167 Black or African American householders$523,167 American Indian or Alaska Native householders $534,095 Asian householders$534,328 Some other race householders$639,426 Two or more races householders$458,527 Hispanic or Latino householders
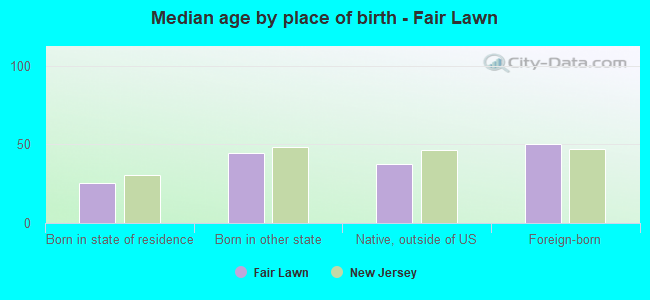
Median age by race in Fair Lawn
47.5 Median age for White residents47.3 47.6 43.5 Median age for Black or African American residents45.9 42.4 -766,197,182.3 Median age for American Indian / Alaska Native residents-686,322,685.6 -753,722,794.2 37.5 Median age for Asian residents37.0 38.2 -510,460,250.5 Median age for Native Hawaiian / Pacific Islander residents-514,767,932.0 -713,070,378.3 37.0 Median age for Other race residents36.0 48.8 27.1 Median age for Two or more races residents33.5 25.8 46.6 Median age for White alone residents47.0 46.6 37.7 Median age for Hispanic or Latino residents35.4 39.0
Owner/renter occupied households by race in Fair Lawn
House owners and renters - White residents 7,369 81.4% Owner occupied1,679 18.6% Renter occupiedHouse owners and renters - Black or African American residents 270 73.7% Owner occupied97 26.3% Renter occupiedHouse owners and renters - American Indian / Alaska Native residents 5 20.6% Owner occupied21 79.4% Renter occupiedHouse owners and renters - Asian residents 962 88.1% Owner occupied130 11.9% Renter occupiedHouse owners and renters - Other race residents 500 68.6% Owner occupied229 31.4% Renter occupiedHouse owners and renters - Two or more races residents 730 77.2% Owner occupied216 22.8% Renter occupiedHouse owners and renters - White alone residents 7,252 79.6% Owner occupied1,862 20.4% Renter occupiedHouse owners and renters - Hispanic or Latino residents 1,277 78.9% Owner occupied341 21.1% Renter occupied
Language usage in Fair Lawn
English speakers - Total 57.9% of residents of Fair Lawn speak English at home.
9.3% of residents speak Spanish at home 2,488 80.1% Speak English very well620 19.9% Speak English less than very well32.0% of residents speak other language at home 6,766 63.5% Speak English very well3,891 36.5% Speak English less than very well
English speakers - Born in the United States 75.3% of residents of Fair Lawn speak English at home.
10.2% of residents speak Spanish at home 733 89.6% Speak English very well85 10.4% Speak English less than very well14.6% of residents speak other language at home 1,128 96.2% Speak English very well45 3.8% Speak English less than very well
English speakers - Native, born elsewhere 34.8% of residents of Fair Lawn speak English at home.
39.0% of residents speak Spanish at home 259 76.2% Speak English very well81 23.8% Speak English less than very well23.1% of residents speak other language at home 127 63.2% Speak English very well74 36.8% Speak English less than very well
English speakers - Foreign-born 14.5% of residents of Fair Lawn speak English at home.
13.9% of residents speak Spanish at home 1,089 70.5% Speak English very well456 29.5% Speak English less than very well70.4% of residents speak other language at home 4,316 55.0% Speak English very well3,530 45.0% Speak English less than very well
White (Caucasian) - Speak only English Native:
87.0% (14,618)Foreign-born:
15.3% (718)
White (Caucasian) - Speak another language Native:
12.3% (2,069)Foreign-born:
83.2% (3,889)
Black or African American - Speak only English Native:
94.0% (773)Foreign-born:
78.3% (288)
Black or African American - Speak another language Native:
6.0% (49)Foreign-born:
24.6% (91)
Asian - Speak only English Native:
37.1% (432)Foreign-born:
9.3% (253)
Asian - Speak another language Native:
62.5% (728)Foreign-born:
90.7% (2,458)
Other race - Speak only English Native:
30.7% (182)Foreign-born:
19.0% (162)
Other race - Speak another language Native:
66.9% (396)Foreign-born:
71.6% (610)
Two or more races - Speak only English Native:
72.1% (1,531)Foreign-born:
11.8% (183)
Two or more races - Speak another language Native:
26.0% (553)Foreign-born:
88.1% (1,364)
White alone - Speak only English Native:
87.3% (14,358)Foreign-born:
11.7% (643)
White alone - Speak another language Native:
12.4% (2,043)Foreign-born:
88.6% (4,873)
Hispanic or Latino - Speak only English Native:
50.9% (1,476)Foreign-born:
14.2% (268)
Hispanic or Latino - Speak another language Native:
46.5% (1,348)Foreign-born:
86.7% (1,634)
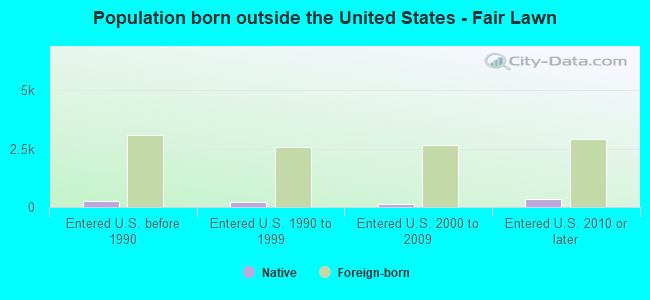
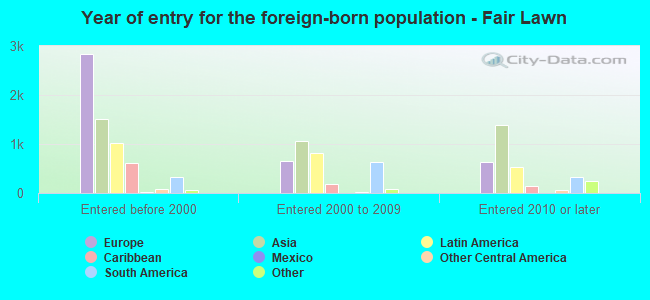
Foreign-born residents in Fair Lawn 11,179 residents are foreign born (13.2% Europe , 10.6% Asia , 6.4% Latin America ).
This city:
32.0%New Jersey:
23.2%
Marital status for residents in Fair Lawn Marital status - White (Caucasian) population 15 years and over
Males 24.7% Never married64.0% Now married0.5% Separated4.0% Widowed6.7% DivorcedFemales 23.2% Never married56.6% Now married0.8% Separated8.6% Widowed10.9% DivorcedWomen who gave birth in the past 12 months Now married:
78.9% (136)Unmarried:
21.1% (36)
Women who did not give birth in the past 12 months Now married:
48.3% (1,990)Unmarried:
51.7% (2,131)
Marital status - Black or African American population 15 years and over
Males 49.2% Never married41.2% Now married0.0% Separated2.5% Widowed7.0% DivorcedFemales 36.8% Never married36.1% Now married10.2% Separated1.9% Widowed14.9% DivorcedWomen who gave birth in the past 12 months Now married:
100.0% (28)Unmarried:
0.0% (0)
Women who did not give birth in the past 12 months Now married:
43.2% (150)Unmarried:
56.8% (198)
Marital status - Asian population 15 years and over
Males 28.0% Never married64.6% Now married0.7% Separated1.7% Widowed4.9% DivorcedFemales 15.3% Never married70.4% Now married0.0% Separated2.9% Widowed11.3% DivorcedWomen who gave birth in the past 12 months Now married:
100.0% (51)Unmarried:
0.0% (0)
Women who did not give birth in the past 12 months Now married:
80.0% (770)Unmarried:
20.0% (192)
Marital status - Other race population 15 years and over
Males 48.1% Never married39.0% Now married0.0% Separated6.5% Widowed6.5% DivorcedFemales 23.2% Never married43.5% Now married2.2% Separated5.7% Widowed25.2% DivorcedWomen who gave birth in the past 12 months Now married:
100.0% (55)Unmarried:
0.0% (0)
Women who did not give birth in the past 12 months Now married:
37.4% (113)Unmarried:
62.6% (189)
Marital status - Two or more races population 15 years and over
Males 47.4% Never married46.2% Now married2.6% Separated0.0% Widowed3.8% DivorcedFemales 34.8% Never married58.6% Now married0.0% Separated1.2% Widowed5.4% DivorcedWomen who gave birth in the past 12 months Now married:
41.2% (10)Unmarried:
58.8% (15)
Women who did not give birth in the past 12 months Now married:
54.0% (585)Unmarried:
46.0% (498)
Marital status - White alone, not Hispanic / Latino population 15 years and over
Males 24.5% Never married63.2% Now married0.6% Separated4.4% Widowed7.3% DivorcedFemales 23.5% Never married55.8% Now married0.9% Separated9.1% Widowed10.8% DivorcedWomen who gave birth in the past 12 months Now married:
78.0% (148)Unmarried:
22.0% (42)
Women who did not give birth in the past 12 months Now married:
48.0% (2,091)Unmarried:
52.0% (2,262)
Marital status - Hispanic or Latino population 15 years and over
Males 37.5% Never married56.9% Now married1.2% Separated1.2% Widowed3.1% DivorcedFemales 21.0% Never married63.7% Now married0.0% Separated2.5% Widowed12.8% DivorcedWomen who gave birth in the past 12 months Now married:
82.5% (49)Unmarried:
17.5% (10)
Women who did not give birth in the past 12 months Now married:
59.2% (695)Unmarried:
40.8% (479)
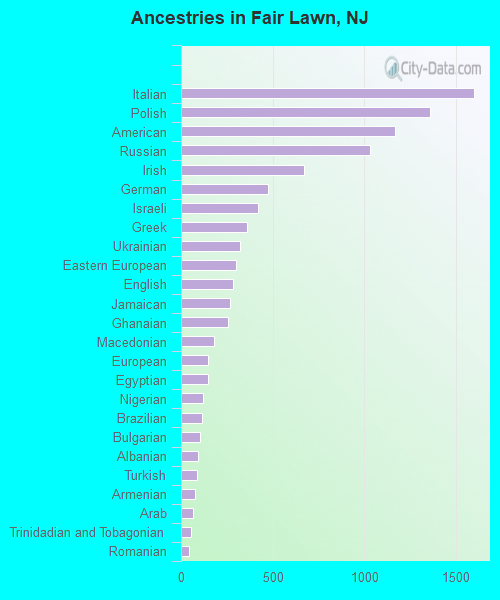
Ancestries in Fair Lawn
1,602 8.8% Italian1,362 7.5% Polish1,167 6.4% American1,034 5.7% Russian670 3.7% Irish476 2.6% German423 2.3% Israeli363 2.0% Greek320 1.8% Ukrainian299 1.6% Eastern European282 1.6% English267 1.5% Jamaican254 1.4% Ghanaian180 1.0% Macedonian149 0.8% European145 0.8% Egyptian118 0.7% Nigerian116 0.6% Brazilian106 0.6% Bulgarian95 0.5% Albanian85 0.5% Turkish78 0.4% Armenian68 0.4% Arab54 0.3% Trinidadian and Tobagonian46 0.3% Romanian45 0.2% Norwegian44 0.2% Portuguese43 0.2% Iranian42 0.2% Scotch-Irish39 0.2% Dutch38 0.2% Hungarian32 0.2% Jordanian32 0.2% Lebanese31 0.2% Lithuanian27 0.1% Kenyan25 0.1% Latvian25 0.1% Canadian24 0.1% Yugoslavian22 0.1% Pennsylvania German17 0.09% British15 0.08% African15 0.08% Scottish12 0.07% Swedish10 0.06% Austrian8 0.04% Moroccan8 0.04% Australian3 0.02% French Canadian
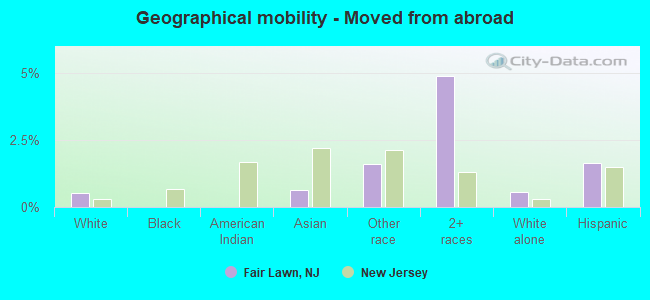
Geographical mobility in Fair Lawn Same house 1 year ago 21,079 93.9% White (Caucasian)1,212 99.4% Black or African American26 96.6% American Indian / Alaska Native3,854 94.4% Asian1,447 97.5% Other race3,440 86.0% Two or more races21,299 93.7% White alone, not Hispanic / Latino4,708 91.7% Hispanic or LatinoMoved within same county 774 3.4% White / Caucasian2 0.2% Black or African American97 2.4% Asian20 1.3% Other race95 2.4% Two or more races785 3.5% White alone, not Hispanic / Latino101 2.0% Hispanic or LatinoMoved within same state 192 0.9% White / Caucasian13 1.1% Black or African American18 0.5% Asian89 2.2% Two or more races220 1.0% White alone, not Hispanic / Latino12 0.2% Hispanic or LatinoMoved from different state 284 1.3% White / Caucasian19 1.6% Black or African American18 0.4% Asian197 4.9% Two or more races286 1.3% White alone, not Hispanic / Latino151 2.9% Hispanic or LatinoMoved from abroad 115 0.5% White25 0.6% Asian24 1.6% Other race195 4.9% Two or more races129 0.6% White alone, not Hispanic / Latino85 1.7% Hispanic or Latino
Children Nativity (place of birth) in Fair Lawn
Children under 6 years - Living with two parents Both parents native 712 100.0% NativeBoth parents foreign-born 478 97.0% Native15 3.0% Foreign-bornOne native, one foreign-born parent 539 100.0% NativeChildren under 6 years - Living with one parent Native parent 174 100.0% NativeForeign-born parent 86 100.0% NativeChildren 6 to 17 years - Living with two parents Both parents native 2,186 97.1% Native65 2.9% Foreign-bornBoth parents foreign-born 1,457 72.9% Native541 27.1% Foreign-bornOne native, one foreign-born parent 951 98.7% Native13 1.3% Foreign-bornChildren 6 to 17 years - Living with one parent Native parent 290 100.0% NativeForeign-born parent 720 51.8% Native670 48.2% Foreign-born
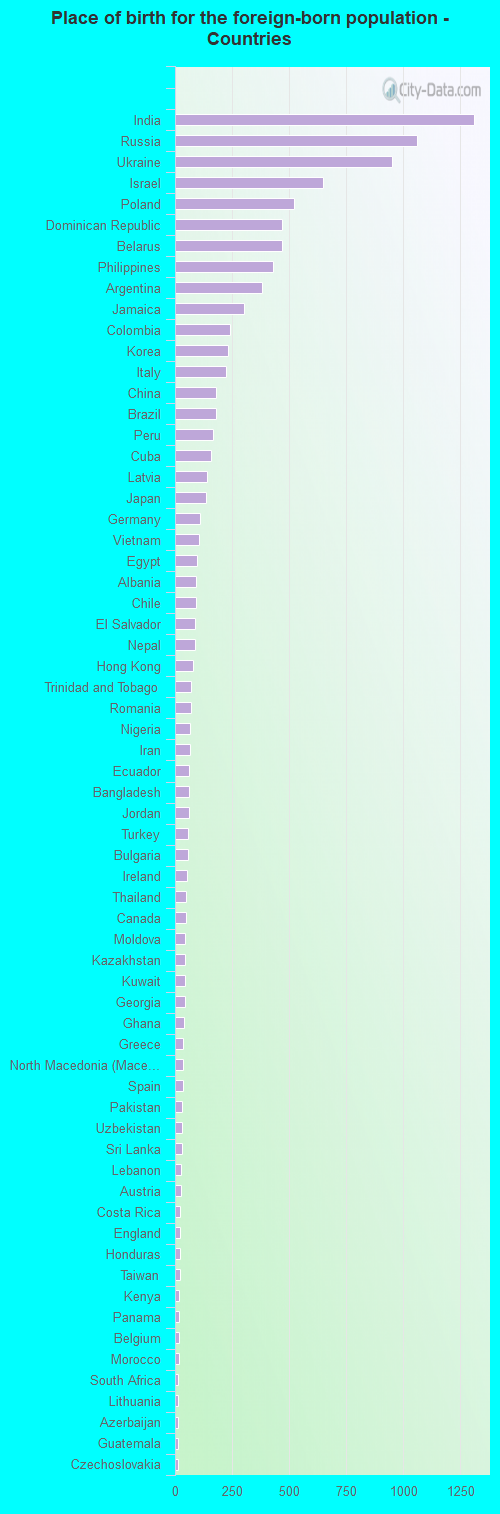
Place of birth for residents in Fair Lawn 4,741 Europe4,204 Eastern Europe3,802 Asia2,354 Americas2,307 Latin America1,676 South Central Asia1,121 South America1,013 Caribbean892 Western Asia647 Eastern Asia585 South Eastern Asia296 Southern Europe280 China272 Africa172 Central America156 Western Europe123 Western Africa114 Northern Africa84 Northern Europe47 Northern America19 Eastern Africa15 Southern Africa8 Oceania8 Australia and New Zealand Subregion1,310 India1,061 Russia949 Ukraine649 Israel522 Poland470 Dominican Republic468 Belarus430 Philippines379 Argentina301 Jamaica239 Colombia231 Korea225 Italy179 China179 Brazil167 Peru158 Cuba141 Latvia135 Japan111 Germany107 Vietnam97 Egypt93 Albania93 Chile87 El Salvador86 Nepal80 Hong Kong72 Trinidad and Tobago69 Romania64 Nigeria64 Iran62 Ecuador60 Bangladesh60 Jordan56 Turkey55 Bulgaria51 Ireland47 Thailand47 Canada45 Moldova44 Kazakhstan44 Kuwait42 Georgia39 Ghana36 Greece34 North Macedonia (Macedonia)33 Spain32 Pakistan32 Uzbekistan29 Sri Lanka26 Lebanon26 Austria23 Costa Rica22 England21 Honduras20 Taiwan19 Kenya18 Panama18 Belgium17 Morocco15 South Africa14 Lithuania13 Azerbaijan13 Guatemala12 Czechoslovakia10 St. Lucia10 Hungary8 Mexico8 Bosnia and Herzegovina8 Scotland8 Australia2 United Kingdom
Grandparents responsible for own grandchildren in Fair Lawn
Grandparents (30 to 59 years) White / Caucasian 29 38.3% Responsible for grandchildren47 61.7% Not responsible for grandchildrenBlack or African American 9 100.0% Not responsible for grandchildrenAsian 8 47.1% Responsible for grandchildren10 52.9% Not responsible for grandchildrenWhite alone, not Hispanic / Latino 33 36.6% Responsible for grandchildren57 63.4% Not responsible for grandchildrenGrandparents (60 years and over) White / Caucasian 99 27.0% Responsible for grandchildren268 73.0% Not responsible for grandchildrenAsian 7 4.1% Responsible for grandchildren165 95.9% Not responsible for grandchildrenWhite alone, not Hispanic / Latino 108 25.8% Responsible for grandchildren311 74.2% Not responsible for grandchildren