Races in Fairfax, California (CA) Detailed Stats
Ancestries, Foreign-born residents, place of birth
Settings
X


Recent posts about races in Fairfax, California on our local forum with over 2,400,000 registered users:
 | 5 CA metros barely have any whites/Europeans(census) (170 replies) |
| Relocation Sonoma Sebastopol vs Marin Fairfax for active early retirement? (4 replies) |
| Looking to buy a House in Central LA, is this a nice area? (4 replies) |
| LA Riot thread (472 replies) |
| Flattening the curve is working! (849 replies) |
| California’s Future: Pan-Enclavism or the Melting Pot? (87 replies) |
Latest news about races in Fairfax, CA collected exclusively by city-data.com from local newspapers, TV, and radio stations
According to 2022 data, the most numerous races in Fairfax, CA are Hispanic (738 residents), White alone (5,809 residents), and Asian alone (354 residents). 88.7% of Fairfax residents speak English at home. 11.9% of Fairfax, CA residents are foreign-born (4.7% born in Europe, 3.6% born in Latin America, 2.7% born in Asia), which is 118.4% less than the foreign-born rate of 26.0% across the entire state of California.
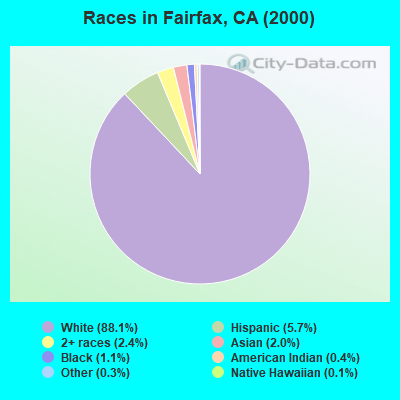
Race distribution in Fairfax
2000
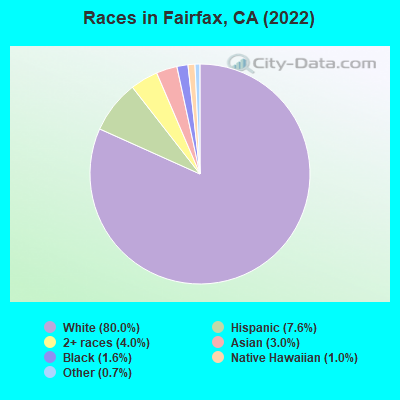
2022

- 6,44588.1%White alone
- 4185.7%Hispanic
- 1752.4%Two or more races
- 1432.0%Asian alone
- 771.1%Black alone
- 300.4%American Indian alone
- 230.3%Other race alone
- 80.1%Native Hawaiian and Other
Pacific Islander alone
-
- 5,80976.1%White alone
- 7389.7%Hispanic
- 3544.6%Asian alone
- 3114.1%Two or more races
- 320.4%Black alone
- 280.4%Native Hawaiian and Other
Pacific Islander alone
2000
2022
-
- 15,816,79046.7%White alone
- 10,966,55632.4%Hispanic
- 3,648,86010.8%Asian alone
- 2,181,9266.4%Black alone
- 903,1152.7%Two or more races
- 178,9840.5%American Indian alone
- 103,7360.3%Native Hawaiian and Other
Pacific Islander alone - 71,6810.2%Other race alone

-
- 15,732,18440.3%Hispanic
- 13,160,42633.7%White alone
- 5,957,86715.3%Asian alone
- 2,025,2185.2%Black alone
- 1,663,2224.3%Two or more races
- 251,6180.6%Other race alone
- 135,7770.3%Native Hawaiian and Other
Pacific Islander alone - 103,0300.3%American Indian alone

Income and house value in Fairfax
- Median household income in 2022
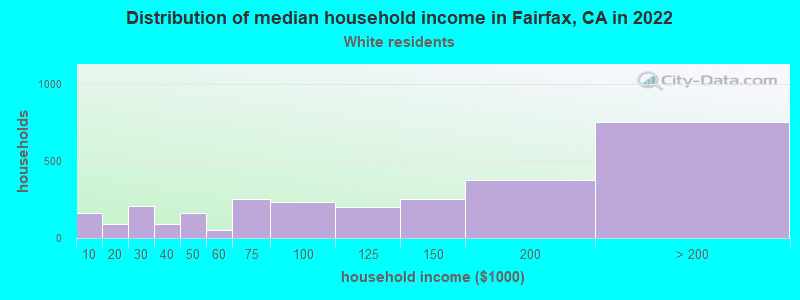
- $124,014White non-Hispanic householders
- $9,527Black householders
- $64,308American Indian and Alaska Native householders
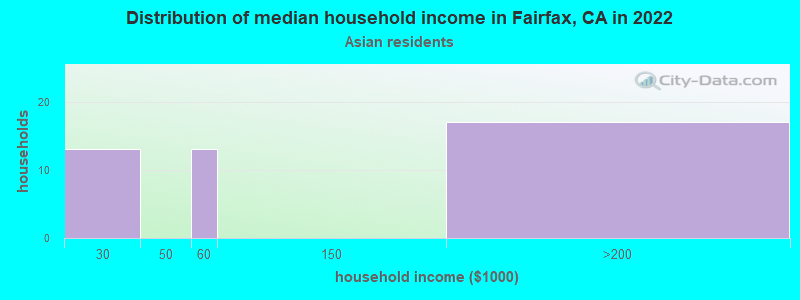
- $87,341Asian householders
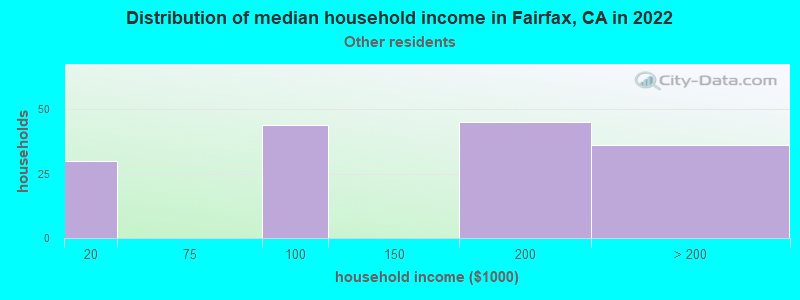
- $65,665Some other race householders
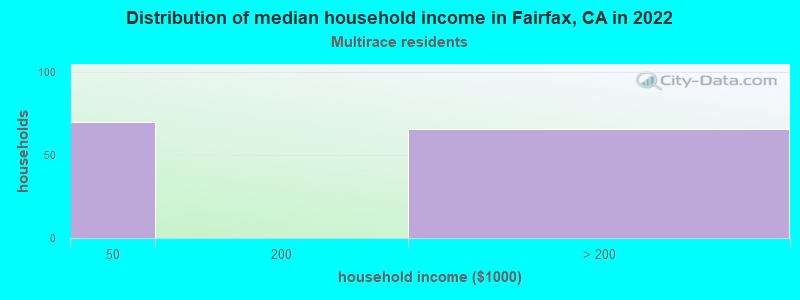
- over $200,000Two or more races householders
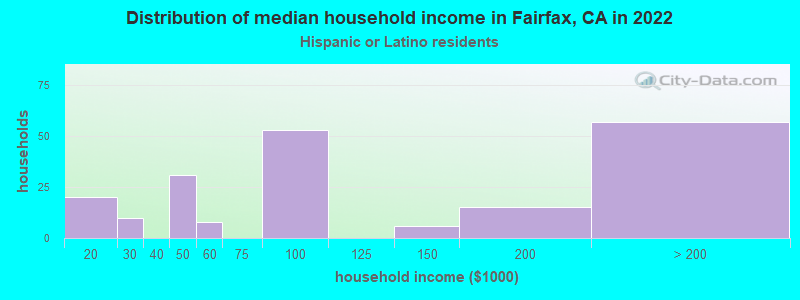
- $94,584Hispanic or Latino race householders
- Median 2022 house value
- over $1,000,000White Non-Hispanic householders
- over $1,000,000Black or African American householders
- over $1,000,000Asian householders
- over $1,000,000Some other race householders
- over $1,000,000Two or more races householders
- over $1,000,000Hispanic or Latino householders
Household income for White non-Hispanic householders
Household income for Asian householders
Household income for Some other race householders
Household income for Two or more races householders
Household income for Hispanic or Latino race householders
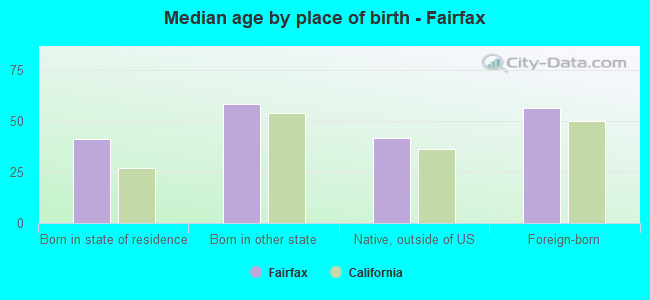
Median age by race in Fairfax
- 52.5Median age for White residents
- 51.8Males
- 52.9Females
- 26.0Median age for Black or African American residents
- 54.4Median age for American Indian / Alaska Native residents
- 56.1Median age for Asian residents
- 55.1Males
- 56.7Females
- 17.9Median age for Native Hawaiian / Pacific Islander residents
- 48.9Median age for Other race residents
- 37.0Median age for Two or more races residents
- 25.8Males
- 20.7Females
- 51.0Median age for White alone residents
- 49.7Males
- 52.0Females
- 44.2Median age for Hispanic or Latino residents
- 49.2Males
- 42.2Females
Owner/renter occupied households by race in Fairfax
- House owners and renters - White residents
- 1,78267.2%Owner occupied
- 86832.8%Renter occupied
- House owners and renters - Black or African American residents
- 26100.0%Owner occupied
- House owners and renters - American Indian / Alaska Native residents
- 20100.0%Renter occupied
- House owners and renters - Asian residents
- 8158.1%Owner occupied
- 5841.9%Renter occupied
- House owners and renters - Native Hawaiian / Pacific Islander residents
- 6100.0%Renter occupied
- House owners and renters - Other race residents
- 2019.2%Owner occupied
- 8580.8%Renter occupied
- House owners and renters - Two or more races residents
- 127100.0%Renter occupied
- House owners and renters - White alone residents
- 1,84966.5%Owner occupied
- 93233.5%Renter occupied
- House owners and renters - Hispanic or Latino residents
- 8228.8%Owner occupied
- 20271.2%Renter occupied
Language usage in Fairfax
- English speakers - Total
- 88.7% of residents of Fairfax speak English at home.
- 5.8% of residents speak Spanish at home
- 23655.3%Speak English very well
- 19144.7%Speak English less than very well
- 5.9% of residents speak other language at home
- 29467.3%Speak English very well
- 14332.7%Speak English less than very well
- English speakers - Born in the United States
- 95.7% of residents of Fairfax speak English at home.
- 0.7% of residents speak Spanish at home
- 743.8%Speak English very well
- 956.3%Speak English less than very well
- 3.3% of residents speak other language at home
- 71100.0%Speak English very well
- English speakers - Native, born elsewhere
- 90.4% of residents of Fairfax speak English at home.
- 8.9% of residents speak other language at home
- 14100.0%Speak English very well
- English speakers - Foreign-born
- 48.6% of residents of Fairfax speak English at home.
- 25.2% of residents speak Spanish at home
- 4520.3%Speak English very well
- 17779.7%Speak English less than very well
- 30.0% of residents speak other language at home
- 12246.2%Speak English very well
- 14253.8%Speak English less than very well
White (Caucasian) - Speak only English
| Native: | 100.0% (5,088) |
| Foreign-born: | 88.8% (316) |
White (Caucasian) - Speak another language
| Native: | 3.2% (161) |
| Foreign-born: | 33.3% (119) |
Asian - Speak only English
| Native: | 84.0% (133) |
| Foreign-born: | 21.2% (46) |
Asian - Speak another language
| Native: | 13.1% (21) |
| Foreign-born: | 79.9% (174) |
White alone - Speak only English
| Native: | 97.0% (5,184) |
| Foreign-born: | 84.2% (337) |
White alone - Speak another language
| Native: | 3.0% (159) |
| Foreign-born: | 19.4% (78) |
Hispanic or Latino - Speak another language
| Native: | 23.6% (101) |
| Foreign-born: | 91.9% (229) |
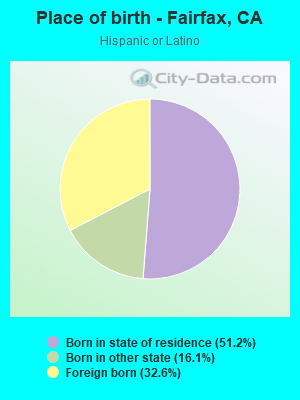
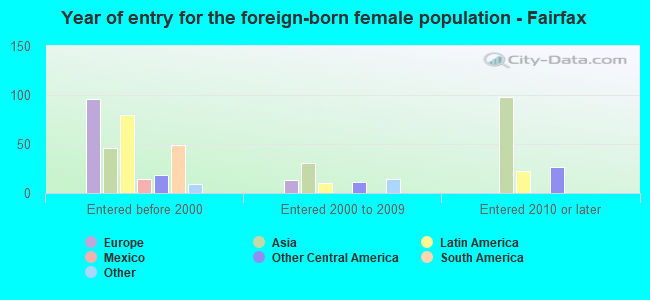
Foreign-born residents in Fairfax
900 residents are foreign born (4.7% Europe, 3.6% Latin America, 2.7% Asia).
| This city: | 11.9% |
| California: | 100.0% |
Marital status for residents in Fairfax
Marital status - White (Caucasian) population 15 years and over
- Males
- 30.7%Never married
- 54.8%Now married
- 0.0%Separated
- 1.5%Widowed
- 12.9%Divorced
- Females
- 23.9%Never married
- 51.4%Now married
- 0.0%Separated
- 6.8%Widowed
- 18.0%Divorced
Women who gave birth in the past 12 months
| Now married: | 100.0% (14) |
| Unmarried: | 0.0% (0) |
Women who did not give birth in the past 12 months
| Now married: | 55.0% (539) |
| Unmarried: | 45.0% (440) |
Marital status - Asian population 15 years and over
- Males
- 0.0%Never married
- 100.0%Now married
- 0.0%Separated
- 0.0%Widowed
- 0.0%Divorced
- Females
- 28.1%Never married
- 57.8%Now married
- 0.0%Separated
- 9.0%Widowed
- 5.1%Divorced
Women who did not give birth in the past 12 months
| Now married: | 25.4% (29) |
| Unmarried: | 74.6% (84) |
Marital status - Native Hawaiian / Pacific Islander population 15 years and over
- Males
- 100.0%Never married
- 0.0%Now married
- 0.0%Separated
- 0.0%Widowed
- 0.0%Divorced
- Females
- 100.0%Never married
- 0.0%Now married
- 0.0%Separated
- 0.0%Widowed
- 0.0%Divorced
Women who did not give birth in the past 12 months
| Now married: | 0.0% (0) |
| Unmarried: | 100.0% (23) |
Marital status - Other race population 15 years and over
- Males
- 38.3%Never married
- 0.0%Now married
- 3.9%Separated
- 0.0%Widowed
- 57.8%Divorced
- Females
- 0.0%Never married
- 100.0%Now married
- 0.0%Separated
- 0.0%Widowed
- 0.0%Divorced
Marital status - Two or more races population 15 years and over
- Males
- 77.8%Never married
- 22.2%Now married
- 0.0%Separated
- 0.0%Widowed
- 0.0%Divorced
- Females
- 84.0%Never married
- 7.7%Now married
- 0.0%Separated
- 0.0%Widowed
- 8.3%Divorced
Women who did not give birth in the past 12 months
| Now married: | 7.7% (33) |
| Unmarried: | 92.3% (394) |
Marital status - White alone, not Hispanic / Latino population 15 years and over
- Males
- 31.3%Never married
- 54.7%Now married
- 0.0%Separated
- 1.7%Widowed
- 12.3%Divorced
- Females
- 24.8%Never married
- 50.6%Now married
- 0.0%Separated
- 6.3%Widowed
- 18.2%Divorced
Women who gave birth in the past 12 months
| Now married: | 100.0% (17) |
| Unmarried: | 0.0% (0) |
Women who did not give birth in the past 12 months
| Now married: | 52.9% (555) |
| Unmarried: | 47.1% (494) |
Marital status - Hispanic or Latino population 15 years and over
- Males
- 27.4%Never married
- 36.8%Now married
- 1.5%Separated
- 0.0%Widowed
- 34.4%Divorced
- Females
- 11.8%Never married
- 60.9%Now married
- 0.0%Separated
- 17.3%Widowed
- 10.0%Divorced
Women who did not give birth in the past 12 months
| Now married: | 72.1% (102) |
| Unmarried: | 27.9% (39) |
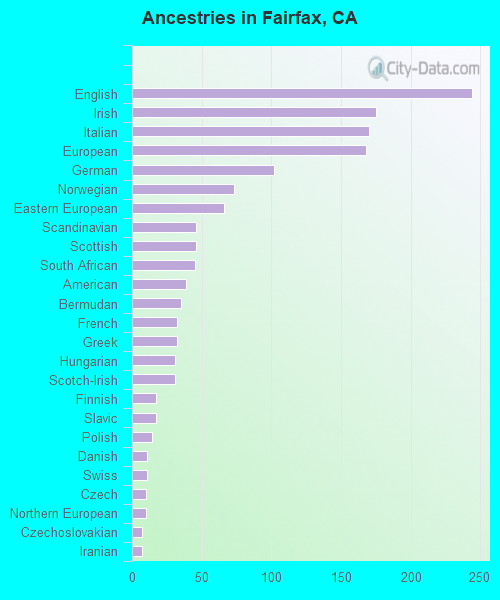
Ancestries in Fairfax

- 34112.5%English
- 2479.0%European
- 2469.0%Italian
- 2408.8%German
- 1836.7%Irish
- 893.3%American
- 702.6%Greek
- 692.5%Scotch-Irish
- 632.3%Norwegian
- 381.4%Eastern European
- 371.4%Northern European
- 301.1%Swedish
- 261.0%Romanian
- 190.7%Armenian
- 190.7%Portuguese
- 170.6%Scandinavian
- 160.6%Moroccan
- 160.6%Canadian
- 160.6%Danish
- 140.5%Finnish
- 140.5%Swiss
- 120.4%Welsh
- 100.4%Polish
- 100.4%Russian
- 80.3%Iranian
- 70.3%Austrian
- 70.3%British
- 70.3%French
- 70.3%Scottish
- 60.2%Bermudan
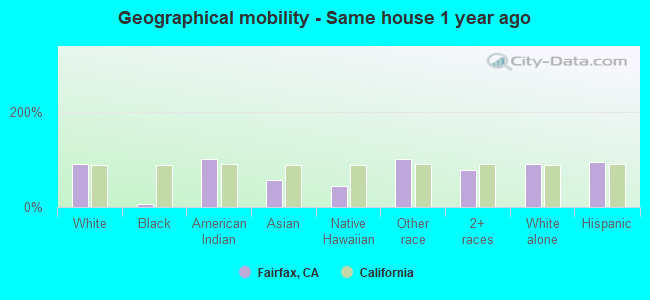
Geographical mobility in Fairfax

- Same house 1 year ago
- 4,87790.0%White (Caucasian)
- 26.0%Black or African American
- 21100.0%American Indian / Alaska Native
- 20357.3%Asian
- 1344.8%Native Hawaiian / Pacific Islander
- 171100.0%Other race
- 74177.4%Two or more races
- 5,36490.8%White alone, not Hispanic / Latino
- 64894.1%Hispanic or Latino
-
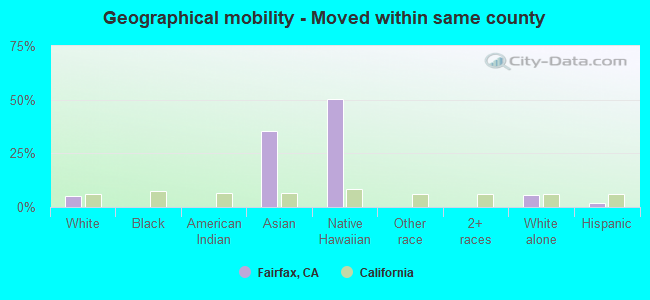
- Moved within same county
- 2895.3%White / Caucasian
- 12635.4%Asian
- 1550.4%Native Hawaiian / Pacific Islander
- 3185.4%White alone, not Hispanic / Latino
- 142.0%Hispanic or Latino
-
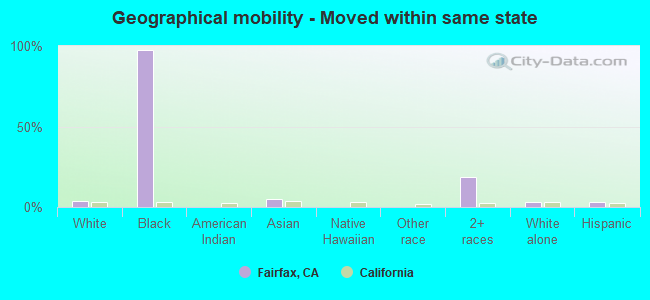
- Moved within same state
- 2033.7%White / Caucasian
- 3297.2%Black or African American
- 174.7%Asian
- 18118.9%Two or more races
- 1863.1%White alone, not Hispanic / Latino
- 213.1%Hispanic or Latino
-
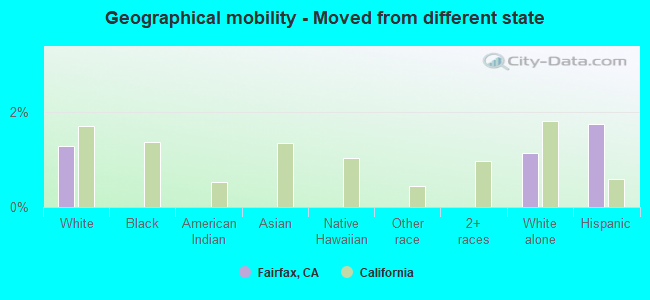
- Moved from different state
- 701.3%White / Caucasian
- 671.1%White alone, not Hispanic / Latino
- 121.7%Hispanic or Latino
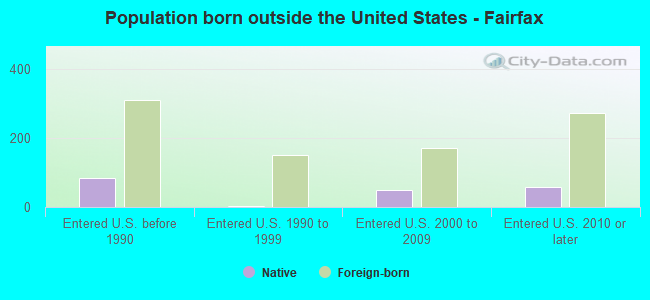
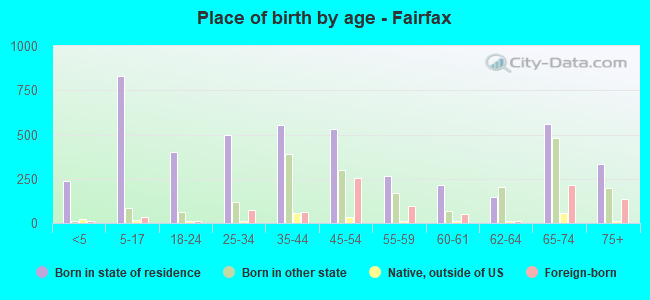
Children Nativity (place of birth) in Fairfax
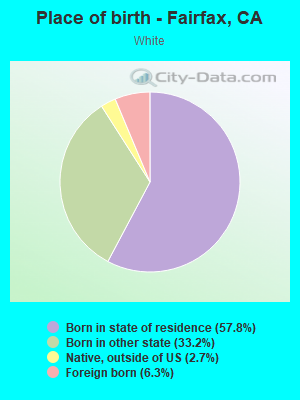
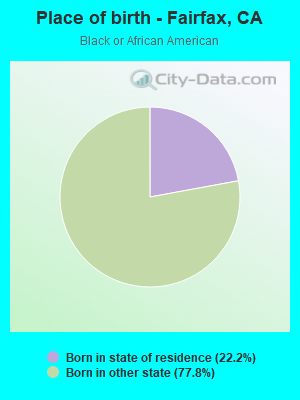
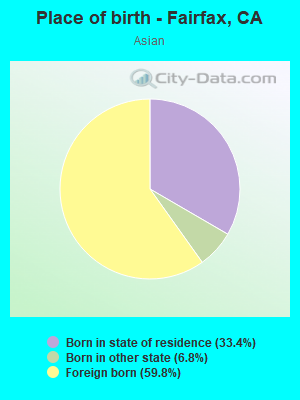
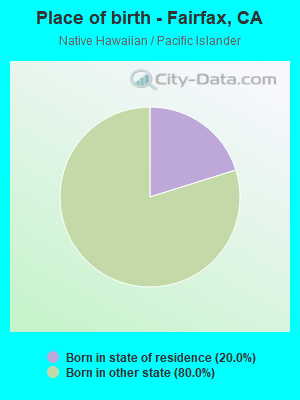
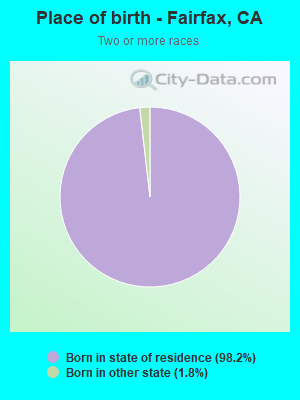
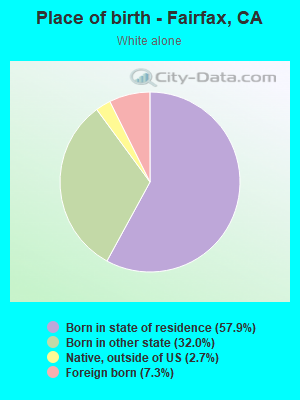
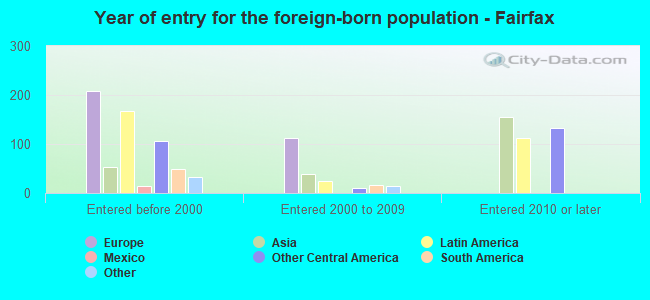
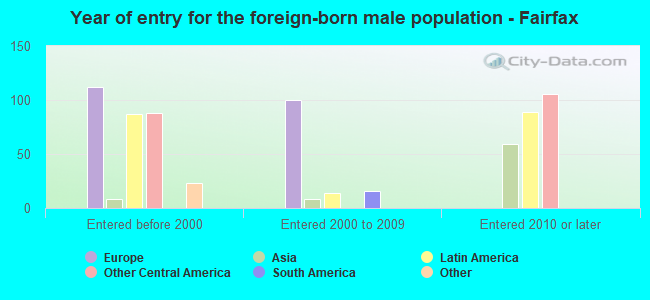
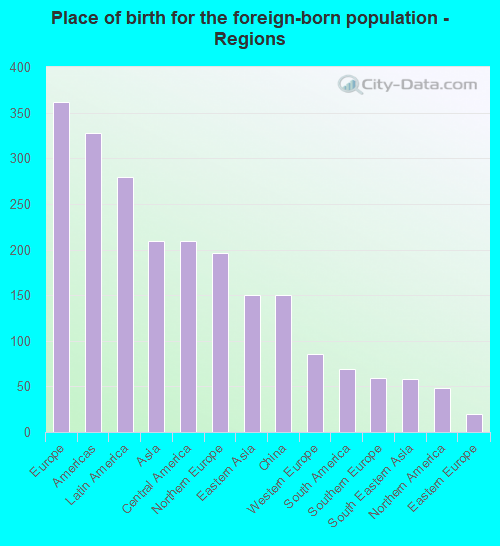
Place of birth for residents in Fairfax
![Place of birth for the foreign-born population - Regions]()
- 362Europe
- 328Americas
- 279Latin America
- 209Asia
- 209Central America
- 196Northern Europe
- 150Eastern Asia
- 150China
- 86Western Europe
- 69South America
- 59Southern Europe
- 58South Eastern Asia
- 48Northern America
- 20Eastern Europe
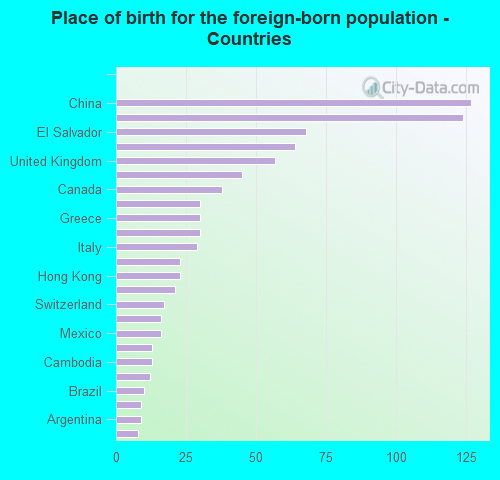
![Place of birth for the foreign-born population - Countries]()
- 127China
- 124Guatemala
- 68El Salvador
- 64England
- 57United Kingdom
- 45Germany
- 38Canada
- 30Sweden
- 30Greece
- 30Peru
- 29Italy
- 23France
- 23Hong Kong
- 21Vietnam
- 17Switzerland
- 16Philippines
- 16Mexico
- 13Norway
- 13Cambodia
- 12Denmark
- 10Brazil
- 9Belarus
- 9Argentina
- 8Singapore
- 1Russia