Races in Fairview Heights, Illinois (IL) Detailed Stats
Data:
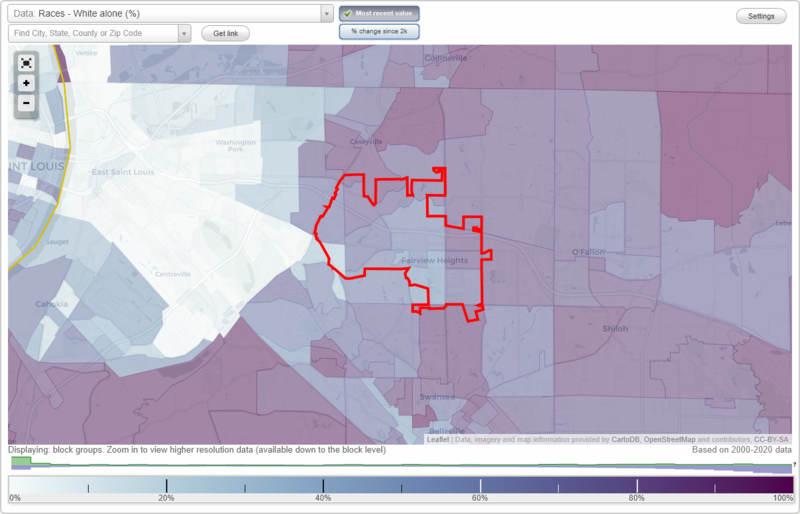
Races - White alone (%)
Races - White alone (% change since 2000)
Races - Black alone (%)
Races - Black alone (% change since 2000)
Races - American Indian alone (%)
Races - American Indian alone (% change since 2000)
Races - Asian alone (%)
Races - Asian alone (% change since 2000)
Races - Hispanic (%)
Races - Hispanic (% change since 2000)
Races - Native Hawaiian and Other Pacific Islander alone (%)
Races - Native Hawaiian and Other Pacific Islander alone (% change since 2000)
Races - Two or more races(%)
Races - Two or more races(% change since 2000)
Races - Other race alone (%)
Races - Other race alone (% change since 2000)
Racial diversity
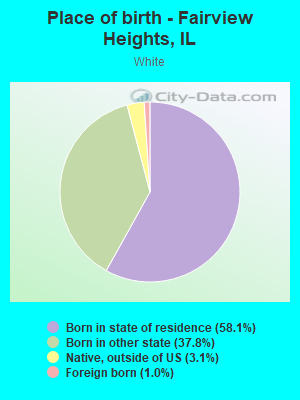
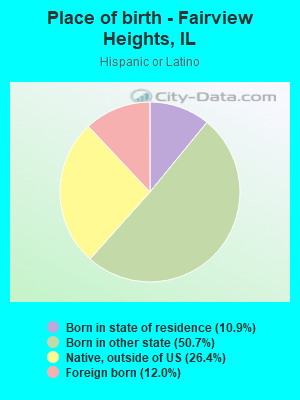
Place of birth - Born in state of residence (%)
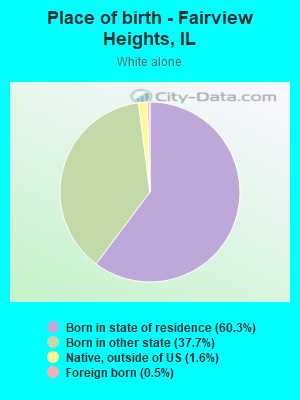
Place of birth - Born in state of residence (%) - White
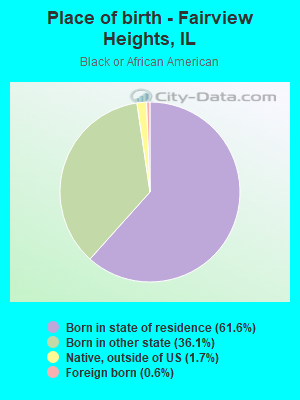
Place of birth - Born in state of residence (%) - Black or African American
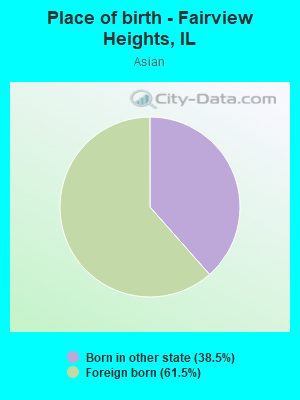
Place of birth - Born in state of residence (%) - Asian
Place of birth - Born in state of residence (%) - Hispanic or Latino
Place of birth - Born in state of residence (%) - American Indian and Alaska Native
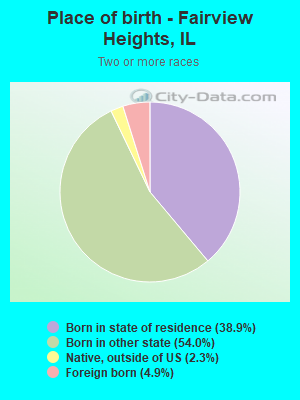
Place of birth - Born in state of residence (%) - Multirace
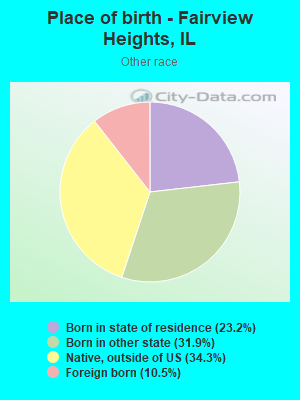
Place of birth - Born in state of residence (%) - Other Race
Place of birth - Born in other state (%)
Place of birth - Born in other state (%) - White
Place of birth - Born in other state (%) - Black or African American
Place of birth - Born in other state (%) - Asian
Place of birth - Born in other state (%) - Hispanic or Latino
Place of birth - Born in other state (%) - American Indian and Alaska Native
Place of birth - Born in other state (%) - Multirace
Place of birth - Born in other state (%) - Other Race
Place of birth - Native, outside of US (%)
Place of birth - Native, outside of US (%) - White
Place of birth - Native, outside of US (%) - Black or African American
Place of birth - Native, outside of US (%) - Asian
Place of birth - Native, outside of US (%) - Hispanic or Latino
Place of birth - Native, outside of US (%) - American Indian and Alaska Native
Place of birth - Native, outside of US (%) - Multirace
Place of birth - Native, outside of US (%) - Other Race
Place of birth - Foreign born (%)
Place of birth - Foreign born (%) - White
Place of birth - Foreign born (%) - Black or African American
Place of birth - Foreign born (%) - Asian
Place of birth - Foreign born (%) - Hispanic or Latino
Place of birth - Foreign born (%) - American Indian and Alaska Native
Place of birth - Foreign born (%) - Multirace
Place of birth - Foreign born (%) - Other Race
Residents speaking English at home (%)
Residents speaking English at home - Born in the United States (%)
Residents speaking English at home - Native, born elsewhere (%)
Residents speaking English at home - Foreign born (%)
Residents speaking Spanish at home (%)
Residents speaking Spanish at home - Born in the United States (%)
Residents speaking Spanish at home - Native, born elsewhere (%)
Residents speaking Spanish at home - Foreign born (%)
Residents speaking other language at home (%)
Residents speaking other language at home - Born in the United States (%)
Residents speaking other language at home - Native, born elsewhere (%)
Residents speaking other language at home - Foreign born (%)
Marital status - Never married (%)
Marital status - Now married (%)
Marital status - Separated (%)
Marital status - Widowed (%)
Marital status - Divorced (%)
Ancestries Reported - Arab (%)
Ancestries Reported - Czech (%)
Ancestries Reported - Danish (%)
Ancestries Reported - Dutch (%)
Ancestries Reported - English (%)
Ancestries Reported - French (%)
Ancestries Reported - French Canadian (%)
Ancestries Reported - German (%)
Ancestries Reported - Greek (%)
Ancestries Reported - Hungarian (%)
Ancestries Reported - Irish (%)
Ancestries Reported - Italian (%)
Ancestries Reported - Lithuanian (%)
Ancestries Reported - Norwegian (%)
Ancestries Reported - Polish (%)
Ancestries Reported - Portuguese (%)
Ancestries Reported - Russian (%)
Ancestries Reported - Scotch-Irish (%)
Ancestries Reported - Scottish (%)
Ancestries Reported - Slovak (%)
Ancestries Reported - Subsaharan African (%)
Ancestries Reported - Swedish (%)
Ancestries Reported - Swiss (%)
Ancestries Reported - Ukrainian (%)
Ancestries Reported - United States (%)
Ancestries Reported - Welsh (%)
Ancestries Reported - West Indian (%)
Ancestries Reported - Other (%)
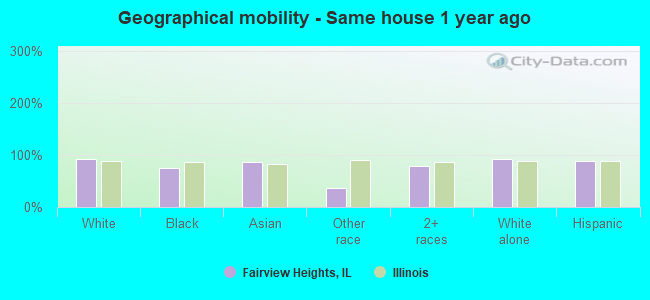
Geographical mobility - Same house 1 year ago (%)
Geographical mobility - Same house 1 year ago (%) - White
Geographical mobility - Same house 1 year ago (%) - Black or African American
Geographical mobility - Same house 1 year ago (%) - Asian
Geographical mobility - Same house 1 year ago (%) - Hispanic or Latino
Geographical mobility - Same house 1 year ago (%) - American Indian and Alaska Native
Geographical mobility - Same house 1 year ago (%) - Multirace
Geographical mobility - Same house 1 year ago (%) - Other Race
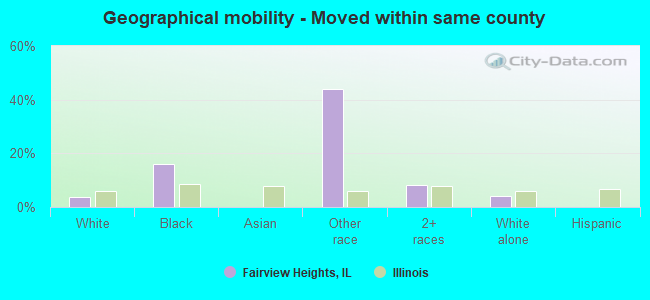
Geographical mobility - Moved within same county (%)
Geographical mobility - Moved within same county (%) - White
Geographical mobility - Moved within same county (%) - Black or African American
Geographical mobility - Moved within same county (%) - Asian
Geographical mobility - Moved within same county (%) - Hispanic or Latino
Geographical mobility - Moved within same county (%) - American Indian and Alaska Native
Geographical mobility - Moved within same county (%) - Multirace
Geographical mobility - Moved within same county (%) - Other Race
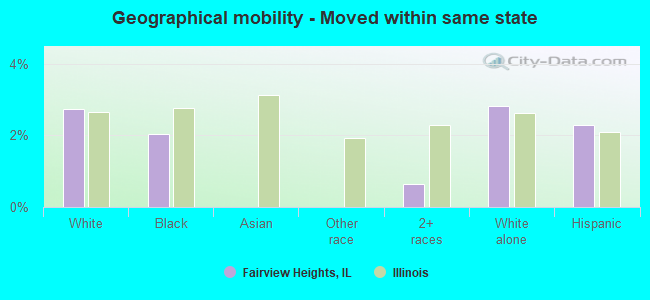
Geographical mobility - Moved from different county within same state (%)
Geographical mobility - Moved from different county within same state (%) - White
Geographical mobility - Moved from different county within same state (%) - Black or African American
Geographical mobility - Moved from different county within same state (%) - Asian
Geographical mobility - Moved from different county within same state (%) - Hispanic or Latino
Geographical mobility - Moved from different county within same state (%) - American Indian and Alaska Native
Geographical mobility - Moved from different county within same state (%) - Multirace
Geographical mobility - Moved from different county within same state (%) - Other Race
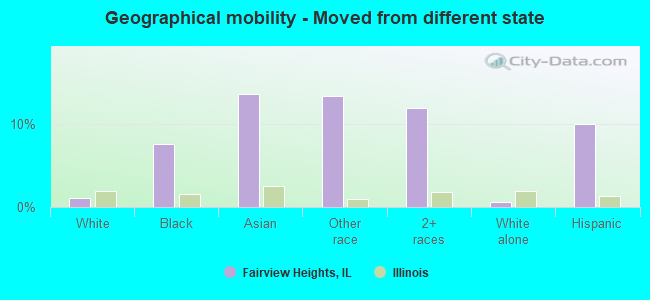
Geographical mobility - Moved from different state (%)
Geographical mobility - Moved from different state (%) - White
Geographical mobility - Moved from different state (%) - Black or African American
Geographical mobility - Moved from different state (%) - Asian
Geographical mobility - Moved from different state (%) - Hispanic or Latino
Geographical mobility - Moved from different state (%) - American Indian and Alaska Native
Geographical mobility - Moved from different state (%) - Multirace
Geographical mobility - Moved from different state (%) - Other Race
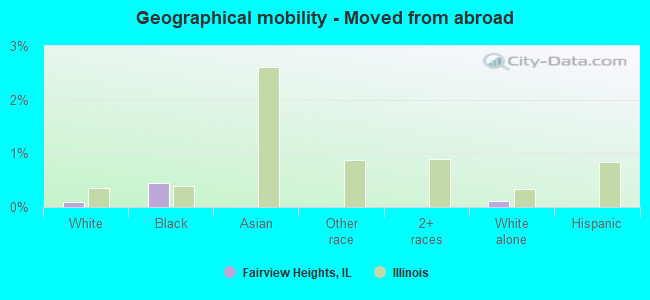
Geographical mobility - Moved from abroad (%)
Geographical mobility - Moved from abroad (%) - White
Geographical mobility - Moved from abroad (%) - Black or African American
Geographical mobility - Moved from abroad (%) - Asian
Geographical mobility - Moved from abroad (%) - Hispanic or Latino
Geographical mobility - Moved from abroad (%) - American Indian and Alaska Native
Geographical mobility - Moved from abroad (%) - Multirace
Geographical mobility - Moved from abroad (%) - Other Race
Place of birth for the foreign-born population - Ireland (%)
Place of birth for the foreign-born population - Denmark (%)
Place of birth for the foreign-born population - Norway (%)
Place of birth for the foreign-born population - Sweden (%)
Place of birth for the foreign-born population - United Kingdom (%)
Place of birth for the foreign-born population - England (%)
Place of birth for the foreign-born population - Scotland (%)
Place of birth for the foreign-born population - Other Northern Europe (%)
Place of birth for the foreign-born population - Austria (%)
Place of birth for the foreign-born population - Belgium (%)
Place of birth for the foreign-born population - France (%)
Place of birth for the foreign-born population - Germany (%)
Place of birth for the foreign-born population - Netherlands (%)
Place of birth for the foreign-born population - Switzerland (%)
Place of birth for the foreign-born population - Other Western Europe (%)
Place of birth for the foreign-born population - Greece (%)
Place of birth for the foreign-born population - Italy (%)
Place of birth for the foreign-born population - Portugal (%)
Place of birth for the foreign-born population - Spain (%)
Place of birth for the foreign-born population - Other Southern Europe (%)
Place of birth for the foreign-born population - Albania (%)
Place of birth for the foreign-born population - Belarus (%)
Place of birth for the foreign-born population - Bosnia and Herzegovina (%)
Place of birth for the foreign-born population - Bulgaria (%)
Place of birth for the foreign-born population - Croatia (%)
Place of birth for the foreign-born population - Czechoslovakia (%)
Place of birth for the foreign-born population - Hungary (%)
Place of birth for the foreign-born population - Latvia (%)
Place of birth for the foreign-born population - Lithuania (%)
Place of birth for the foreign-born population - North Macedonia (Macedonia) (%)
Place of birth for the foreign-born population - Moldova (%)
Place of birth for the foreign-born population - Poland (%)
Place of birth for the foreign-born population - Romania (%)
Place of birth for the foreign-born population - Russia (%)
Place of birth for the foreign-born population - Serbia (%)
Place of birth for the foreign-born population - Ukraine (%)
Place of birth for the foreign-born population - Other Eastern Europe (%)
Place of birth for the foreign-born population - China (%)
Place of birth for the foreign-born population - Hong Kong (%)
Place of birth for the foreign-born population - Taiwan (%)
Place of birth for the foreign-born population - Japan (%)
Place of birth for the foreign-born population - Korea (%)
Place of birth for the foreign-born population - Other Eastern Asia (%)
Place of birth for the foreign-born population - Afghanistan (%)
Place of birth for the foreign-born population - Bangladesh (%)
Place of birth for the foreign-born population - India (%)
Place of birth for the foreign-born population - Iran (%)
Place of birth for the foreign-born population - Kazakhstan (%)
Place of birth for the foreign-born population - Nepal (%)
Place of birth for the foreign-born population - Pakistan (%)
Place of birth for the foreign-born population - Sri Lanka (%)
Place of birth for the foreign-born population - Uzbekistan (%)
Place of birth for the foreign-born population - Other South Central Asia (%)
Place of birth for the foreign-born population - Burma (%)
Place of birth for the foreign-born population - Cambodia (%)
Place of birth for the foreign-born population - Indonesia (%)
Place of birth for the foreign-born population - Laos (%)
Place of birth for the foreign-born population - Malaysia (%)
Place of birth for the foreign-born population - Philippines (%)
Place of birth for the foreign-born population - Singapore (%)
Place of birth for the foreign-born population - Thailand (%)
Place of birth for the foreign-born population - Vietnam (%)
Place of birth for the foreign-born population - Other South Eastern Asia (%)
Place of birth for the foreign-born population - Armenia (%)
Place of birth for the foreign-born population - Iraq (%)
Place of birth for the foreign-born population - Israel (%)
Place of birth for the foreign-born population - Jordan (%)
Place of birth for the foreign-born population - Kuwait (%)
Place of birth for the foreign-born population - Lebanon (%)
Place of birth for the foreign-born population - Saudi Arabia (%)
Place of birth for the foreign-born population - Syria (%)
Place of birth for the foreign-born population - Turkey (%)
Place of birth for the foreign-born population - Yemen (%)
Place of birth for the foreign-born population - Other Western Asia (%)
Place of birth for the foreign-born population - Eritrea (%)
Place of birth for the foreign-born population - Ethiopia (%)
Place of birth for the foreign-born population - Kenya (%)
Place of birth for the foreign-born population - Somalia (%)
Place of birth for the foreign-born population - Uganda (%)
Place of birth for the foreign-born population - Zimbabwe (%)
Place of birth for the foreign-born population - Other Eastern Africa (%)
Place of birth for the foreign-born population - Cameroon (%)
Place of birth for the foreign-born population - Congo (%)
Place of birth for the foreign-born population - Democratic Republic of Congo (Zaire) (%)
Place of birth for the foreign-born population - Other Middle Africa (%)
Place of birth for the foreign-born population - Egypt (%)
Place of birth for the foreign-born population - Morocco (%)
Place of birth for the foreign-born population - Sudan (%)
Place of birth for the foreign-born population - Other Northern Africa (%)
Place of birth for the foreign-born population - South Africa (%)
Place of birth for the foreign-born population - Other Southern Africa (%)
Place of birth for the foreign-born population - Cabo Verde (%)
Place of birth for the foreign-born population - Ghana (%)
Place of birth for the foreign-born population - Liberia (%)
Place of birth for the foreign-born population - Nigeria (%)
Place of birth for the foreign-born population - Senegal (%)
Place of birth for the foreign-born population - Sierra Leone (%)
Place of birth for the foreign-born population - Other Western Africa (%)
Place of birth for the foreign-born population - Australia (%)
Place of birth for the foreign-born population - New Zealand (%)
Place of birth for the foreign-born population - Fiji (%)
Place of birth for the foreign-born population - Micronesia (%)
Place of birth for the foreign-born population - Bahamas (%)
Place of birth for the foreign-born population - Barbados (%)
Place of birth for the foreign-born population - Cuba (%)
Place of birth for the foreign-born population - Dominica (%)
Place of birth for the foreign-born population - Dominican Republic (%)
Place of birth for the foreign-born population - Grenada (%)
Place of birth for the foreign-born population - Haiti (%)
Place of birth for the foreign-born population - Jamaica (%)
Place of birth for the foreign-born population - St. Vincent and the Grenadines (%)
Place of birth for the foreign-born population - Trinidad and Tobago (%)
Place of birth for the foreign-born population - West Indies (%)
Place of birth for the foreign-born population - Other Caribbean (%)
Place of birth for the foreign-born population - Belize (%)
Place of birth for the foreign-born population - Costa Rica (%)
Place of birth for the foreign-born population - El Salvador (%)
Place of birth for the foreign-born population - Guatemala (%)
Place of birth for the foreign-born population - Honduras (%)
Place of birth for the foreign-born population - Mexico (%)
Place of birth for the foreign-born population - Nicaragua (%)
Place of birth for the foreign-born population - Panama (%)
Place of birth for the foreign-born population - Other Central America (%)
Place of birth for the foreign-born population - Argentina (%)
Place of birth for the foreign-born population - Bolivia (%)
Place of birth for the foreign-born population - Brazil (%)
Place of birth for the foreign-born population - Chile (%)
Place of birth for the foreign-born population - Colombia (%)
Place of birth for the foreign-born population - Ecuador (%)
Place of birth for the foreign-born population - Guyana (%)
Place of birth for the foreign-born population - Peru (%)
Place of birth for the foreign-born population - Uruguay (%)
Place of birth for the foreign-born population - Venezuela (%)
Place of birth for the foreign-born population - Other South America (%)
Place of birth for the foreign-born population - Canada (%)
Place of birth for the foreign-born population - Other Northern America (%)
Place of birth for the foreign-born population - Other (%)
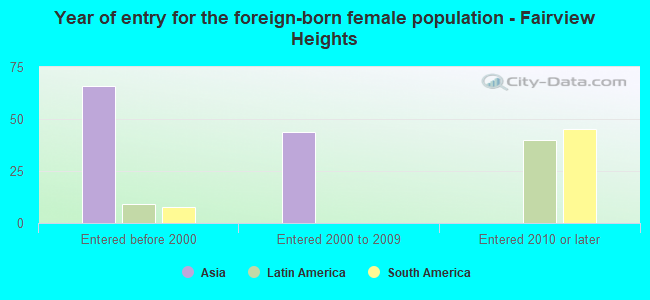
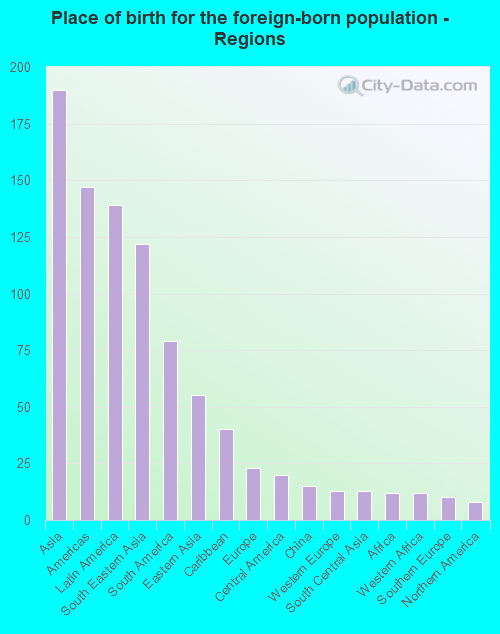
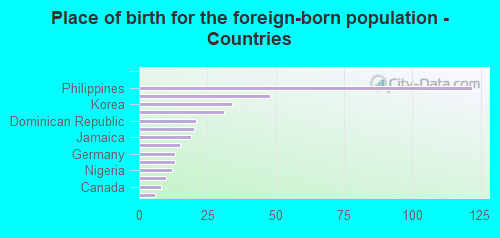
According to 2022 data, the most numerous races in Fairview Heights, IL are White alone (8,452 residents), Hispanic (589 residents), and Black alone (4,749 residents). 96.8% of Fairview Heights residents speak English at home. 2.3% of Fairview Heights, IL residents are foreign-born (1.2% born in Asia, 0.8% born in Latin America), which is 504.2% less than the foreign-born rate of 14.0% across the entire state of Illinois.
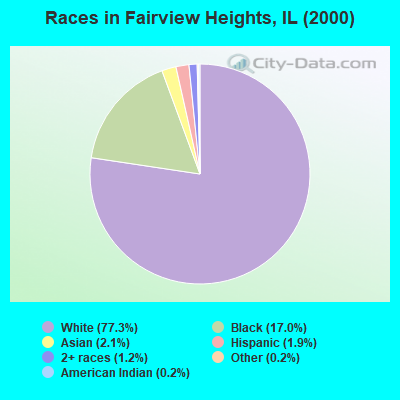
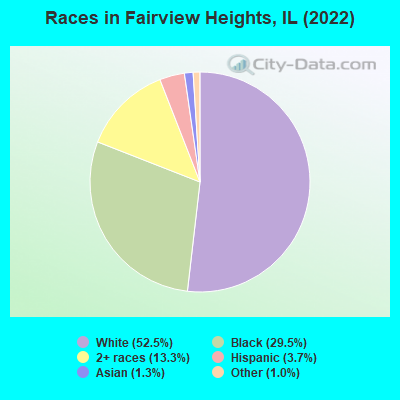
Race distribution in Fairview Heights
2000 2022
8,424,140 67.8% White alone 1,856,152 14.9% Black alone 1,530,262 12.3% Hispanic 419,916 3.4% Asian alone 153,996 1.2% Two or more races 13,479 0.1% Other race alone 18,232 0.1% American Indian alone 3,116 0.03% Native Hawaiian and Other
7,356,301 58.5% White alone 2,299,726 18.3% Hispanic 1,660,423 13.2% Black alone 747,296 5.9% Asian alone 458,599 3.6% Two or more races 45,386 0.4% Other race alone 10,405 0.08% American Indian alone 3,896 0.03% Native Hawaiian and Other
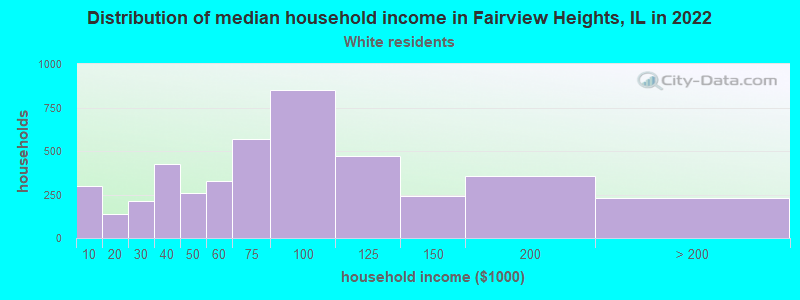
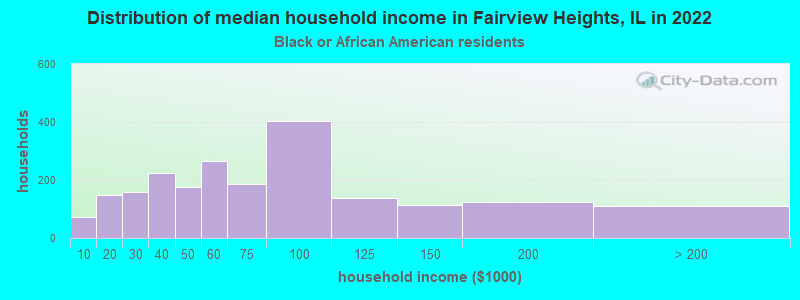
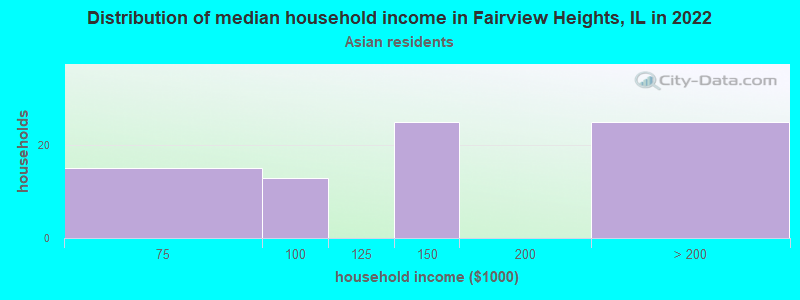
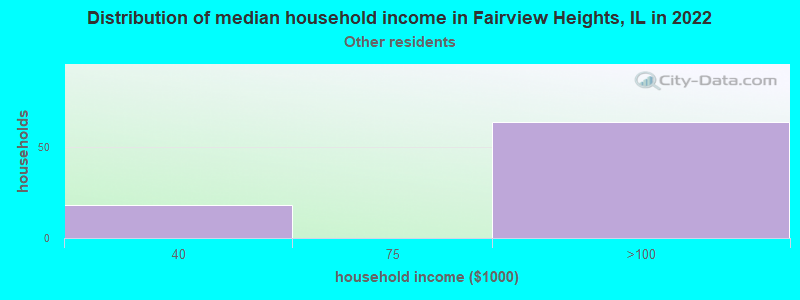
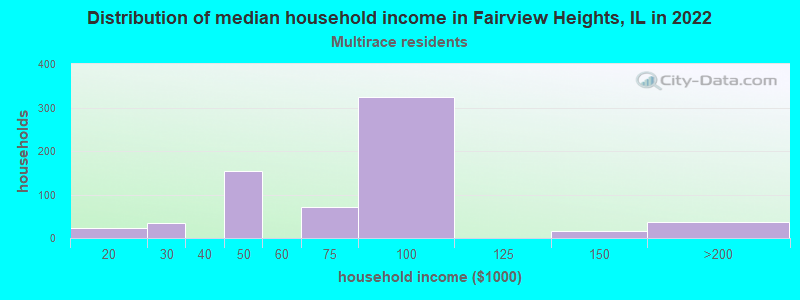
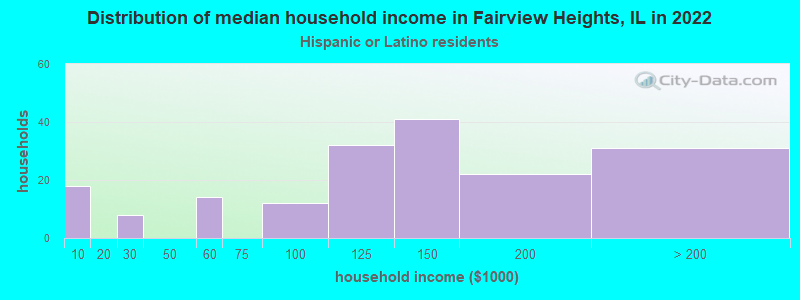
Income and house value in Fairview Heights Median household income in 2022 $72,389 White non-Hispanic householders$69,366 Black householders$123,319 Asian householders$81,477 Two or more races householders$135,130 Hispanic or Latino race householdersMedian 2022 house value $170,518 White Non-Hispanic householders$180,908 Black or African American householders $537,631 Asian householders$120,809 Two or more races householders$258,935 Hispanic or Latino householders
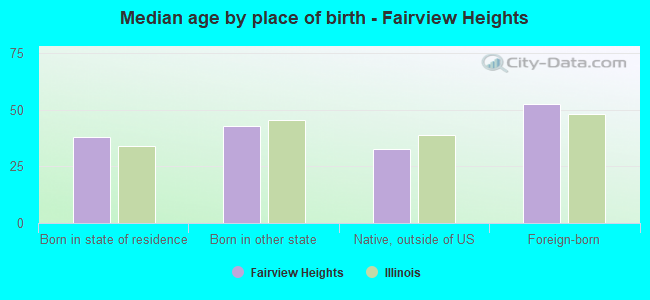
Median age by race in Fairview Heights
48.9 Median age for White residents46.8 50.4 33.8 Median age for Black or African American residents32.5 37.7 -923,913,042.6 Median age for American Indian / Alaska Native residents-852,320,674.3 -688,956,432.9 48.0 Median age for Asian residents54.7 43.3 -593,236,714.4 Median age for Native Hawaiian / Pacific Islander residents-666,666,666.0 -576,015,108.0 36.0 Median age for Other race residents42.4 20.4 23.4 Median age for Two or more races residents21.2 24.0 50.4 Median age for White alone residents48.8 51.0 25.6 Median age for Hispanic or Latino residents29.5 40.3
Owner/renter occupied households by race in Fairview Heights
House owners and renters - White residents 3,262 74.3% Owner occupied1,127 25.7% Renter occupiedHouse owners and renters - Black or African American residents 1,084 54.4% Owner occupied908 45.6% Renter occupiedHouse owners and renters - Asian residents 38 30.3% Owner occupied87 69.7% Renter occupiedHouse owners and renters - Other race residents 76 100.0% Renter occupiedHouse owners and renters - Two or more races residents 221 34.2% Owner occupied426 65.8% Renter occupiedHouse owners and renters - White alone residents 3,170 73.6% Owner occupied1,134 26.4% Renter occupiedHouse owners and renters - Hispanic or Latino residents 115 79.7% Owner occupied29 20.3% Renter occupied
Language usage in Fairview Heights
English speakers - Total 96.8% of residents of Fairview Heights speak English at home.
1.8% of residents speak Spanish at home 159 57.8% Speak English very well116 42.2% Speak English less than very well1.2% of residents speak other language at home 127 67.9% Speak English very well60 32.1% Speak English less than very well
English speakers - Born in the United States 97.9% of residents of Fairview Heights speak English at home.
0.8% of residents speak Spanish at home 51 100.0% Speak English very well0.2% of residents speak other language at home 12 100.0% Speak English very well
English speakers - Native, born elsewhere 75.9% of residents of Fairview Heights speak English at home.
16.9% of residents speak Spanish at home 40 51.3% Speak English very well38 48.7% Speak English less than very well14.1% of residents speak other language at home 14 21.5% Speak English very well51 78.5% Speak English less than very well
English speakers - Foreign-born 38.4% of residents of Fairview Heights speak English at home.
16.2% of residents speak Spanish at home 37 64.9% Speak English very well20 35.1% Speak English less than very well36.1% of residents speak other language at home 110 86.6% Speak English very well17 13.4% Speak English less than very well
White (Caucasian) - Speak only English Native:
98.5% (8,217)Foreign-born:
87.6% (78)
White (Caucasian) - Speak another language Native:
1.5% (125)Foreign-born:
23.2% (21)
Black or African American - Speak only English Native:
98.4% (4,424)Foreign-born:
68.4% (19)
Black or African American - Speak another language Native:
1.6% (74)Foreign-born:
36.8% (10)
Asian - Speak only English Native:
86.5% (66)Foreign-born:
67.3% (97)
Two or more races - Speak another language Native:
1.0% (22)Foreign-born:
100.0% (124)
White alone - Speak only English Native:
99.1% (8,041)Foreign-born:
100.0% (39)
Hispanic or Latino - Speak only English Native:
74.1% (381)Foreign-born:
50.4% (39)
Hispanic or Latino - Speak another language Native:
25.7% (132)Foreign-born:
67.7% (52)
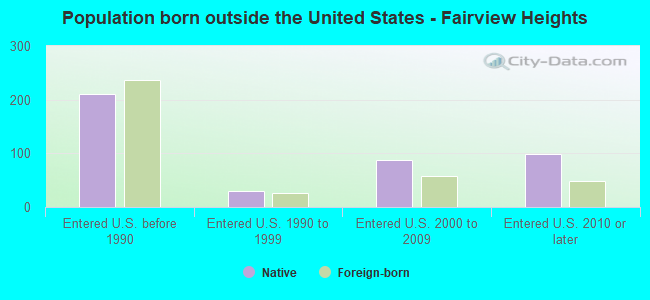
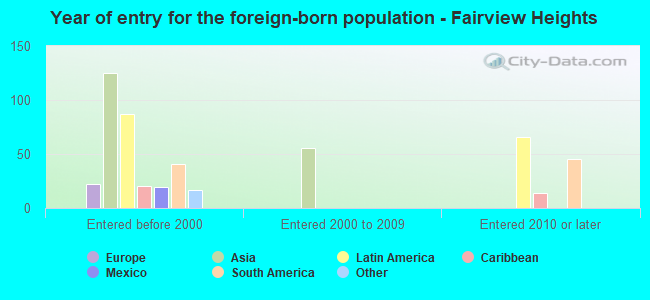
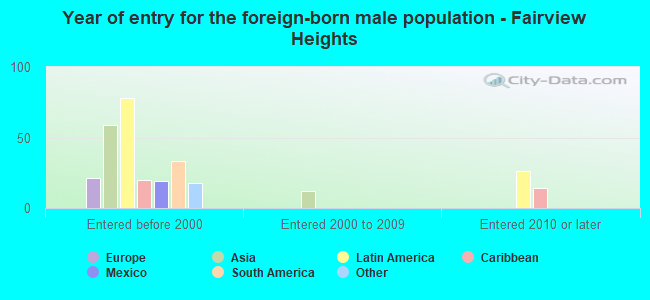
Foreign-born residents in Fairview Heights 373 residents are foreign born (1.2% Asia , 0.8% Latin America ).
This city:
2.3%Illinois:
14.1%
Marital status for residents in Fairview Heights Marital status - White (Caucasian) population 15 years and over
Males 32.6% Never married51.7% Now married1.1% Separated2.1% Widowed12.6% DivorcedFemales 25.6% Never married53.8% Now married0.9% Separated9.5% Widowed10.1% DivorcedWomen who gave birth in the past 12 months Now married:
84.5% (56)Unmarried:
15.5% (10)
Women who did not give birth in the past 12 months Now married:
39.0% (597)Unmarried:
61.0% (935)
Marital status - Black or African American population 15 years and over
Males 47.4% Never married30.3% Now married16.0% Separated1.4% Widowed4.9% DivorcedFemales 56.2% Never married25.4% Now married4.3% Separated2.4% Widowed11.6% DivorcedWomen who gave birth in the past 12 months Now married:
44.7% (48)Unmarried:
55.3% (60)
Women who did not give birth in the past 12 months Now married:
16.4% (215)Unmarried:
83.6% (1,094)
Marital status - Asian population 15 years and over
Males 31.5% Never married34.8% Now married0.0% Separated0.0% Widowed33.7% DivorcedFemales 0.0% Never married80.5% Now married0.0% Separated19.5% Widowed0.0% DivorcedWomen who gave birth in the past 12 months Now married:
100.0% (24)Unmarried:
0.0% (0)
Women who did not give birth in the past 12 months Now married:
100.0% (44)Unmarried:
0.0% (0)
Marital status - Other race population 15 years and over
Males 86.1% Never married13.9% Now married0.0% Separated0.0% Widowed0.0% DivorcedFemales 48.4% Never married51.6% Now married0.0% Separated0.0% Widowed0.0% DivorcedWomen who did not give birth in the past 12 months Now married:
51.6% (19)Unmarried:
48.4% (17)
Marital status - Two or more races population 15 years and over
Males 54.1% Never married34.8% Now married6.8% Separated0.0% Widowed4.3% DivorcedFemales 45.9% Never married30.5% Now married15.7% Separated3.2% Widowed4.7% DivorcedWomen who gave birth in the past 12 months Now married:
100.0% (60)Unmarried:
0.0% (0)
Women who did not give birth in the past 12 months Now married:
32.9% (196)Unmarried:
67.1% (398)
Marital status - White alone, not Hispanic / Latino population 15 years and over
Males 31.1% Never married52.4% Now married1.1% Separated2.2% Widowed13.1% DivorcedFemales 26.0% Never married53.4% Now married0.9% Separated9.6% Widowed10.0% DivorcedWomen who gave birth in the past 12 months Now married:
84.5% (58)Unmarried:
15.5% (11)
Women who did not give birth in the past 12 months Now married:
37.6% (580)Unmarried:
62.4% (963)
Marital status - Hispanic or Latino population 15 years and over
Males 48.6% Never married48.3% Now married0.0% Separated0.0% Widowed3.1% DivorcedFemales 0.0% Never married91.4% Now married0.0% Separated0.0% Widowed8.6% DivorcedWomen who gave birth in the past 12 months Now married:
100.0% (46)Unmarried:
0.0% (0)
Women who did not give birth in the past 12 months Now married:
82.4% (45)Unmarried:
17.6% (10)
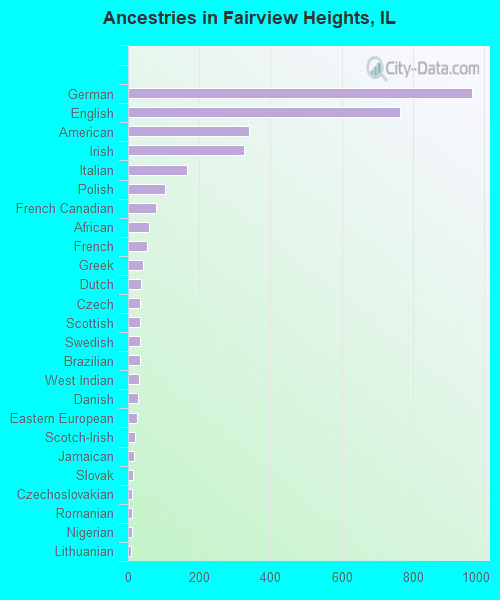
Ancestries in Fairview Heights
966 14.1% German765 11.2% English339 4.9% American325 4.7% Irish165 2.4% Italian103 1.5% Polish80 1.2% French Canadian60 0.9% African53 0.8% French41 0.6% Greek36 0.5% Dutch35 0.5% Czech35 0.5% Scottish35 0.5% Swedish33 0.5% Brazilian30 0.4% West Indian28 0.4% Danish26 0.4% Eastern European19 0.3% Scotch-Irish17 0.2% Jamaican15 0.2% Slovak12 0.2% Czechoslovakian12 0.2% Romanian12 0.2% Nigerian9 0.1% Lithuanian6 0.09% Canadian5 0.07% Haitian2 0.03% European
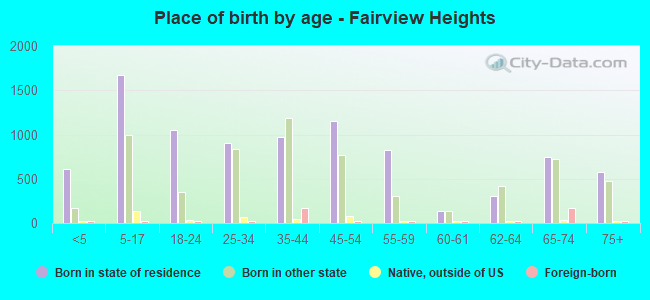
Children Nativity (place of birth) in Fairview Heights
Children under 6 years - Living with two parents Both parents native 204 100.0% NativeBoth parents foreign-born 42 100.0% NativeOne native, one foreign-born parent 23 100.0% NativeChildren under 6 years - Living with one parent Native parent 559 100.0% Native
Children 6 to 17 years - Living with two parents Both parents native 1,151 100.0% NativeBoth parents foreign-born 18 100.0% NativeOne native, one foreign-born parent 83 100.0% NativeChildren 6 to 17 years - Living with one parent Native parent 1,305 100.0% Native
Grandparents responsible for own grandchildren in Fairview Heights
Grandparents (30 to 59 years) White / Caucasian 58 77.3% Responsible for grandchildren17 22.7% Not responsible for grandchildrenBlack or African American 247 84.9% Responsible for grandchildren44 15.1% Not responsible for grandchildrenWhite alone, not Hispanic / Latino 58 76.8% Responsible for grandchildren18 23.2% Not responsible for grandchildrenGrandparents (60 years and over) White / Caucasian 12 88.6% Responsible for grandchildren2 11.4% Not responsible for grandchildrenBlack or African American 28 57.4% Responsible for grandchildren21 42.6% Not responsible for grandchildrenWhite alone, not Hispanic / Latino 13 89.1% Responsible for grandchildren2 10.9% Not responsible for grandchildren