Races in Falman-County Acres, Texas (TX) Detailed Stats
Ancestries, Foreign-born residents, place of birth

Discuss Falman-County Acres, Texas races on our local forum with over 2,400,000 registered users
1.7% of Falman-County Acres, TX residents are foreign-born , which is 882.6% less than the foreign-born rate of 17.0% across the entire state of Texas.
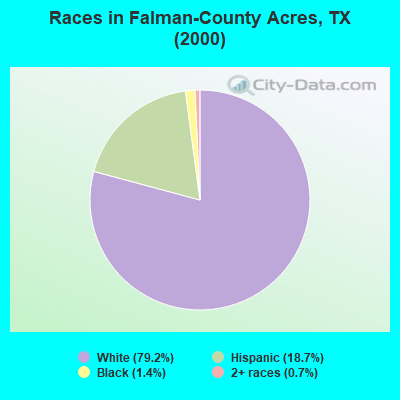
Race distribution in Falman-County Acres

- 22979.2%White alone
- 5418.7%Hispanic
- 41.4%Black alone
- 20.7%Two or more races
2000
2022
-
- 10,933,31352.4%White alone
- 6,669,66632.0%Hispanic
- 2,364,25511.3%Black alone
- 554,4452.7%Asian alone
- 230,5671.1%Two or more races
- 68,8590.3%American Indian alone
- 19,9580.10%Other race alone
- 10,7570.05%Native Hawaiian and Other
Pacific Islander alone

-
- 12,070,64240.2%Hispanic
- 11,683,43038.9%White alone
- 3,508,70611.7%Black alone
- 1,608,1735.4%Asian alone
- 956,5603.2%Two or more races
- 125,7630.4%Other race alone
- 47,0230.2%American Indian alone
- 29,2750.10%Native Hawaiian and Other
Pacific Islander alone

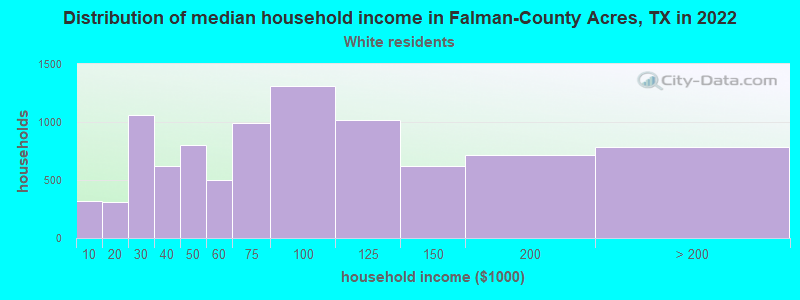
Income and house value in Falman-County Acres
- Median household income in 2022
- $47,082White non-Hispanic householders
- Median 2022 house value
- $247,234White Non-Hispanic householders
Household income for White non-Hispanic householders
Foreign-born residents in Falman-County Acres
5 residents are foreign born
| This city: | 1.7% |
| Texas: | 13.9% |
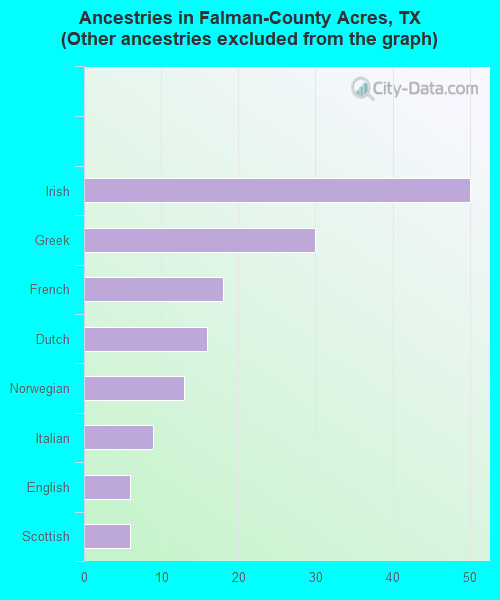
Ancestries in Falman-County Acres

- 6329.9%Other
- 5023.7%Irish
- 3014.2%Greek
- 188.5%French
- 167.6%Dutch
- 136.2%Norwegian
- 94.3%Italian
- 62.8%English
- 62.8%Scottish
Zip codes: 78336.