Races in Farragut, Tennessee (TN) Detailed Stats
Ancestries, Foreign-born residents, place of birth
Settings
X


Recent posts about races in Farragut, Tennessee on our local forum with over 2,400,000 registered users:

Latest news about races in Farragut, TN collected exclusively by city-data.com from local newspapers, TV, and radio stations
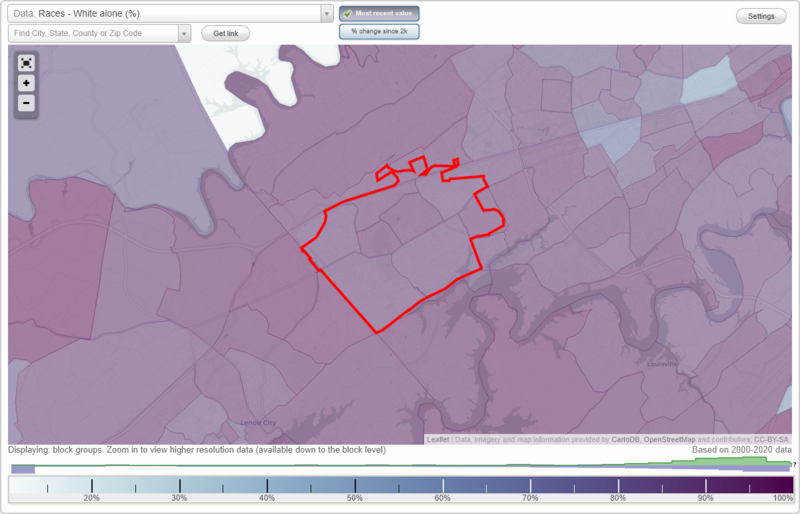
According to 2022 data, the most numerous races in Farragut, TN are White alone (21,979 residents), Black alone (197 residents), and Hispanic (615 residents). 92.6% of Farragut residents speak English at home. 6.4% of Farragut, TN residents are foreign-born (3.7% born in Asia, 1.4% born in Europe), which is 22.1% greater than the foreign-born rate of 5.0% across the entire state of Tennessee.
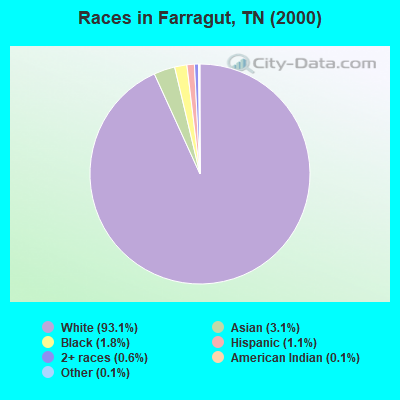
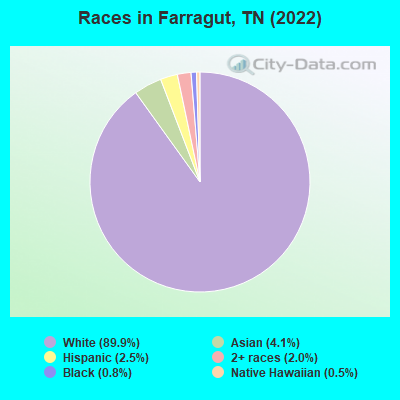
Race distribution in Farragut
2000
2022

- 16,50093.1%White alone
- 5583.1%Asian alone
- 3141.8%Black alone
- 1891.1%Hispanic
- 1090.6%Two or more races
- 240.1%Other race alone
- 260.1%American Indian alone
-
- 21,97989.9%White alone
- 1,0044.1%Asian alone
- 6152.5%Hispanic
- 4892.0%Two or more races
- 1970.8%Black alone
- 1160.5%Native Hawaiian and Other
Pacific Islander alone - 190.08%American Indian alone
- 100.04%Other race alone
2000
2022
-
- 4,505,93079.2%White alone
- 928,20416.3%Black alone
- 123,8382.2%Hispanic
- 54,8241.0%Two or more races
- 56,0771.0%Asian alone
- 13,8200.2%American Indian alone
- 4,7800.08%Other race alone
- 1,8100.03%Native Hawaiian and Other
Pacific Islander alone

-
- 5,070,02671.9%White alone
- 1,089,73815.5%Black alone
- 442,6296.3%Hispanic
- 279,3814.0%Two or more races
- 131,8171.9%Asian alone
- 26,9720.4%Other race alone
- 6,3870.09%American Indian alone
- 4,3890.06%Native Hawaiian and Other
Pacific Islander alone

Income and house value in Farragut
- Median household income in 2022
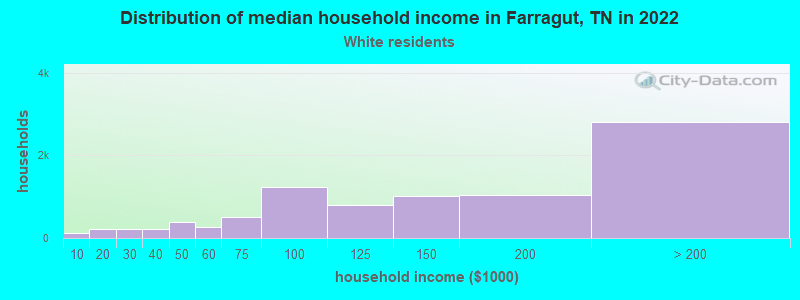
- $137,028White non-Hispanic householders
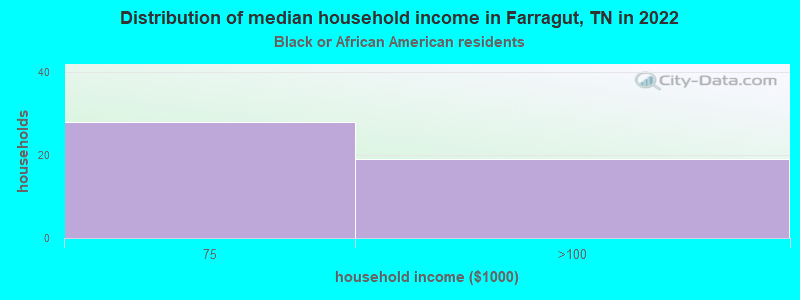
- $93,082Black householders
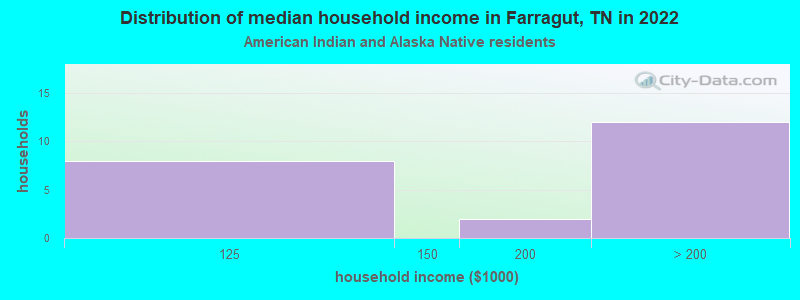
- over $200,000American Indian and Alaska Native householders
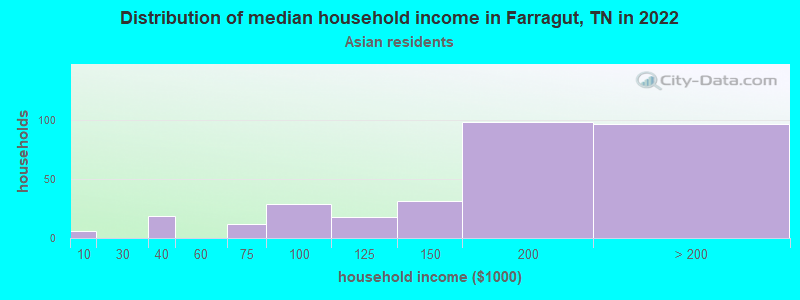
- $152,152Asian householders
- Median 2022 house value
- $576,922White Non-Hispanic householders
- $502,759Black or African American householders
- $311,246American Indian or Alaska Native householders
- $662,998Asian householders
- $282,950Some other race householders
- $318,096Two or more races householders
- $282,355Hispanic or Latino householders
Household income for White non-Hispanic householders
Household income for Black householders
Household income for American Indian and Alaska Native householders
Household income for Asian householders
Household income for Two or more races householders
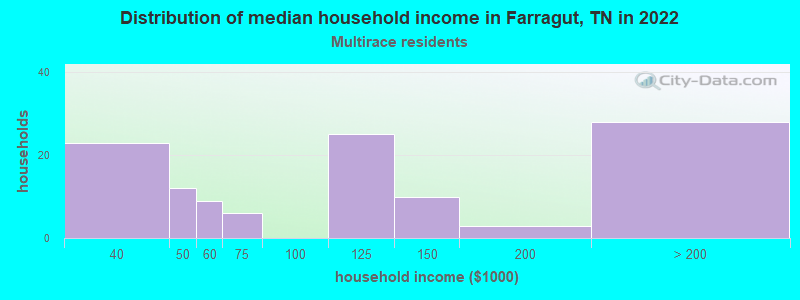
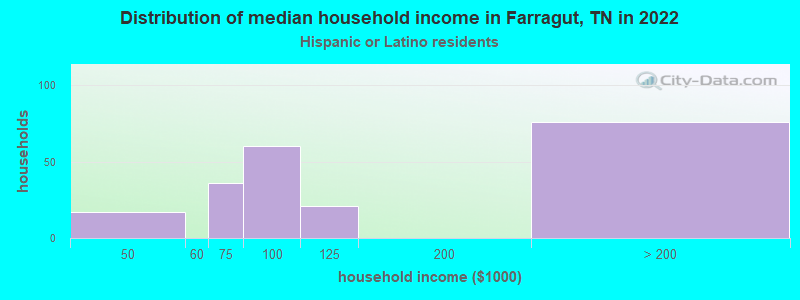
Household income for Hispanic or Latino race householders
Median age by race in Farragut
- 46.8Median age for White residents
- 46.6Males
- 46.5Females
- 23.3Median age for Black or African American residents
- 14.6Males
- 49.7Females
- 60.5Median age for American Indian / Alaska Native residents
- -655,105,972.4Males
- -599,732,261.8Females
- 44.0Median age for Asian residents
- 50.5Males
- 42.5Females
- 80.1Median age for Native Hawaiian / Pacific Islander residents
- -951,707,890.7Males
- -735,930,735.2Females
- 50.8Median age for Other race residents
- -556,067,587.8Males
- 62.9Females
- 24.4Median age for Two or more races residents
- 25.5Males
- 23.9Females
- 46.5Median age for White alone residents
- 46.3Males
- 46.0Females
- 36.3Median age for Hispanic or Latino residents
- 21.2Males
- 44.8Females
Owner/renter occupied households by race in Farragut
- House owners and renters - White residents
- 7,35085.9%Owner occupied
- 1,20214.1%Renter occupied
- House owners and renters - Black or African American residents
- 39100.0%Owner occupied
- House owners and renters - American Indian / Alaska Native residents
- 11100.0%Owner occupied
- House owners and renters - Asian residents
- 29992.8%Owner occupied
- 237.2%Renter occupied
- House owners and renters - Native Hawaiian / Pacific Islander residents
- 38100.0%Owner occupied
- House owners and renters - Other race residents
- 4100.0%Owner occupied
- House owners and renters - Two or more races residents
- 10081.6%Owner occupied
- 2318.4%Renter occupied
- House owners and renters - White alone residents
- 7,26285.9%Owner occupied
- 1,19514.1%Renter occupied
- House owners and renters - Hispanic or Latino residents
- 20184.2%Owner occupied
- 3815.8%Renter occupied
Language usage in Farragut
- English speakers - Total
- 92.6% of residents of Farragut speak English at home.
- 0.5% of residents speak Spanish at home
- 9680.0%Speak English very well
- 2420.0%Speak English less than very well
- 6.9% of residents speak other language at home
- 1,23977.2%Speak English very well
- 36522.8%Speak English less than very well
- English speakers - Born in the United States
- 97.4% of residents of Farragut speak English at home.
- 0.5% of residents speak Spanish at home
- 4282.4%Speak English very well
- 917.6%Speak English less than very well
- 1.4% of residents speak other language at home
- 154100.0%Speak English very well
- English speakers - Native, born elsewhere
- 82.8% of residents of Farragut speak English at home.
- 4.7% of residents speak other language at home
- 22100.0%Speak English less than very well
- English speakers - Foreign-born
- 25.0% of residents of Farragut speak English at home.
- 1.9% of residents speak Spanish at home
- 2578.1%Speak English very well
- 721.9%Speak English less than very well
- 75.9% of residents speak other language at home
- 1,00779.3%Speak English very well
- 26320.7%Speak English less than very well
White (Caucasian) - Speak only English
| Native: | 99.1% (20,303) |
| Foreign-born: | 44.6% (261) |
White (Caucasian) - Speak another language
| Native: | 0.8% (155) |
| Foreign-born: | 55.1% (322) |
Black or African American - Speak only English
| Native: | 100.0% (101) |
| Foreign-born: | 52.6% (60) |
Asian - Speak only English
| Native: | 43.2% (86) |
| Foreign-born: | 10.7% (83) |
Asian - Speak another language
| Native: | 56.8% (113) |
| Foreign-born: | 91.0% (706) |
Other race - Speak another language
| Native: | 33.1% (7) |
| Foreign-born: | 100.0% (30) |
Two or more races - Speak another language
| Native: | 3.8% (25) |
| Foreign-born: | 100.0% (48) |
White alone - Speak only English
| Native: | 98.7% (20,094) |
| Foreign-born: | 33.2% (247) |
White alone - Speak another language
| Native: | 1.0% (202) |
| Foreign-born: | 66.5% (495) |
Hispanic or Latino - Speak only English
| Native: | 79.3% (387) |
| Foreign-born: | 30.4% (27) |
Hispanic or Latino - Speak another language
| Native: | 1.0% (5) |
| Foreign-born: | 45.4% (40) |
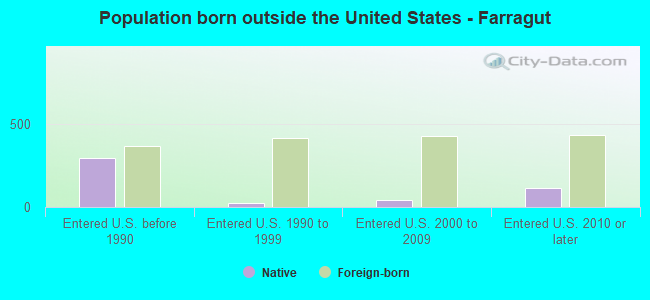
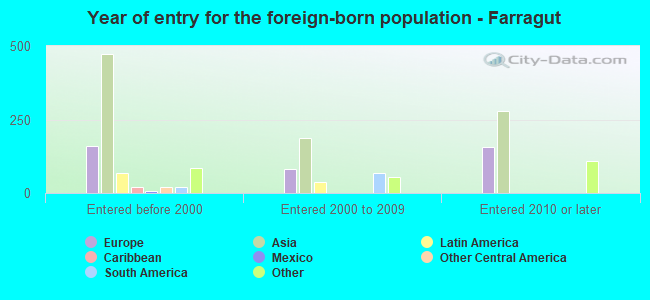
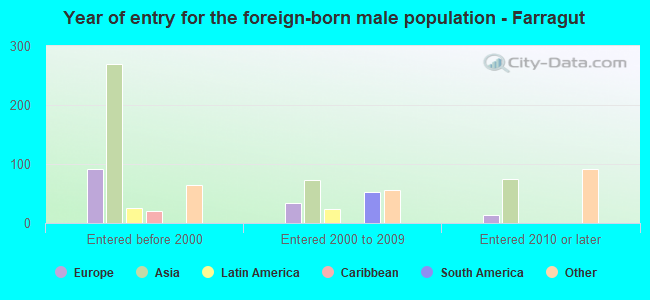
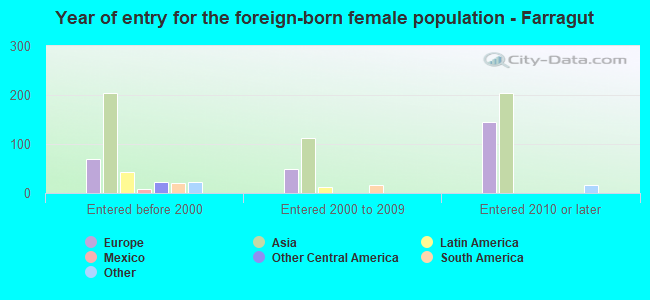
Foreign-born residents in Farragut
1,570 residents are foreign born (3.7% Asia, 1.4% Europe).
| This city: | 6.4% |
| Tennessee: | 5.4% |
Marital status for residents in Farragut
Marital status - White (Caucasian) population 15 years and over
- Males
- 22.6%Never married
- 65.9%Now married
- 0.7%Separated
- 3.5%Widowed
- 7.3%Divorced
- Females
- 19.8%Never married
- 61.7%Now married
- 1.3%Separated
- 9.6%Widowed
- 7.7%Divorced
Women who gave birth in the past 12 months
| Now married: | 92.1% (207) |
| Unmarried: | 7.9% (18) |
Women who did not give birth in the past 12 months
| Now married: | 54.7% (2,302) |
| Unmarried: | 45.3% (1,910) |
Marital status - Black or African American population 15 years and over
- Males
- 61.3%Never married
- 38.7%Now married
- 0.0%Separated
- 0.0%Widowed
- 0.0%Divorced
- Females
- 62.2%Never married
- 12.2%Now married
- 0.0%Separated
- 25.5%Widowed
- 0.0%Divorced
Women who did not give birth in the past 12 months
| Now married: | 21.1% (12) |
| Unmarried: | 78.9% (45) |
Marital status - American Indian / Alaska Native population 15 years and over
- Males
- 0.0%Never married
- 100.0%Now married
- 0.0%Separated
- 0.0%Widowed
- 0.0%Divorced
- Females
- 0.0%Never married
- 100.0%Now married
- 0.0%Separated
- 0.0%Widowed
- 0.0%Divorced
Marital status - Asian population 15 years and over
- Males
- 6.9%Never married
- 83.3%Now married
- 0.0%Separated
- 6.5%Widowed
- 3.3%Divorced
- Females
- 26.0%Never married
- 74.0%Now married
- 0.0%Separated
- 0.0%Widowed
- 0.0%Divorced
Women who did not give birth in the past 12 months
| Now married: | 62.3% (205) |
| Unmarried: | 37.7% (124) |
Marital status - Native Hawaiian / Pacific Islander population 15 years and over
- Males
- 0.0%Never married
- 100.0%Now married
- 0.0%Separated
- 0.0%Widowed
- 0.0%Divorced
- Females
- 53.2%Never married
- 46.8%Now married
- 0.0%Separated
- 0.0%Widowed
- 0.0%Divorced
Women who gave birth in the past 12 months
| Now married: | 0.0% (0) |
| Unmarried: | 100.0% (31) |
Marital status - Other race population 15 years and over
- Males
- 66.7%Never married
- 33.3%Now married
- 0.0%Separated
- 0.0%Widowed
- 0.0%Divorced
- Females
- 0.0%Never married
- 100.0%Now married
- 0.0%Separated
- 0.0%Widowed
- 0.0%Divorced
Women who did not give birth in the past 12 months
| Now married: | 100.0% (5) |
| Unmarried: | 0.0% (0) |
Marital status - Two or more races population 15 years and over
- Males
- 61.4%Never married
- 38.1%Now married
- 0.0%Separated
- 0.0%Widowed
- 0.5%Divorced
- Females
- 44.6%Never married
- 46.9%Now married
- 0.0%Separated
- 6.5%Widowed
- 1.9%Divorced
Women who did not give birth in the past 12 months
| Now married: | 31.2% (73) |
| Unmarried: | 68.7% (160) |
Marital status - White alone, not Hispanic / Latino population 15 years and over
- Males
- 21.9%Never married
- 66.6%Now married
- 0.7%Separated
- 3.2%Widowed
- 7.4%Divorced
- Females
- 19.8%Never married
- 61.6%Now married
- 1.3%Separated
- 9.8%Widowed
- 7.5%Divorced
Women who gave birth in the past 12 months
| Now married: | 89.7% (157) |
| Unmarried: | 10.3% (18) |
Women who did not give birth in the past 12 months
| Now married: | 54.8% (2,331) |
| Unmarried: | 45.2% (1,920) |
Marital status - Hispanic or Latino population 15 years and over
- Males
- 60.7%Never married
- 25.4%Now married
- 0.0%Separated
- 13.9%Widowed
- 0.0%Divorced
- Females
- 29.2%Never married
- 56.6%Now married
- 0.0%Separated
- 5.9%Widowed
- 8.3%Divorced
Women who gave birth in the past 12 months
| Now married: | 100.0% (58) |
| Unmarried: | 0.0% (0) |
Women who did not give birth in the past 12 months
| Now married: | 13.4% (14) |
| Unmarried: | 86.6% (92) |
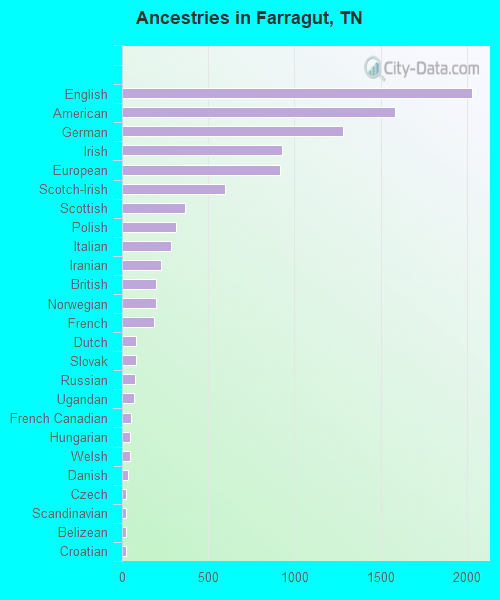
Ancestries in Farragut

- 2,02716.7%English
- 1,58313.1%American
- 1,28410.6%German
- 9277.7%Irish
- 9157.6%European
- 5984.9%Scotch-Irish
- 3683.0%Scottish
- 3132.6%Polish
- 2842.3%Italian
- 2271.9%Iranian
- 1971.6%British
- 1951.6%Norwegian
- 1871.5%French
- 840.7%Dutch
- 800.7%Slovak
- 730.6%Russian
- 670.6%Ugandan
- 500.4%French Canadian
- 460.4%Hungarian
- 460.4%Welsh
- 320.3%Danish
- 260.2%Czech
- 260.2%Scandinavian
- 260.2%Belizean
- 250.2%Croatian
- 220.2%Belgian
- 220.2%Greek
- 210.2%Eastern European
- 160.1%Romanian
- 160.1%Swedish
- 150.1%Brazilian
- 120.10%Swiss
- 110.09%Austrian
- 70.06%Macedonian
- 60.05%Jordanian
- 40.03%Australian
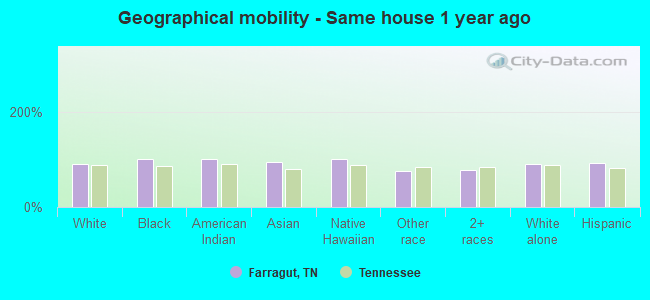
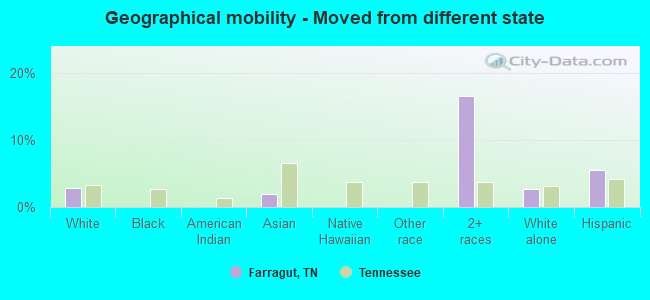
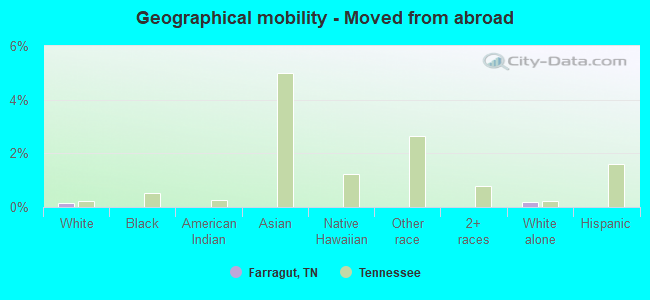
Geographical mobility in Farragut

- Same house 1 year ago
- 19,67690.0%White (Caucasian)
- 204100.0%Black or African American
- 21100.0%American Indian / Alaska Native
- 95494.3%Asian
- 90100.0%Native Hawaiian / Pacific Islander
- 3475.5%Other race
- 60278.3%Two or more races
- 19,63489.9%White alone, not Hispanic / Latino
- 54793.2%Hispanic or Latino
-
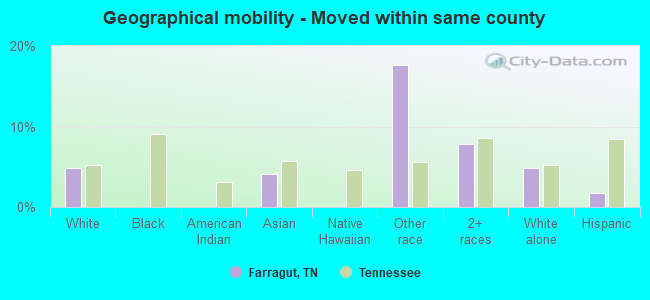
- Moved within same county
- 1,0584.8%White / Caucasian
- 424.1%Asian
- 817.7%Other race
- 607.8%Two or more races
- 1,0634.9%White alone, not Hispanic / Latino
- 101.7%Hispanic or Latino
-
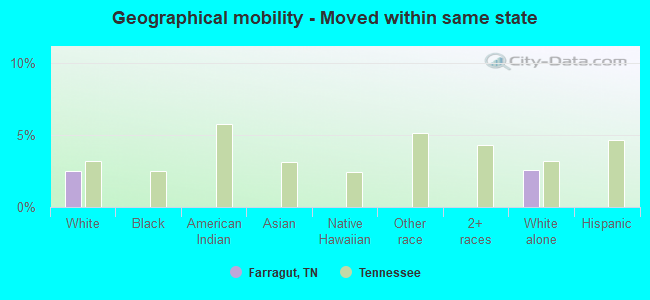
- Moved within same state
- 5422.5%White / Caucasian
- 5602.6%White alone, not Hispanic / Latino
-
- Moved from different state
- 6032.8%White / Caucasian
- 191.9%Asian
- 12716.5%Two or more races
- 5782.6%White alone, not Hispanic / Latino
- 325.5%Hispanic or Latino
-
- Moved from abroad
- 320.1%White
- 400.2%White alone, not Hispanic / Latino
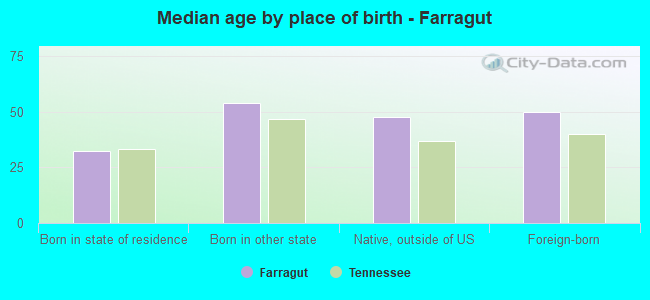
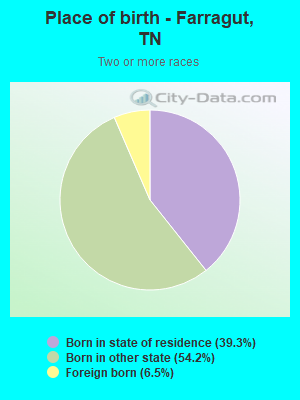
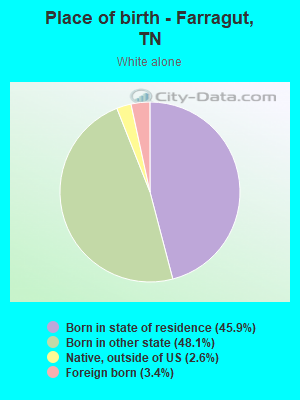
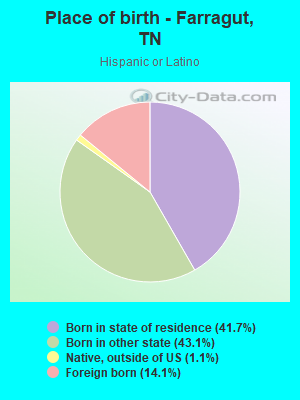
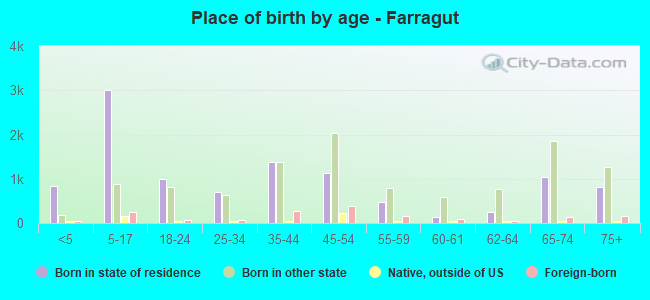
Children Nativity (place of birth) in Farragut
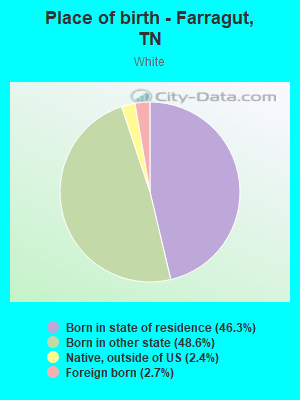
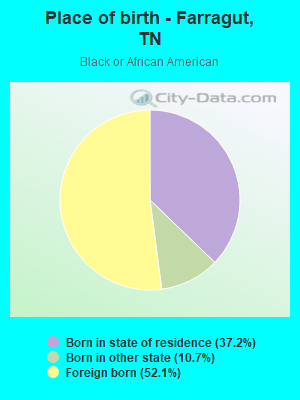
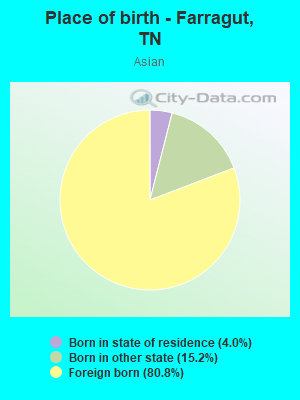
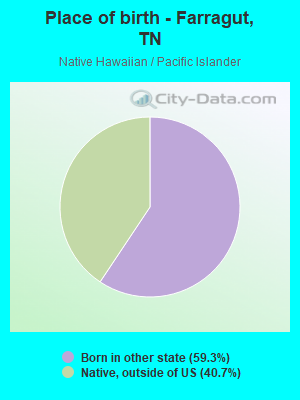
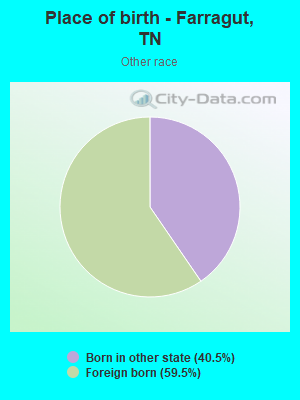
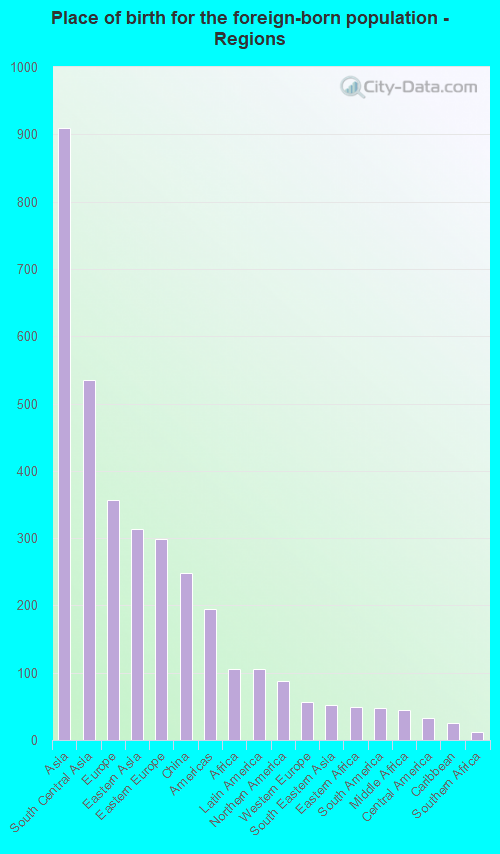
Place of birth for residents in Farragut
![Place of birth for the foreign-born population - Regions]()
- 909Asia
- 535South Central Asia
- 356Europe
- 313Eastern Asia
- 299Eastern Europe
- 248China
- 194Americas
- 106Africa
- 105Latin America
- 88Northern America
- 56Western Europe
- 52South Eastern Asia
- 49Eastern Africa
- 48South America
- 44Middle Africa
- 32Central America
- 25Caribbean
- 12Southern Africa
- 8Western Asia
- 3Oceania
- 3Australia and New Zealand Subregion
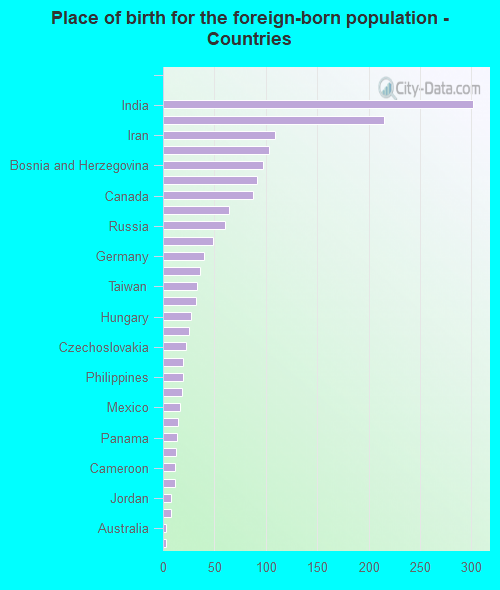
![Place of birth for the foreign-born population - Countries]()
- 302India
- 215China
- 109Iran
- 103Pakistan
- 97Bosnia and Herzegovina
- 91Poland
- 88Canada
- 64Korea
- 60Russia
- 49Uganda
- 40Germany
- 36Colombia
- 33Taiwan
- 32Congo
- 27Hungary
- 25Cuba
- 22Czechoslovakia
- 19Bangladesh
- 19Philippines
- 18Vietnam
- 17Mexico
- 15Austria
- 14Panama
- 13Indonesia
- 12Cameroon
- 12South Africa
- 8Jordan
- 8Brazil
- 3Australia
- 3Venezuela