Races in Florence, Wisconsin (WI) Detailed Stats
Ancestries, Foreign-born residents, place of birth
Data:
Latest news about races in Florence, WI collected exclusively by city-data.com from local newspapers, TV, and radio stations
0.6% of Florence, WI residents are foreign-born , which is 673.0% less than the foreign-born rate of 5.0% across the entire state of Wisconsin.
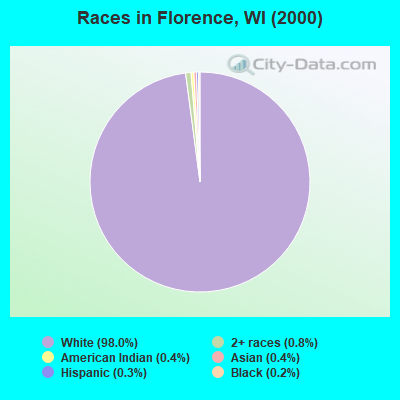
Race distribution in Florence

- 2,27298.0%White alone
- 180.8%Two or more races
- 90.4%Asian alone
- 100.4%American Indian alone
- 60.3%Hispanic
- 40.2%Black alone
2000
2022
-
- 4,681,63087.3%White alone
- 300,2455.6%Black alone
- 192,9213.6%Hispanic
- 87,9951.6%Asian alone
- 51,9211.0%Two or more races
- 43,9800.8%American Indian alone
- 3,6370.07%Other race alone
- 1,3460.03%Native Hawaiian and Other
Pacific Islander alone
-
- 4,654,03179.0%White alone
- 447,0227.6%Hispanic
- 345,6785.9%Black alone
- 217,5323.7%Two or more races
- 172,2422.9%Asian alone
- 33,7620.6%American Indian alone
- 19,6800.3%Other race alone
- 2,5920.04%Native Hawaiian and Other
Pacific Islander alone
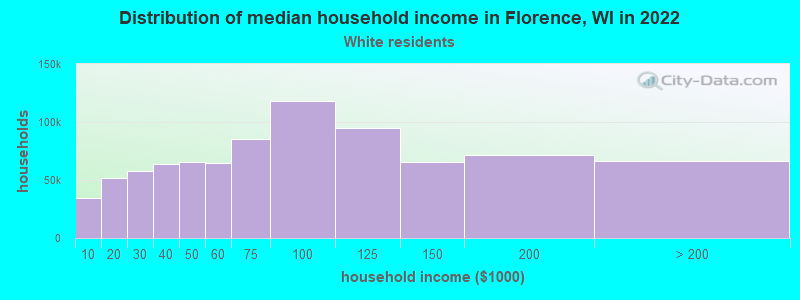
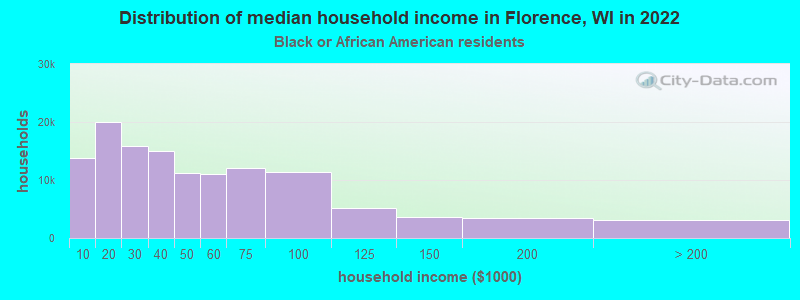
Income and house value in Florence
- Median household income in 2022
- $60,860White non-Hispanic householders
- $19,415Black householders
- Median 2022 house value
- $196,675White Non-Hispanic householders
- $69,176Black or African American householders
Foreign-born residents in Florence
15 residents are foreign born
| This city: | 0.6% |
| Wisconsin: | 3.6% |
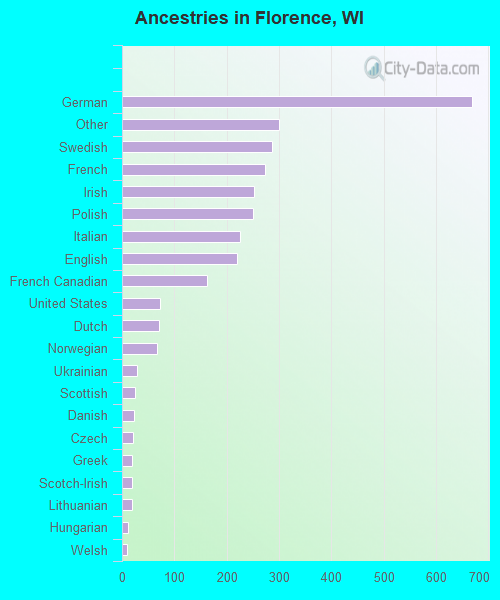
Ancestries in Florence

- 66822.0%German
- 3009.9%Other
- 2879.5%Swedish
- 2739.0%French
- 2538.3%Irish
- 2508.3%Polish
- 2257.4%Italian
- 2197.2%English
- 1625.3%French Canadian
- 722.4%United States
- 712.3%Dutch
- 662.2%Norwegian
- 291.0%Ukrainian
- 250.8%Scottish
- 230.8%Danish
- 210.7%Czech
- 200.7%Greek
- 200.7%Scotch-Irish
- 190.6%Lithuanian
- 120.4%Hungarian
- 90.3%Welsh
- 60.2%Slovak