Races in Flower Mound, Texas (TX) Detailed Stats
Data:
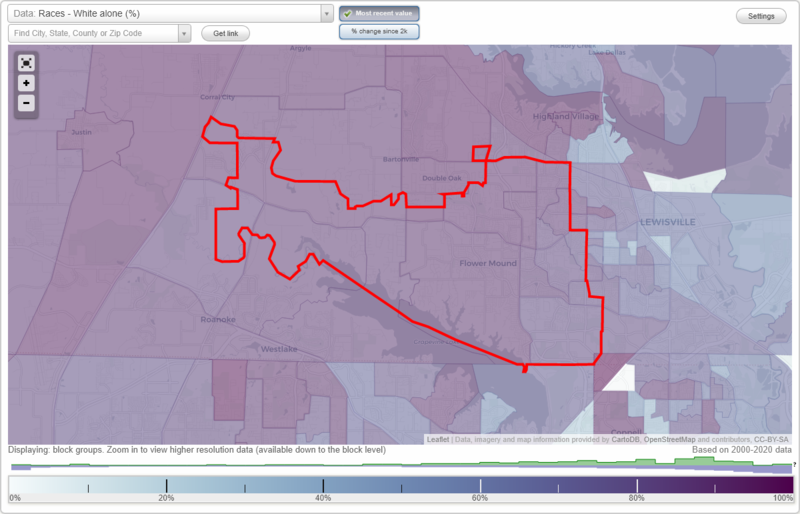
Races - White alone (%)
Races - White alone (% change since 2000)
Races - Black alone (%)
Races - Black alone (% change since 2000)
Races - American Indian alone (%)
Races - American Indian alone (% change since 2000)
Races - Asian alone (%)
Races - Asian alone (% change since 2000)
Races - Hispanic (%)
Races - Hispanic (% change since 2000)
Races - Native Hawaiian and Other Pacific Islander alone (%)
Races - Native Hawaiian and Other Pacific Islander alone (% change since 2000)
Races - Two or more races(%)
Races - Two or more races(% change since 2000)
Races - Other race alone (%)
Races - Other race alone (% change since 2000)
Racial diversity
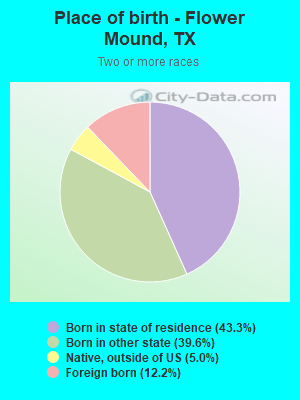
Place of birth - Born in state of residence (%)
Place of birth - Born in state of residence (%) - White
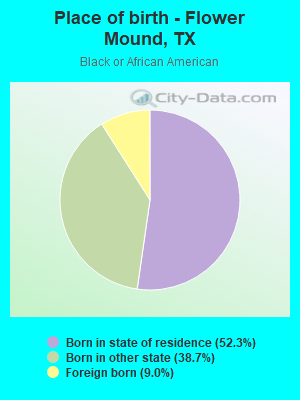
Place of birth - Born in state of residence (%) - Black or African American
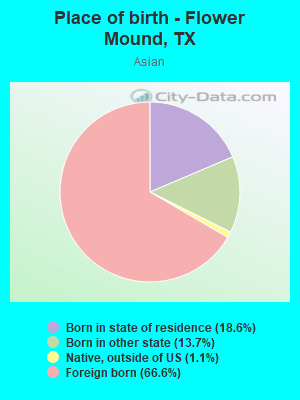
Place of birth - Born in state of residence (%) - Asian
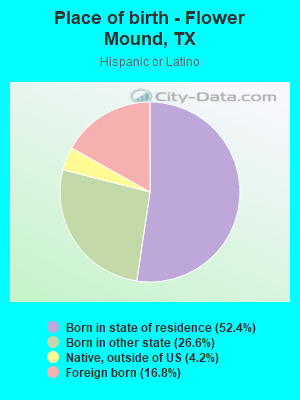
Place of birth - Born in state of residence (%) - Hispanic or Latino
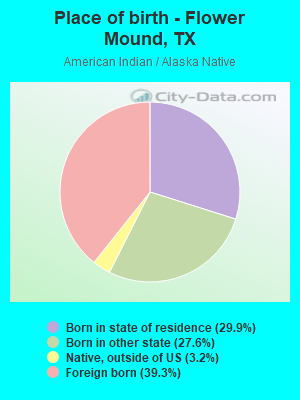
Place of birth - Born in state of residence (%) - American Indian and Alaska Native
Place of birth - Born in state of residence (%) - Multirace
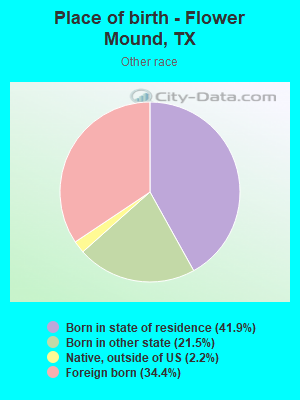
Place of birth - Born in state of residence (%) - Other Race
Place of birth - Born in other state (%)
Place of birth - Born in other state (%) - White
Place of birth - Born in other state (%) - Black or African American
Place of birth - Born in other state (%) - Asian
Place of birth - Born in other state (%) - Hispanic or Latino
Place of birth - Born in other state (%) - American Indian and Alaska Native
Place of birth - Born in other state (%) - Multirace
Place of birth - Born in other state (%) - Other Race
Place of birth - Native, outside of US (%)
Place of birth - Native, outside of US (%) - White
Place of birth - Native, outside of US (%) - Black or African American
Place of birth - Native, outside of US (%) - Asian
Place of birth - Native, outside of US (%) - Hispanic or Latino
Place of birth - Native, outside of US (%) - American Indian and Alaska Native
Place of birth - Native, outside of US (%) - Multirace
Place of birth - Native, outside of US (%) - Other Race
Place of birth - Foreign born (%)
Place of birth - Foreign born (%) - White
Place of birth - Foreign born (%) - Black or African American
Place of birth - Foreign born (%) - Asian
Place of birth - Foreign born (%) - Hispanic or Latino
Place of birth - Foreign born (%) - American Indian and Alaska Native
Place of birth - Foreign born (%) - Multirace
Place of birth - Foreign born (%) - Other Race
Residents speaking English at home (%)
Residents speaking English at home - Born in the United States (%)
Residents speaking English at home - Native, born elsewhere (%)
Residents speaking English at home - Foreign born (%)
Residents speaking Spanish at home (%)
Residents speaking Spanish at home - Born in the United States (%)
Residents speaking Spanish at home - Native, born elsewhere (%)
Residents speaking Spanish at home - Foreign born (%)
Residents speaking other language at home (%)
Residents speaking other language at home - Born in the United States (%)
Residents speaking other language at home - Native, born elsewhere (%)
Residents speaking other language at home - Foreign born (%)
Marital status - Never married (%)
Marital status - Now married (%)
Marital status - Separated (%)
Marital status - Widowed (%)
Marital status - Divorced (%)
Ancestries Reported - Arab (%)
Ancestries Reported - Czech (%)
Ancestries Reported - Danish (%)
Ancestries Reported - Dutch (%)
Ancestries Reported - English (%)
Ancestries Reported - French (%)
Ancestries Reported - French Canadian (%)
Ancestries Reported - German (%)
Ancestries Reported - Greek (%)
Ancestries Reported - Hungarian (%)
Ancestries Reported - Irish (%)
Ancestries Reported - Italian (%)
Ancestries Reported - Lithuanian (%)
Ancestries Reported - Norwegian (%)
Ancestries Reported - Polish (%)
Ancestries Reported - Portuguese (%)
Ancestries Reported - Russian (%)
Ancestries Reported - Scotch-Irish (%)
Ancestries Reported - Scottish (%)
Ancestries Reported - Slovak (%)
Ancestries Reported - Subsaharan African (%)
Ancestries Reported - Swedish (%)
Ancestries Reported - Swiss (%)
Ancestries Reported - Ukrainian (%)
Ancestries Reported - United States (%)
Ancestries Reported - Welsh (%)
Ancestries Reported - West Indian (%)
Ancestries Reported - Other (%)
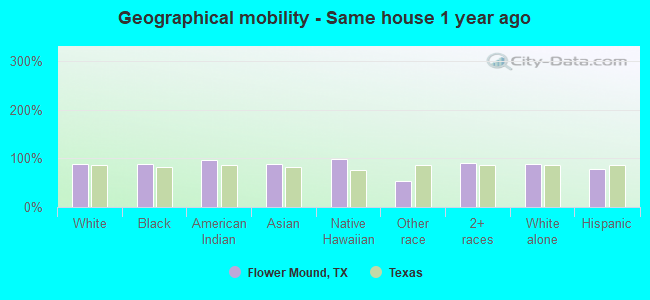
Geographical mobility - Same house 1 year ago (%)
Geographical mobility - Same house 1 year ago (%) - White
Geographical mobility - Same house 1 year ago (%) - Black or African American
Geographical mobility - Same house 1 year ago (%) - Asian
Geographical mobility - Same house 1 year ago (%) - Hispanic or Latino
Geographical mobility - Same house 1 year ago (%) - American Indian and Alaska Native
Geographical mobility - Same house 1 year ago (%) - Multirace
Geographical mobility - Same house 1 year ago (%) - Other Race
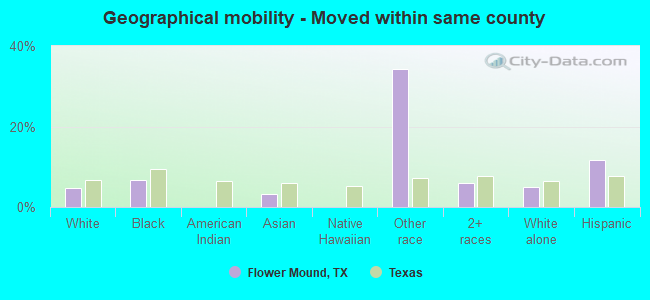
Geographical mobility - Moved within same county (%)
Geographical mobility - Moved within same county (%) - White
Geographical mobility - Moved within same county (%) - Black or African American
Geographical mobility - Moved within same county (%) - Asian
Geographical mobility - Moved within same county (%) - Hispanic or Latino
Geographical mobility - Moved within same county (%) - American Indian and Alaska Native
Geographical mobility - Moved within same county (%) - Multirace
Geographical mobility - Moved within same county (%) - Other Race
Geographical mobility - Moved from different county within same state (%)
Geographical mobility - Moved from different county within same state (%) - White
Geographical mobility - Moved from different county within same state (%) - Black or African American
Geographical mobility - Moved from different county within same state (%) - Asian
Geographical mobility - Moved from different county within same state (%) - Hispanic or Latino
Geographical mobility - Moved from different county within same state (%) - American Indian and Alaska Native
Geographical mobility - Moved from different county within same state (%) - Multirace
Geographical mobility - Moved from different county within same state (%) - Other Race
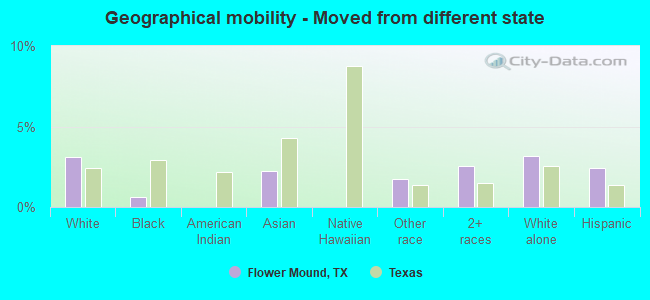
Geographical mobility - Moved from different state (%)
Geographical mobility - Moved from different state (%) - White
Geographical mobility - Moved from different state (%) - Black or African American
Geographical mobility - Moved from different state (%) - Asian
Geographical mobility - Moved from different state (%) - Hispanic or Latino
Geographical mobility - Moved from different state (%) - American Indian and Alaska Native
Geographical mobility - Moved from different state (%) - Multirace
Geographical mobility - Moved from different state (%) - Other Race
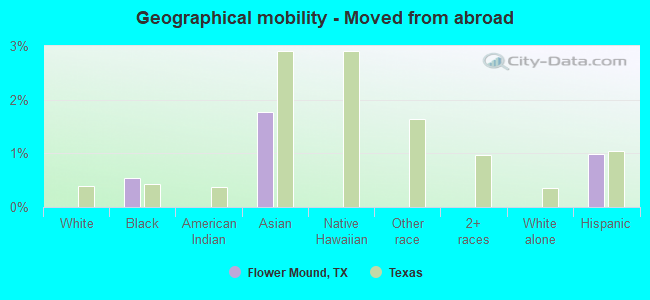
Geographical mobility - Moved from abroad (%)
Geographical mobility - Moved from abroad (%) - White
Geographical mobility - Moved from abroad (%) - Black or African American
Geographical mobility - Moved from abroad (%) - Asian
Geographical mobility - Moved from abroad (%) - Hispanic or Latino
Geographical mobility - Moved from abroad (%) - American Indian and Alaska Native
Geographical mobility - Moved from abroad (%) - Multirace
Geographical mobility - Moved from abroad (%) - Other Race
Place of birth for the foreign-born population - Ireland (%)
Place of birth for the foreign-born population - Denmark (%)
Place of birth for the foreign-born population - Norway (%)
Place of birth for the foreign-born population - Sweden (%)
Place of birth for the foreign-born population - United Kingdom (%)
Place of birth for the foreign-born population - England (%)
Place of birth for the foreign-born population - Scotland (%)
Place of birth for the foreign-born population - Other Northern Europe (%)
Place of birth for the foreign-born population - Austria (%)
Place of birth for the foreign-born population - Belgium (%)
Place of birth for the foreign-born population - France (%)
Place of birth for the foreign-born population - Germany (%)
Place of birth for the foreign-born population - Netherlands (%)
Place of birth for the foreign-born population - Switzerland (%)
Place of birth for the foreign-born population - Other Western Europe (%)
Place of birth for the foreign-born population - Greece (%)
Place of birth for the foreign-born population - Italy (%)
Place of birth for the foreign-born population - Portugal (%)
Place of birth for the foreign-born population - Spain (%)
Place of birth for the foreign-born population - Other Southern Europe (%)
Place of birth for the foreign-born population - Albania (%)
Place of birth for the foreign-born population - Belarus (%)
Place of birth for the foreign-born population - Bosnia and Herzegovina (%)
Place of birth for the foreign-born population - Bulgaria (%)
Place of birth for the foreign-born population - Croatia (%)
Place of birth for the foreign-born population - Czechoslovakia (%)
Place of birth for the foreign-born population - Hungary (%)
Place of birth for the foreign-born population - Latvia (%)
Place of birth for the foreign-born population - Lithuania (%)
Place of birth for the foreign-born population - North Macedonia (Macedonia) (%)
Place of birth for the foreign-born population - Moldova (%)
Place of birth for the foreign-born population - Poland (%)
Place of birth for the foreign-born population - Romania (%)
Place of birth for the foreign-born population - Russia (%)
Place of birth for the foreign-born population - Serbia (%)
Place of birth for the foreign-born population - Ukraine (%)
Place of birth for the foreign-born population - Other Eastern Europe (%)
Place of birth for the foreign-born population - China (%)
Place of birth for the foreign-born population - Hong Kong (%)
Place of birth for the foreign-born population - Taiwan (%)
Place of birth for the foreign-born population - Japan (%)
Place of birth for the foreign-born population - Korea (%)
Place of birth for the foreign-born population - Other Eastern Asia (%)
Place of birth for the foreign-born population - Afghanistan (%)
Place of birth for the foreign-born population - Bangladesh (%)
Place of birth for the foreign-born population - India (%)
Place of birth for the foreign-born population - Iran (%)
Place of birth for the foreign-born population - Kazakhstan (%)
Place of birth for the foreign-born population - Nepal (%)
Place of birth for the foreign-born population - Pakistan (%)
Place of birth for the foreign-born population - Sri Lanka (%)
Place of birth for the foreign-born population - Uzbekistan (%)
Place of birth for the foreign-born population - Other South Central Asia (%)
Place of birth for the foreign-born population - Burma (%)
Place of birth for the foreign-born population - Cambodia (%)
Place of birth for the foreign-born population - Indonesia (%)
Place of birth for the foreign-born population - Laos (%)
Place of birth for the foreign-born population - Malaysia (%)
Place of birth for the foreign-born population - Philippines (%)
Place of birth for the foreign-born population - Singapore (%)
Place of birth for the foreign-born population - Thailand (%)
Place of birth for the foreign-born population - Vietnam (%)
Place of birth for the foreign-born population - Other South Eastern Asia (%)
Place of birth for the foreign-born population - Armenia (%)
Place of birth for the foreign-born population - Iraq (%)
Place of birth for the foreign-born population - Israel (%)
Place of birth for the foreign-born population - Jordan (%)
Place of birth for the foreign-born population - Kuwait (%)
Place of birth for the foreign-born population - Lebanon (%)
Place of birth for the foreign-born population - Saudi Arabia (%)
Place of birth for the foreign-born population - Syria (%)
Place of birth for the foreign-born population - Turkey (%)
Place of birth for the foreign-born population - Yemen (%)
Place of birth for the foreign-born population - Other Western Asia (%)
Place of birth for the foreign-born population - Eritrea (%)
Place of birth for the foreign-born population - Ethiopia (%)
Place of birth for the foreign-born population - Kenya (%)
Place of birth for the foreign-born population - Somalia (%)
Place of birth for the foreign-born population - Uganda (%)
Place of birth for the foreign-born population - Zimbabwe (%)
Place of birth for the foreign-born population - Other Eastern Africa (%)
Place of birth for the foreign-born population - Cameroon (%)
Place of birth for the foreign-born population - Congo (%)
Place of birth for the foreign-born population - Democratic Republic of Congo (Zaire) (%)
Place of birth for the foreign-born population - Other Middle Africa (%)
Place of birth for the foreign-born population - Egypt (%)
Place of birth for the foreign-born population - Morocco (%)
Place of birth for the foreign-born population - Sudan (%)
Place of birth for the foreign-born population - Other Northern Africa (%)
Place of birth for the foreign-born population - South Africa (%)
Place of birth for the foreign-born population - Other Southern Africa (%)
Place of birth for the foreign-born population - Cabo Verde (%)
Place of birth for the foreign-born population - Ghana (%)
Place of birth for the foreign-born population - Liberia (%)
Place of birth for the foreign-born population - Nigeria (%)
Place of birth for the foreign-born population - Senegal (%)
Place of birth for the foreign-born population - Sierra Leone (%)
Place of birth for the foreign-born population - Other Western Africa (%)
Place of birth for the foreign-born population - Australia (%)
Place of birth for the foreign-born population - New Zealand (%)
Place of birth for the foreign-born population - Fiji (%)
Place of birth for the foreign-born population - Micronesia (%)
Place of birth for the foreign-born population - Bahamas (%)
Place of birth for the foreign-born population - Barbados (%)
Place of birth for the foreign-born population - Cuba (%)
Place of birth for the foreign-born population - Dominica (%)
Place of birth for the foreign-born population - Dominican Republic (%)
Place of birth for the foreign-born population - Grenada (%)
Place of birth for the foreign-born population - Haiti (%)
Place of birth for the foreign-born population - Jamaica (%)
Place of birth for the foreign-born population - St. Vincent and the Grenadines (%)
Place of birth for the foreign-born population - Trinidad and Tobago (%)
Place of birth for the foreign-born population - West Indies (%)
Place of birth for the foreign-born population - Other Caribbean (%)
Place of birth for the foreign-born population - Belize (%)
Place of birth for the foreign-born population - Costa Rica (%)
Place of birth for the foreign-born population - El Salvador (%)
Place of birth for the foreign-born population - Guatemala (%)
Place of birth for the foreign-born population - Honduras (%)
Place of birth for the foreign-born population - Mexico (%)
Place of birth for the foreign-born population - Nicaragua (%)
Place of birth for the foreign-born population - Panama (%)
Place of birth for the foreign-born population - Other Central America (%)
Place of birth for the foreign-born population - Argentina (%)
Place of birth for the foreign-born population - Bolivia (%)
Place of birth for the foreign-born population - Brazil (%)
Place of birth for the foreign-born population - Chile (%)
Place of birth for the foreign-born population - Colombia (%)
Place of birth for the foreign-born population - Ecuador (%)
Place of birth for the foreign-born population - Guyana (%)
Place of birth for the foreign-born population - Peru (%)
Place of birth for the foreign-born population - Uruguay (%)
Place of birth for the foreign-born population - Venezuela (%)
Place of birth for the foreign-born population - Other South America (%)
Place of birth for the foreign-born population - Canada (%)
Place of birth for the foreign-born population - Other Northern America (%)
Place of birth for the foreign-born population - Other (%)
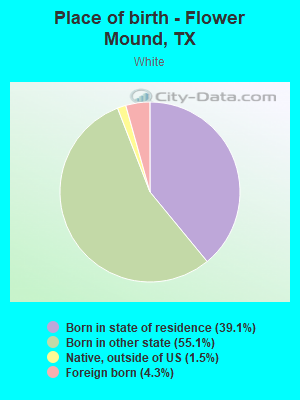
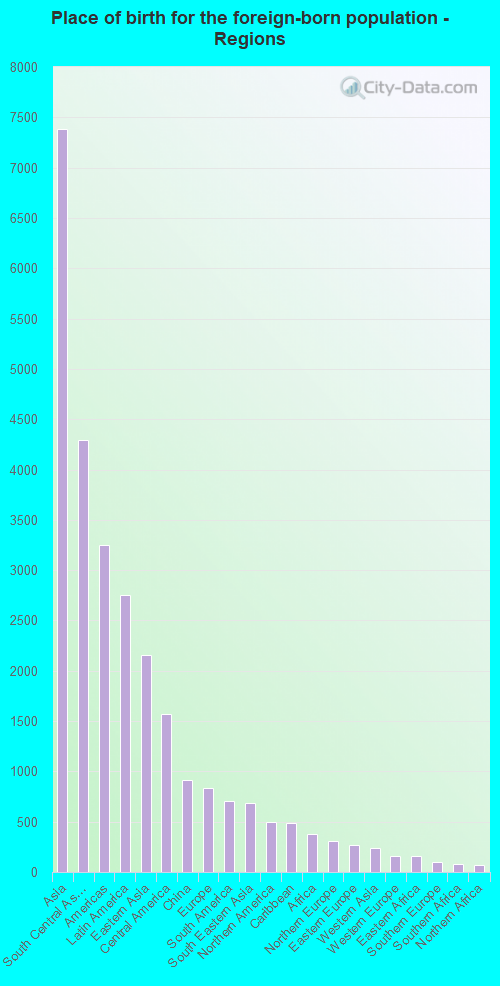
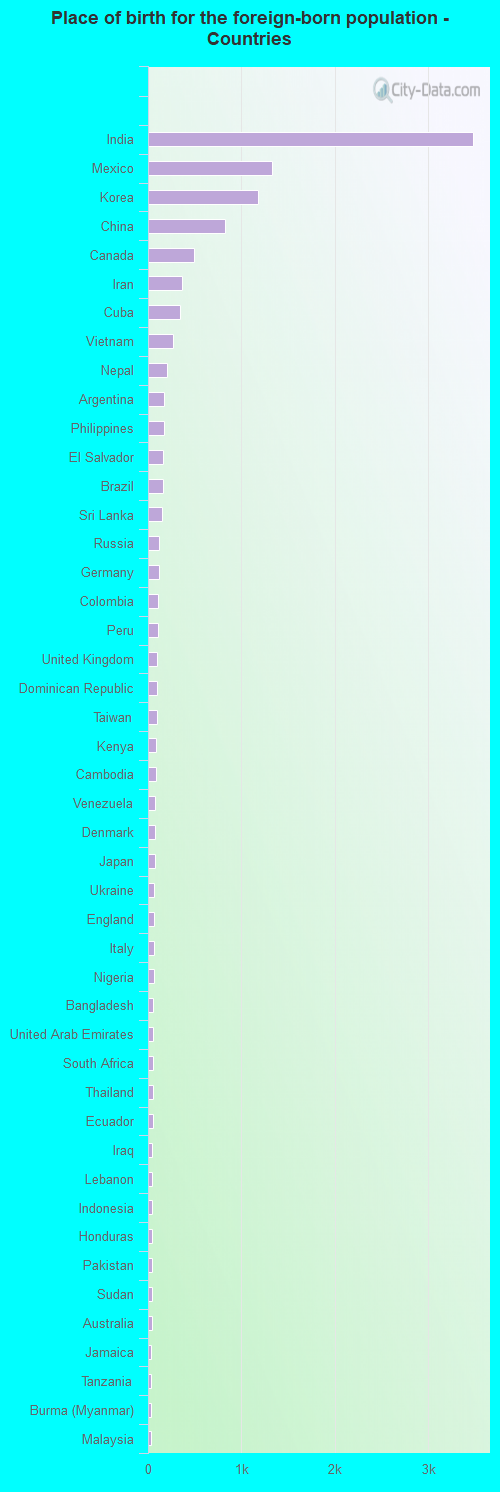
According to 2022 data, the most numerous races in Flower Mound, TX are Hispanic (8,464 residents), White alone (50,938 residents), and Black alone (2,460 residents). 80.7% of Flower Mound residents speak English at home. 14.5% of Flower Mound, TX residents are foreign-born (9.3% born in Asia, 3.5% born in Latin America), which is 17.0% less than the foreign-born rate of 17.0% across the entire state of Texas.
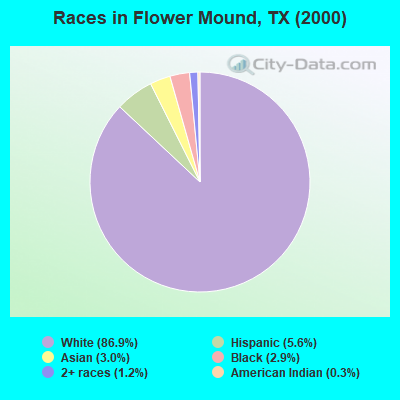
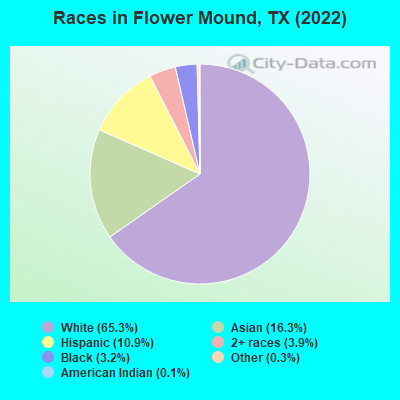
Race distribution in Flower Mound
2000 2022
10,933,313 52.4% White alone 6,669,666 32.0% Hispanic 2,364,255 11.3% Black alone 554,445 2.7% Asian alone 230,567 1.1% Two or more races 68,859 0.3% American Indian alone 19,958 0.10% Other race alone 10,757 0.05% Native Hawaiian and Other
12,070,642 40.2% Hispanic 11,683,430 38.9% White alone 3,508,706 11.7% Black alone 1,608,173 5.4% Asian alone 956,560 3.2% Two or more races 125,763 0.4% Other race alone 47,023 0.2% American Indian alone 29,275 0.10% Native Hawaiian and Other
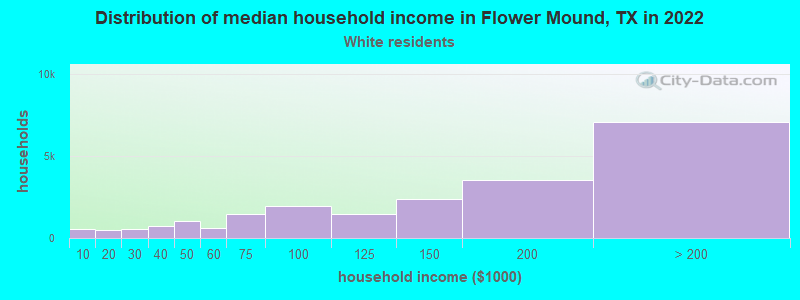
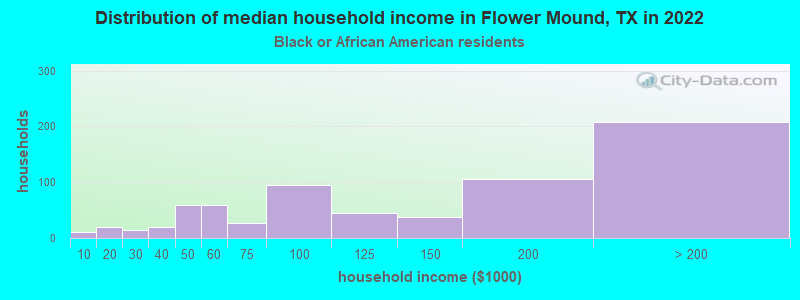
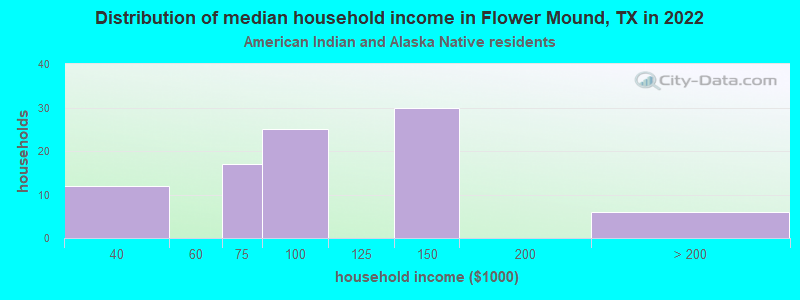
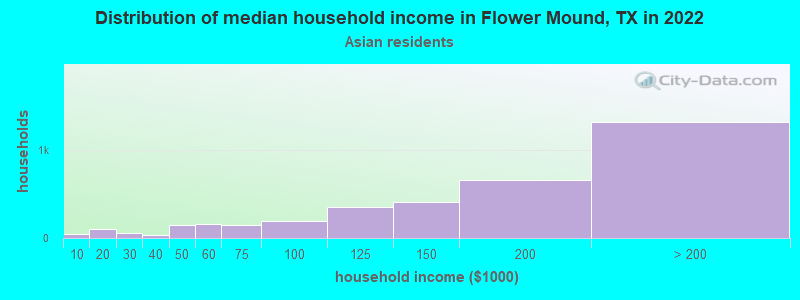
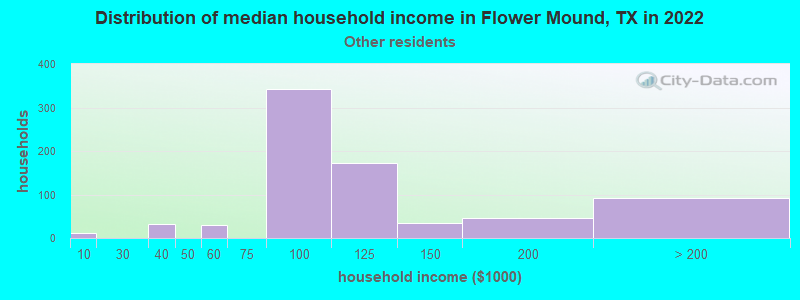
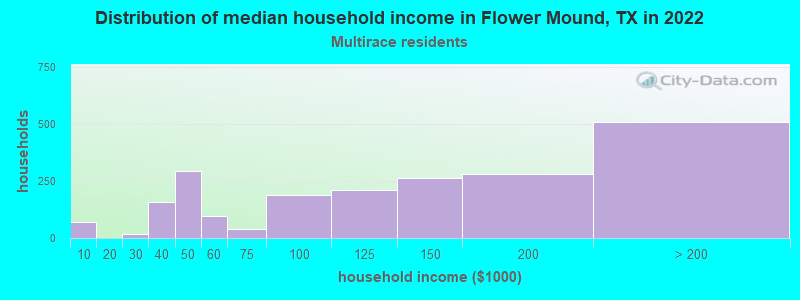
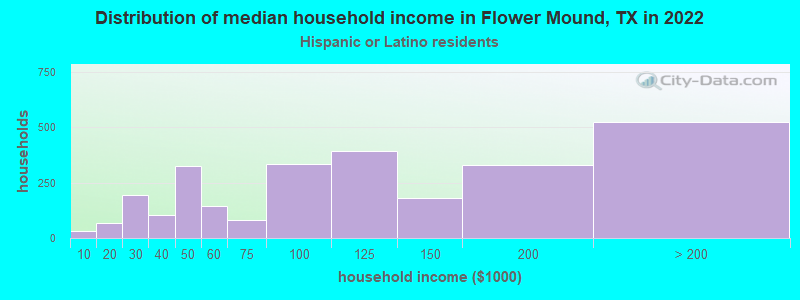
Income and house value in Flower Mound Median household income in 2022 $143,295 White non-Hispanic householders$142,489 Black householders$174,741 Asian householders$115,625 Some other race householders$126,656 Two or more races householders$118,519 Hispanic or Latino race householdersMedian 2022 house value $584,530 White Non-Hispanic householders$613,184 Black or African American householders$599,175 American Indian or Alaska Native householders $664,442 Asian householders$358,168 Native Hawaiian and other Pacific Islander householders$581,665 Some other race householders$437,124 Two or more races householders$573,069 Hispanic or Latino householders
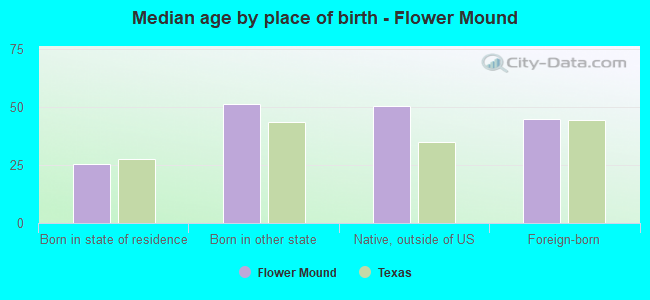
Median age by race in Flower Mound
48.1 Median age for White residents48.1 48.1 37.1 Median age for Black or African American residents31.7 53.5 33.0 Median age for American Indian / Alaska Native residents32.8 54.4 39.5 Median age for Asian residents36.9 40.3 -666,666,666.0 Median age for Native Hawaiian / Pacific Islander residents-666,666,666.0 -666,666,666.0 25.3 Median age for Other race residents37.1 24.5 40.4 Median age for Two or more races residents40.0 40.7 48.4 Median age for White alone residents48.6 48.3 35.8 Median age for Hispanic or Latino residents22.3 40.5
Owner/renter occupied households by race in Flower Mound
House owners and renters - White residents 16,700 76.7% Owner occupied5,083 23.3% Renter occupiedHouse owners and renters - Black or African American residents 580 77.0% Owner occupied173 23.0% Renter occupiedHouse owners and renters - American Indian / Alaska Native residents 113 100.0% Owner occupiedHouse owners and renters - Asian residents 3,521 93.6% Owner occupied239 6.4% Renter occupiedHouse owners and renters - Native Hawaiian / Pacific Islander residents 3 100.0% Owner occupiedHouse owners and renters - Other race residents 559 82.9% Owner occupied115 17.1% Renter occupiedHouse owners and renters - Two or more races residents 1,772 71.7% Owner occupied700 28.3% Renter occupiedHouse owners and renters - White alone residents 16,219 76.3% Owner occupied5,026 23.7% Renter occupiedHouse owners and renters - Hispanic or Latino residents 1,647 68.1% Owner occupied773 31.9% Renter occupied
Language usage in Flower Mound
English speakers - Total 80.7% of residents of Flower Mound speak English at home.
5.2% of residents speak Spanish at home 2,961 75.3% Speak English very well973 24.7% Speak English less than very well14.1% of residents speak other language at home 8,568 80.5% Speak English very well2,071 19.5% Speak English less than very well
English speakers - Born in the United States 94.2% of residents of Flower Mound speak English at home.
3.2% of residents speak Spanish at home 1,019 90.7% Speak English very well105 9.3% Speak English less than very well2.6% of residents speak other language at home 800 89.3% Speak English very well96 10.7% Speak English less than very well
English speakers - Native, born elsewhere 71.0% of residents of Flower Mound speak English at home.
29.0% of residents speak Spanish at home 208 52.5% Speak English very well188 47.5% Speak English less than very well
English speakers - Foreign-born 17.2% of residents of Flower Mound speak English at home.
11.1% of residents speak Spanish at home 834 61.0% Speak English very well534 39.0% Speak English less than very well71.7% of residents speak other language at home 6,998 79.0% Speak English very well1,864 21.0% Speak English less than very well
White (Caucasian) - Speak only English Native:
97.9% (47,488)Foreign-born:
25.1% (567)
White (Caucasian) - Speak another language Native:
2.1% (1,016)Foreign-born:
74.9% (1,696)
Black or African American - Speak only English Native:
97.6% (2,281)Foreign-born:
25.4% (77)
Black or African American - Speak another language Native:
2.4% (56)Foreign-born:
72.6% (221)
American Indian / Alaska Native - Speak only English Native:
58.8% (124)Foreign-born:
54.1% (64)
American Indian / Alaska Native - Speak another language Native:
38.4% (81)Foreign-born:
53.2% (63)
Asian - Speak only English Native:
58.4% (2,146)Foreign-born:
15.8% (1,332)
Asian - Speak another language Native:
41.6% (1,527)Foreign-born:
84.2% (7,093)
Other race - Speak only English Native:
45.9% (983)Foreign-born:
4.2% (51)
Other race - Speak another language Native:
54.1% (1,157)Foreign-born:
96.8% (1,175)
Two or more races - Speak another language Native:
22.0% (1,604)Foreign-born:
100.0% (1,044)
White alone - Speak only English Native:
98.1% (46,686)Foreign-born:
26.7% (567)
White alone - Speak another language Native:
1.9% (898)Foreign-born:
73.3% (1,553)
Hispanic or Latino - Speak only English Native:
75.1% (4,952)Foreign-born:
4.1% (58)
Hispanic or Latino - Speak another language Native:
24.9% (1,639)Foreign-born:
95.9% (1,368)
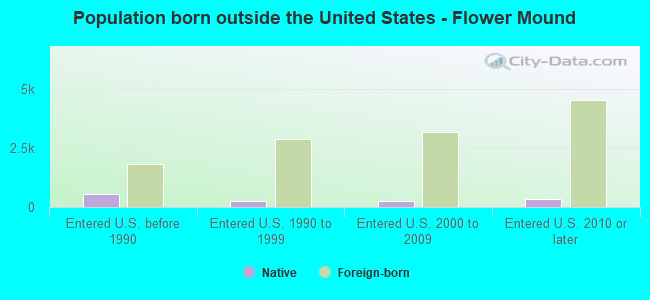
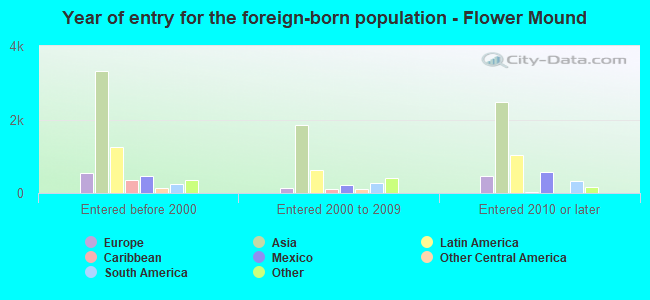
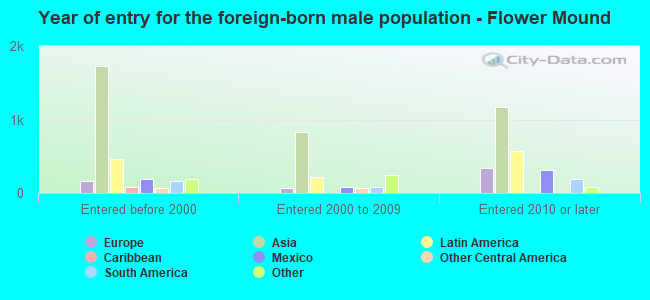
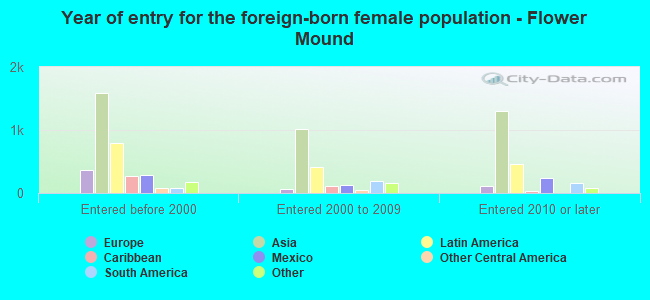
Foreign-born residents in Flower Mound 11,893 residents are foreign born (9.3% Asia , 3.5% Latin America ).
This city:
14.5%Texas:
17.1%
Marital status for residents in Flower Mound Marital status - White (Caucasian) population 15 years and over
Males 23.0% Never married68.0% Now married0.1% Separated1.9% Widowed7.1% DivorcedFemales 19.6% Never married59.3% Now married0.0% Separated7.0% Widowed14.2% DivorcedWomen who gave birth in the past 12 months Now married:
69.8% (383)Unmarried:
30.2% (166)
Women who did not give birth in the past 12 months Now married:
46.8% (4,912)Unmarried:
53.2% (5,576)
Marital status - Black or African American population 15 years and over
Males 29.1% Never married66.0% Now married0.1% Separated0.0% Widowed4.9% DivorcedFemales 38.4% Never married38.8% Now married0.0% Separated3.8% Widowed19.1% DivorcedWomen who gave birth in the past 12 months Now married:
100.0% (12)Unmarried:
0.0% (0)
Women who did not give birth in the past 12 months Now married:
30.8% (243)Unmarried:
69.2% (546)
Marital status - American Indian / Alaska Native population 15 years and over
Males 33.9% Never married59.1% Now married0.0% Separated0.0% Widowed7.0% DivorcedFemales 33.7% Never married55.4% Now married0.0% Separated10.9% Widowed0.0% DivorcedWomen who did not give birth in the past 12 months Now married:
45.6% (37)Unmarried:
54.4% (44)
Marital status - Asian population 15 years and over
Males 20.5% Never married77.5% Now married1.1% Separated0.9% Widowed0.0% DivorcedFemales 15.4% Never married76.2% Now married0.0% Separated0.1% Widowed8.3% DivorcedWomen who gave birth in the past 12 months Now married:
100.0% (74)Unmarried:
0.0% (0)
Women who did not give birth in the past 12 months Now married:
73.4% (2,445)Unmarried:
26.6% (886)
Marital status - Other race population 15 years and over
Males 57.0% Never married41.6% Now married0.0% Separated0.7% Widowed0.7% DivorcedFemales 37.4% Never married55.8% Now married0.0% Separated3.1% Widowed3.7% DivorcedWomen who gave birth in the past 12 months Now married:
100.0% (148)Unmarried:
0.0% (0)
Women who did not give birth in the past 12 months Now married:
47.2% (397)Unmarried:
52.8% (444)
Marital status - Two or more races population 15 years and over
Males 35.0% Never married56.3% Now married1.3% Separated0.0% Widowed7.4% DivorcedFemales 22.9% Never married49.1% Now married0.5% Separated4.3% Widowed23.1% DivorcedWomen who gave birth in the past 12 months Now married:
100.0% (37)Unmarried:
0.0% (0)
Women who did not give birth in the past 12 months Now married:
52.4% (746)Unmarried:
47.6% (677)
Marital status - White alone, not Hispanic / Latino population 15 years and over
Males 22.7% Never married68.1% Now married0.1% Separated1.9% Widowed7.3% DivorcedFemales 19.4% Never married59.0% Now married0.0% Separated7.2% Widowed14.5% DivorcedWomen who gave birth in the past 12 months Now married:
69.8% (383)Unmarried:
30.2% (166)
Women who did not give birth in the past 12 months Now married:
46.5% (4,712)Unmarried:
53.5% (5,425)
Marital status - Hispanic or Latino population 15 years and over
Males 36.5% Never married63.1% Now married0.0% Separated0.0% Widowed0.5% DivorcedFemales 26.9% Never married60.8% Now married0.0% Separated4.7% Widowed7.6% DivorcedWomen who gave birth in the past 12 months Now married:
100.0% (217)Unmarried:
0.0% (0)
Women who did not give birth in the past 12 months Now married:
45.7% (872)Unmarried:
54.3% (1,035)
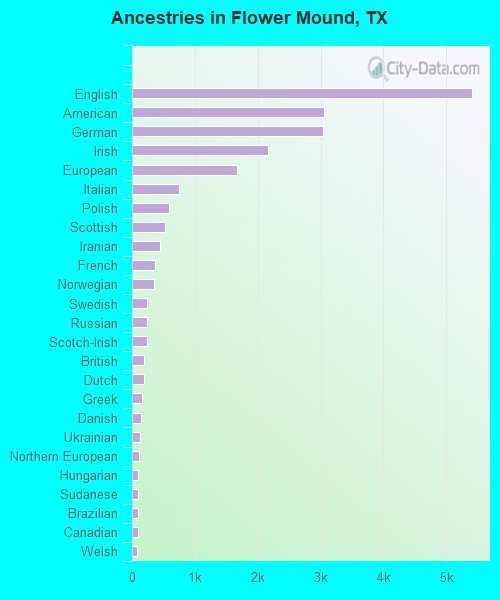
Ancestries in Flower Mound
5,411 14.1% English3,054 8.0% American3,037 7.9% German2,171 5.7% Irish1,676 4.4% European750 2.0% Italian593 1.5% Polish533 1.4% Scottish441 1.2% Iranian362 0.9% French352 0.9% Norwegian242 0.6% Swedish242 0.6% Russian233 0.6% Scotch-Irish191 0.5% British189 0.5% Dutch155 0.4% Greek137 0.4% Danish123 0.3% Ukrainian118 0.3% Northern European100 0.3% Hungarian94 0.2% Sudanese94 0.2% Brazilian93 0.2% Canadian87 0.2% Welsh79 0.2% Jamaican64 0.2% Finnish55 0.1% Portuguese54 0.1% Czech54 0.1% Swiss53 0.1% Australian46 0.1% Palestinian43 0.1% Iraqi39 0.1% Scandinavian39 0.1% Lebanese38 0.10% Latvian34 0.09% Eastern European33 0.09% Belgian33 0.09% New Zealander31 0.08% Ugandan30 0.08% Serbian29 0.08% French Canadian28 0.07% Czechoslovakian24 0.06% African23 0.06% Turkish21 0.05% Nigerian20 0.05% Syrian20 0.05% Lithuanian19 0.05% Albanian18 0.05% Celtic18 0.05% Romanian18 0.05% Egyptian16 0.04% Slovene13 0.03% Moroccan10 0.03% Austrian10 0.03% Somali9 0.02% Pennsylvania German9 0.02% Haitian8 0.02% Yugoslavian5 0.01% Ethiopian
Geographical mobility in Flower Mound Same house 1 year ago 46,337 88.8% White (Caucasian)2,496 89.0% Black or African American362 96.6% American Indian / Alaska Native10,544 89.3% Asian3 98.2% Native Hawaiian / Pacific Islander1,810 53.8% Other race7,804 91.3% Two or more races45,374 89.2% White alone, not Hispanic / Latino7,306 78.8% Hispanic or LatinoMoved within same county 2,493 4.8% White / Caucasian189 6.7% Black or African American369 3.1% Asian1,152 34.3% Other race515 6.0% Two or more races2,493 4.9% White alone, not Hispanic / Latino1,089 11.7% Hispanic or LatinoMoved within same state 1,746 3.3% White / Caucasian36 1.3% Black or African American19 5.1% American Indian / Alaska Native389 3.3% Asian176 5.2% Other race10 0.1% Two or more races1,360 2.7% White alone, not Hispanic / Latino414 4.5% Hispanic or LatinoMoved from different state 1,615 3.1% White / Caucasian17 0.6% Black or African American260 2.2% Asian58 1.7% Other race217 2.5% Two or more races1,615 3.2% White alone, not Hispanic / Latino224 2.4% Hispanic or LatinoMoved from abroad 15 0.5% Black or African American210 1.8% Asian92 1.0% Hispanic or Latino
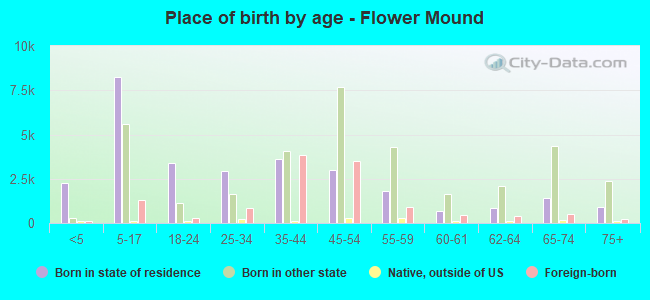
Children Nativity (place of birth) in Flower Mound
Children under 6 years - Living with two parents Both parents native 1,747 100.0% NativeBoth parents foreign-born 736 93.6% Native50 6.4% Foreign-bornOne native, one foreign-born parent 681 100.0% NativeChildren under 6 years - Living with one parent Native parent 535 100.0% NativeChildren 6 to 17 years - Living with two parents Both parents native 7,636 97.5% Native192 2.5% Foreign-bornBoth parents foreign-born 2,577 70.0% Native1,104 30.0% Foreign-bornOne native, one foreign-born parent 321 100.0% NativeChildren 6 to 17 years - Living with one parent Native parent 1,675 100.0% NativeForeign-born parent 347 50.0% Native347 50.0% Foreign-born
Grandparents responsible for own grandchildren in Flower Mound
Grandparents (30 to 59 years) White / Caucasian 109 47.7% Responsible for grandchildren120 52.3% Not responsible for grandchildrenBlack or African American 8 100.0% Responsible for grandchildrenTwo or more races 41 63.1% Responsible for grandchildren24 36.9% Not responsible for grandchildrenWhite alone, not Hispanic / Latino 75 36.9% Responsible for grandchildren129 63.1% Not responsible for grandchildrenHispanic or Latino 69 80.2% Responsible for grandchildren17 19.8% Not responsible for grandchildrenGrandparents (60 years and over) White / Caucasian 69 18.0% Responsible for grandchildren315 82.0% Not responsible for grandchildrenBlack or African American 20 100.0% Not responsible for grandchildrenTwo or more races 24 100.0% Not responsible for grandchildrenWhite alone, not Hispanic / Latino 56 14.3% Responsible for grandchildren333 85.7% Not responsible for grandchildrenHispanic or Latino 35 42.4% Responsible for grandchildren47 57.6% Not responsible for grandchildren