Races in Fork, South Carolina (SC) Detailed Stats
Ancestries, Foreign-born residents, place of birth
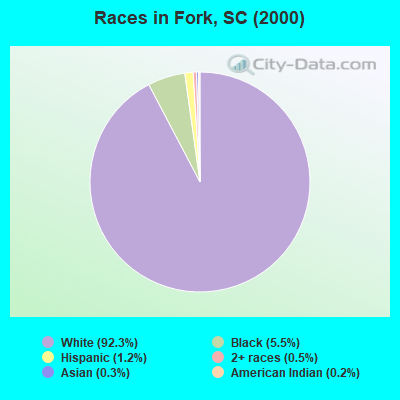
Race distribution in Fork

- 3,68792.3%White alone
- 2205.5%Black alone
- 471.2%Hispanic
- 200.5%Two or more races
- 120.3%Asian alone
- 60.2%American Indian alone
- 10.03%Native Hawaiian and Other
Pacific Islander alone
2000
2022
-
- 2,652,29166.1%White alone
- 1,178,48629.4%Black alone
- 95,0762.4%Hispanic
- 35,5680.9%Asian alone
- 33,2900.8%Two or more races
- 12,7650.3%American Indian alone
- 3,2660.08%Other race alone
- 1,2700.03%Native Hawaiian and Other
Pacific Islander alone

-
- 3,301,73962.5%White alone
- 1,313,29024.9%Black alone
- 343,7836.5%Hispanic
- 190,5083.6%Two or more races
- 89,8881.7%Asian alone
- 29,3900.6%Other race alone
- 12,1120.2%American Indian alone
- 1,9240.04%Native Hawaiian and Other
Pacific Islander alone

Income and house value in Fork
- Median household income in 2022
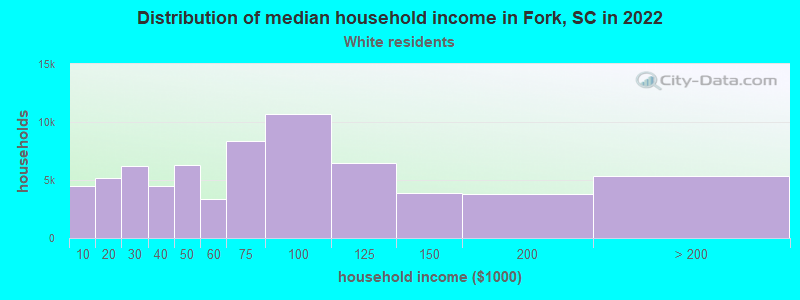
- $68,769White non-Hispanic householders
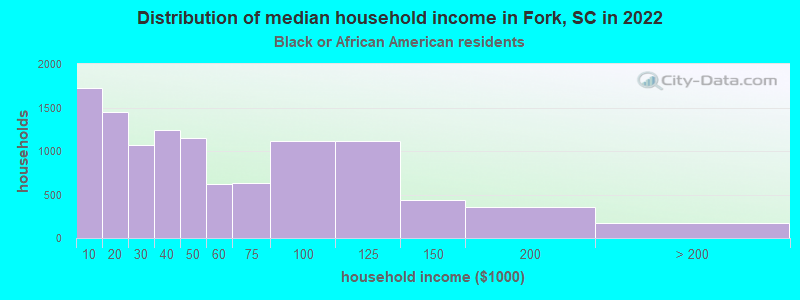
- $35,626Black householders
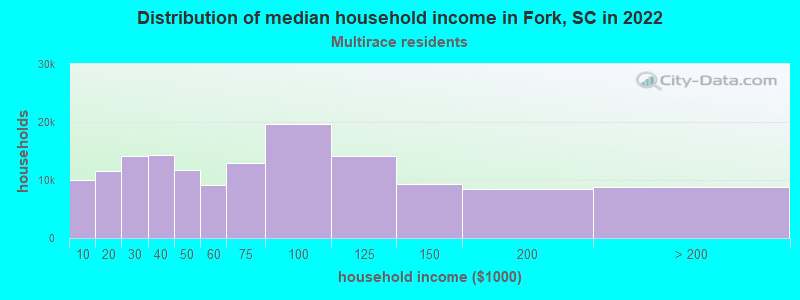
- $64,559Two or more races householders
- Median 2022 house value
- $353,943White Non-Hispanic householders
- $156,486Black or African American householders
Household income for White non-Hispanic householders
Household income for Black householders
Household income for Two or more races householders
Zip code: 29689