Races in Forney, Texas (TX) Detailed Stats
Data:
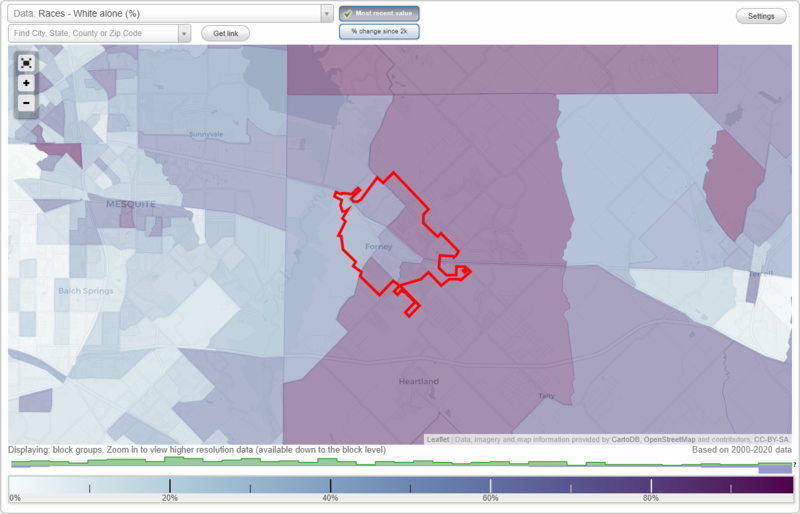
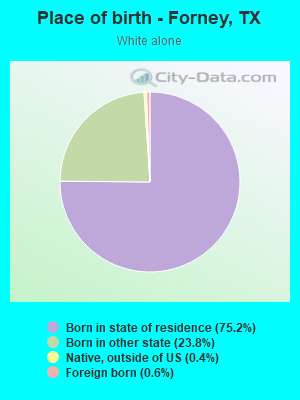
Races - White alone (%)
Races - White alone (% change since 2000)
Races - Black alone (%)
Races - Black alone (% change since 2000)
Races - American Indian alone (%)
Races - American Indian alone (% change since 2000)
Races - Asian alone (%)
Races - Asian alone (% change since 2000)
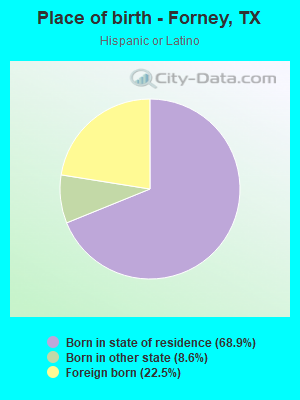
Races - Hispanic (%)
Races - Hispanic (% change since 2000)
Races - Native Hawaiian and Other Pacific Islander alone (%)
Races - Native Hawaiian and Other Pacific Islander alone (% change since 2000)
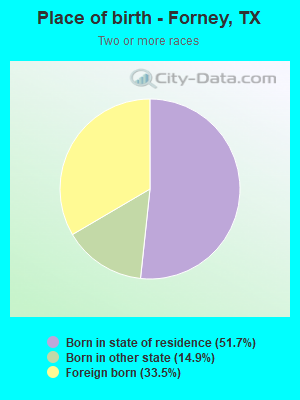
Races - Two or more races(%)
Races - Two or more races(% change since 2000)
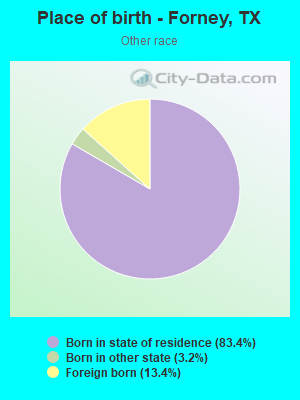
Races - Other race alone (%)
Races - Other race alone (% change since 2000)
Racial diversity
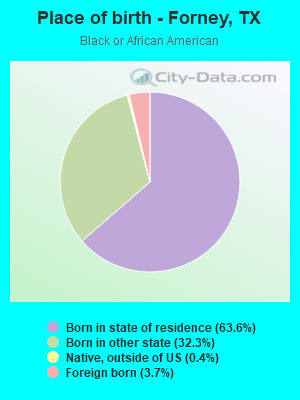
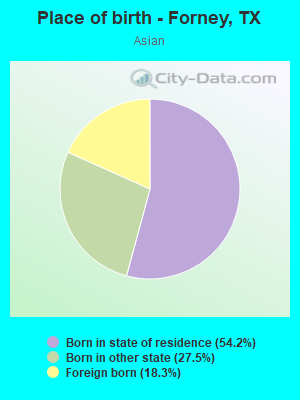
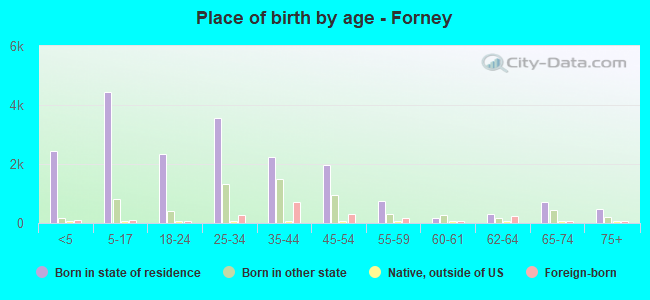
Place of birth - Born in state of residence (%)
Place of birth - Born in state of residence (%) - White
Place of birth - Born in state of residence (%) - Black or African American
Place of birth - Born in state of residence (%) - Asian
Place of birth - Born in state of residence (%) - Hispanic or Latino
Place of birth - Born in state of residence (%) - American Indian and Alaska Native
Place of birth - Born in state of residence (%) - Multirace
Place of birth - Born in state of residence (%) - Other Race
Place of birth - Born in other state (%)
Place of birth - Born in other state (%) - White
Place of birth - Born in other state (%) - Black or African American
Place of birth - Born in other state (%) - Asian
Place of birth - Born in other state (%) - Hispanic or Latino
Place of birth - Born in other state (%) - American Indian and Alaska Native
Place of birth - Born in other state (%) - Multirace
Place of birth - Born in other state (%) - Other Race
Place of birth - Native, outside of US (%)
Place of birth - Native, outside of US (%) - White
Place of birth - Native, outside of US (%) - Black or African American
Place of birth - Native, outside of US (%) - Asian
Place of birth - Native, outside of US (%) - Hispanic or Latino
Place of birth - Native, outside of US (%) - American Indian and Alaska Native
Place of birth - Native, outside of US (%) - Multirace
Place of birth - Native, outside of US (%) - Other Race
Place of birth - Foreign born (%)
Place of birth - Foreign born (%) - White
Place of birth - Foreign born (%) - Black or African American
Place of birth - Foreign born (%) - Asian
Place of birth - Foreign born (%) - Hispanic or Latino
Place of birth - Foreign born (%) - American Indian and Alaska Native
Place of birth - Foreign born (%) - Multirace
Place of birth - Foreign born (%) - Other Race
Residents speaking English at home (%)
Residents speaking English at home - Born in the United States (%)
Residents speaking English at home - Native, born elsewhere (%)
Residents speaking English at home - Foreign born (%)
Residents speaking Spanish at home (%)
Residents speaking Spanish at home - Born in the United States (%)
Residents speaking Spanish at home - Native, born elsewhere (%)
Residents speaking Spanish at home - Foreign born (%)
Residents speaking other language at home (%)
Residents speaking other language at home - Born in the United States (%)
Residents speaking other language at home - Native, born elsewhere (%)
Residents speaking other language at home - Foreign born (%)
Marital status - Never married (%)
Marital status - Now married (%)
Marital status - Separated (%)
Marital status - Widowed (%)
Marital status - Divorced (%)
Ancestries Reported - Arab (%)
Ancestries Reported - Czech (%)
Ancestries Reported - Danish (%)
Ancestries Reported - Dutch (%)
Ancestries Reported - English (%)
Ancestries Reported - French (%)
Ancestries Reported - French Canadian (%)
Ancestries Reported - German (%)
Ancestries Reported - Greek (%)
Ancestries Reported - Hungarian (%)
Ancestries Reported - Irish (%)
Ancestries Reported - Italian (%)
Ancestries Reported - Lithuanian (%)
Ancestries Reported - Norwegian (%)
Ancestries Reported - Polish (%)
Ancestries Reported - Portuguese (%)
Ancestries Reported - Russian (%)
Ancestries Reported - Scotch-Irish (%)
Ancestries Reported - Scottish (%)
Ancestries Reported - Slovak (%)
Ancestries Reported - Subsaharan African (%)
Ancestries Reported - Swedish (%)
Ancestries Reported - Swiss (%)
Ancestries Reported - Ukrainian (%)
Ancestries Reported - United States (%)
Ancestries Reported - Welsh (%)
Ancestries Reported - West Indian (%)
Ancestries Reported - Other (%)
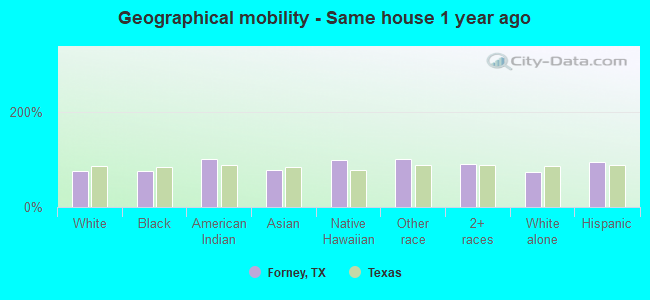
Geographical mobility - Same house 1 year ago (%)
Geographical mobility - Same house 1 year ago (%) - White
Geographical mobility - Same house 1 year ago (%) - Black or African American
Geographical mobility - Same house 1 year ago (%) - Asian
Geographical mobility - Same house 1 year ago (%) - Hispanic or Latino
Geographical mobility - Same house 1 year ago (%) - American Indian and Alaska Native
Geographical mobility - Same house 1 year ago (%) - Multirace
Geographical mobility - Same house 1 year ago (%) - Other Race
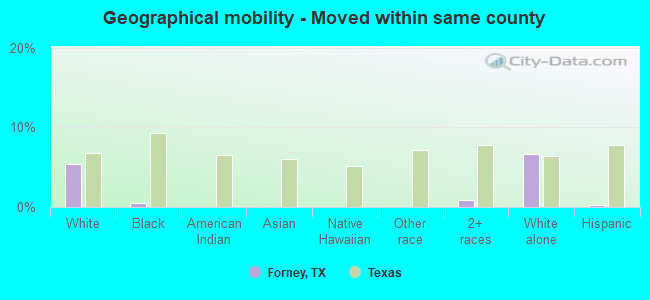
Geographical mobility - Moved within same county (%)
Geographical mobility - Moved within same county (%) - White
Geographical mobility - Moved within same county (%) - Black or African American
Geographical mobility - Moved within same county (%) - Asian
Geographical mobility - Moved within same county (%) - Hispanic or Latino
Geographical mobility - Moved within same county (%) - American Indian and Alaska Native
Geographical mobility - Moved within same county (%) - Multirace
Geographical mobility - Moved within same county (%) - Other Race
Geographical mobility - Moved from different county within same state (%)
Geographical mobility - Moved from different county within same state (%) - White
Geographical mobility - Moved from different county within same state (%) - Black or African American
Geographical mobility - Moved from different county within same state (%) - Asian
Geographical mobility - Moved from different county within same state (%) - Hispanic or Latino
Geographical mobility - Moved from different county within same state (%) - American Indian and Alaska Native
Geographical mobility - Moved from different county within same state (%) - Multirace
Geographical mobility - Moved from different county within same state (%) - Other Race
Geographical mobility - Moved from different state (%)
Geographical mobility - Moved from different state (%) - White
Geographical mobility - Moved from different state (%) - Black or African American
Geographical mobility - Moved from different state (%) - Asian
Geographical mobility - Moved from different state (%) - Hispanic or Latino
Geographical mobility - Moved from different state (%) - American Indian and Alaska Native
Geographical mobility - Moved from different state (%) - Multirace
Geographical mobility - Moved from different state (%) - Other Race
Geographical mobility - Moved from abroad (%)
Geographical mobility - Moved from abroad (%) - White
Geographical mobility - Moved from abroad (%) - Black or African American
Geographical mobility - Moved from abroad (%) - Asian
Geographical mobility - Moved from abroad (%) - Hispanic or Latino
Geographical mobility - Moved from abroad (%) - American Indian and Alaska Native
Geographical mobility - Moved from abroad (%) - Multirace
Geographical mobility - Moved from abroad (%) - Other Race
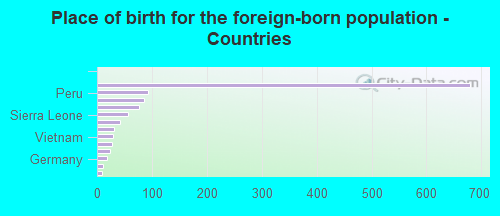
Place of birth for the foreign-born population - Ireland (%)
Place of birth for the foreign-born population - Denmark (%)
Place of birth for the foreign-born population - Norway (%)
Place of birth for the foreign-born population - Sweden (%)
Place of birth for the foreign-born population - United Kingdom (%)
Place of birth for the foreign-born population - England (%)
Place of birth for the foreign-born population - Scotland (%)
Place of birth for the foreign-born population - Other Northern Europe (%)
Place of birth for the foreign-born population - Austria (%)
Place of birth for the foreign-born population - Belgium (%)
Place of birth for the foreign-born population - France (%)
Place of birth for the foreign-born population - Germany (%)
Place of birth for the foreign-born population - Netherlands (%)
Place of birth for the foreign-born population - Switzerland (%)
Place of birth for the foreign-born population - Other Western Europe (%)
Place of birth for the foreign-born population - Greece (%)
Place of birth for the foreign-born population - Italy (%)
Place of birth for the foreign-born population - Portugal (%)
Place of birth for the foreign-born population - Spain (%)
Place of birth for the foreign-born population - Other Southern Europe (%)
Place of birth for the foreign-born population - Albania (%)
Place of birth for the foreign-born population - Belarus (%)
Place of birth for the foreign-born population - Bosnia and Herzegovina (%)
Place of birth for the foreign-born population - Bulgaria (%)
Place of birth for the foreign-born population - Croatia (%)
Place of birth for the foreign-born population - Czechoslovakia (%)
Place of birth for the foreign-born population - Hungary (%)
Place of birth for the foreign-born population - Latvia (%)
Place of birth for the foreign-born population - Lithuania (%)
Place of birth for the foreign-born population - North Macedonia (Macedonia) (%)
Place of birth for the foreign-born population - Moldova (%)
Place of birth for the foreign-born population - Poland (%)
Place of birth for the foreign-born population - Romania (%)
Place of birth for the foreign-born population - Russia (%)
Place of birth for the foreign-born population - Serbia (%)
Place of birth for the foreign-born population - Ukraine (%)
Place of birth for the foreign-born population - Other Eastern Europe (%)
Place of birth for the foreign-born population - China (%)
Place of birth for the foreign-born population - Hong Kong (%)
Place of birth for the foreign-born population - Taiwan (%)
Place of birth for the foreign-born population - Japan (%)
Place of birth for the foreign-born population - Korea (%)
Place of birth for the foreign-born population - Other Eastern Asia (%)
Place of birth for the foreign-born population - Afghanistan (%)
Place of birth for the foreign-born population - Bangladesh (%)
Place of birth for the foreign-born population - India (%)
Place of birth for the foreign-born population - Iran (%)
Place of birth for the foreign-born population - Kazakhstan (%)
Place of birth for the foreign-born population - Nepal (%)
Place of birth for the foreign-born population - Pakistan (%)
Place of birth for the foreign-born population - Sri Lanka (%)
Place of birth for the foreign-born population - Uzbekistan (%)
Place of birth for the foreign-born population - Other South Central Asia (%)
Place of birth for the foreign-born population - Burma (%)
Place of birth for the foreign-born population - Cambodia (%)
Place of birth for the foreign-born population - Indonesia (%)
Place of birth for the foreign-born population - Laos (%)
Place of birth for the foreign-born population - Malaysia (%)
Place of birth for the foreign-born population - Philippines (%)
Place of birth for the foreign-born population - Singapore (%)
Place of birth for the foreign-born population - Thailand (%)
Place of birth for the foreign-born population - Vietnam (%)
Place of birth for the foreign-born population - Other South Eastern Asia (%)
Place of birth for the foreign-born population - Armenia (%)
Place of birth for the foreign-born population - Iraq (%)
Place of birth for the foreign-born population - Israel (%)
Place of birth for the foreign-born population - Jordan (%)
Place of birth for the foreign-born population - Kuwait (%)
Place of birth for the foreign-born population - Lebanon (%)
Place of birth for the foreign-born population - Saudi Arabia (%)
Place of birth for the foreign-born population - Syria (%)
Place of birth for the foreign-born population - Turkey (%)
Place of birth for the foreign-born population - Yemen (%)
Place of birth for the foreign-born population - Other Western Asia (%)
Place of birth for the foreign-born population - Eritrea (%)
Place of birth for the foreign-born population - Ethiopia (%)
Place of birth for the foreign-born population - Kenya (%)
Place of birth for the foreign-born population - Somalia (%)
Place of birth for the foreign-born population - Uganda (%)
Place of birth for the foreign-born population - Zimbabwe (%)
Place of birth for the foreign-born population - Other Eastern Africa (%)
Place of birth for the foreign-born population - Cameroon (%)
Place of birth for the foreign-born population - Congo (%)
Place of birth for the foreign-born population - Democratic Republic of Congo (Zaire) (%)
Place of birth for the foreign-born population - Other Middle Africa (%)
Place of birth for the foreign-born population - Egypt (%)
Place of birth for the foreign-born population - Morocco (%)
Place of birth for the foreign-born population - Sudan (%)
Place of birth for the foreign-born population - Other Northern Africa (%)
Place of birth for the foreign-born population - South Africa (%)
Place of birth for the foreign-born population - Other Southern Africa (%)
Place of birth for the foreign-born population - Cabo Verde (%)
Place of birth for the foreign-born population - Ghana (%)
Place of birth for the foreign-born population - Liberia (%)
Place of birth for the foreign-born population - Nigeria (%)
Place of birth for the foreign-born population - Senegal (%)
Place of birth for the foreign-born population - Sierra Leone (%)
Place of birth for the foreign-born population - Other Western Africa (%)
Place of birth for the foreign-born population - Australia (%)
Place of birth for the foreign-born population - New Zealand (%)
Place of birth for the foreign-born population - Fiji (%)
Place of birth for the foreign-born population - Micronesia (%)
Place of birth for the foreign-born population - Bahamas (%)
Place of birth for the foreign-born population - Barbados (%)
Place of birth for the foreign-born population - Cuba (%)
Place of birth for the foreign-born population - Dominica (%)
Place of birth for the foreign-born population - Dominican Republic (%)
Place of birth for the foreign-born population - Grenada (%)
Place of birth for the foreign-born population - Haiti (%)
Place of birth for the foreign-born population - Jamaica (%)
Place of birth for the foreign-born population - St. Vincent and the Grenadines (%)
Place of birth for the foreign-born population - Trinidad and Tobago (%)
Place of birth for the foreign-born population - West Indies (%)
Place of birth for the foreign-born population - Other Caribbean (%)
Place of birth for the foreign-born population - Belize (%)
Place of birth for the foreign-born population - Costa Rica (%)
Place of birth for the foreign-born population - El Salvador (%)
Place of birth for the foreign-born population - Guatemala (%)
Place of birth for the foreign-born population - Honduras (%)
Place of birth for the foreign-born population - Mexico (%)
Place of birth for the foreign-born population - Nicaragua (%)
Place of birth for the foreign-born population - Panama (%)
Place of birth for the foreign-born population - Other Central America (%)
Place of birth for the foreign-born population - Argentina (%)
Place of birth for the foreign-born population - Bolivia (%)
Place of birth for the foreign-born population - Brazil (%)
Place of birth for the foreign-born population - Chile (%)
Place of birth for the foreign-born population - Colombia (%)
Place of birth for the foreign-born population - Ecuador (%)
Place of birth for the foreign-born population - Guyana (%)
Place of birth for the foreign-born population - Peru (%)
Place of birth for the foreign-born population - Uruguay (%)
Place of birth for the foreign-born population - Venezuela (%)
Place of birth for the foreign-born population - Other South America (%)
Place of birth for the foreign-born population - Canada (%)
Place of birth for the foreign-born population - Other Northern America (%)
Place of birth for the foreign-born population - Other (%)
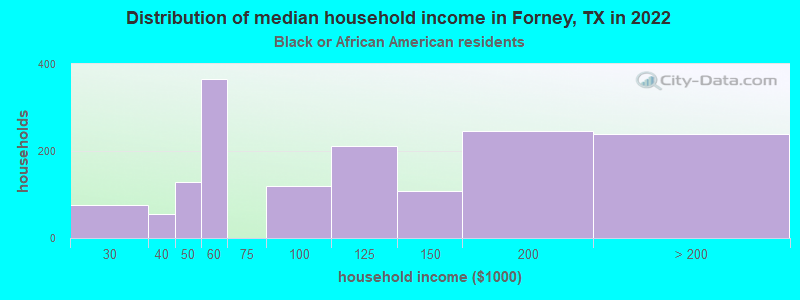
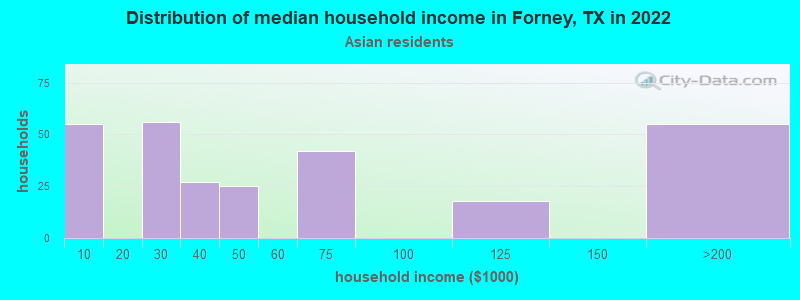
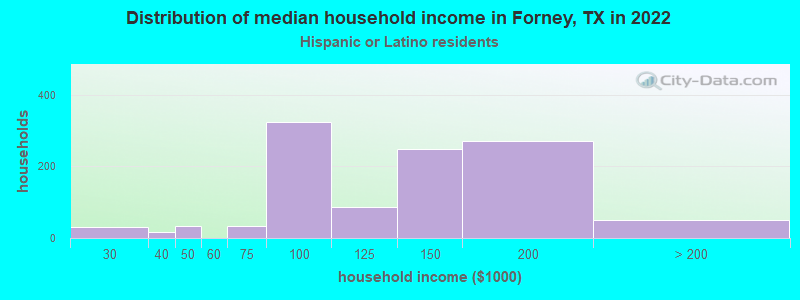
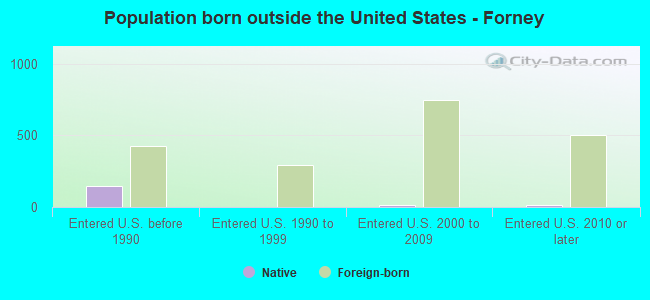
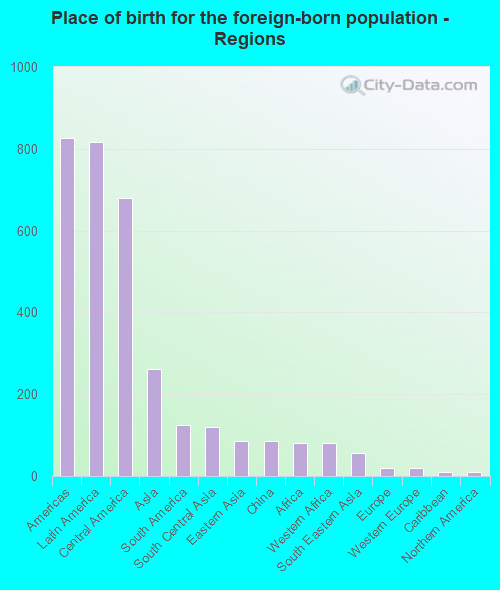
According to 2022 data, the most numerous races in Forney, TX are Hispanic (5,711 residents), White alone (15,626 residents), and Black alone (5,338 residents). 84.6% of Forney residents speak English at home. 4.1% of Forney, TX residents are foreign-born (3.1% born in Latin America, 1.0% born in Asia), which is 315.8% less than the foreign-born rate of 17.0% across the entire state of Texas.
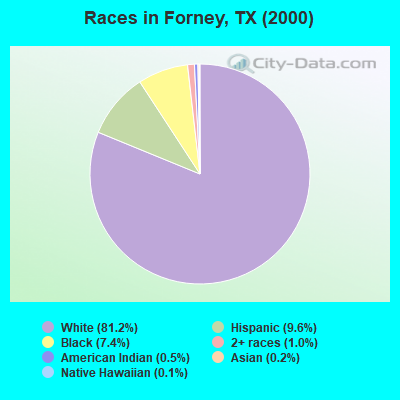
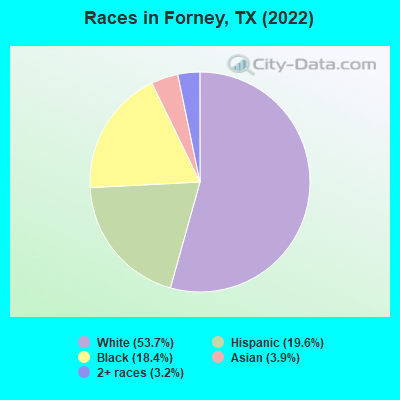
Race distribution in Forney
2000 2022
10,933,313 52.4% White alone 6,669,666 32.0% Hispanic 2,364,255 11.3% Black alone 554,445 2.7% Asian alone 230,567 1.1% Two or more races 68,859 0.3% American Indian alone 19,958 0.10% Other race alone 10,757 0.05% Native Hawaiian and Other
12,070,642 40.2% Hispanic 11,683,430 38.9% White alone 3,508,706 11.7% Black alone 1,608,173 5.4% Asian alone 956,560 3.2% Two or more races 125,763 0.4% Other race alone 47,023 0.2% American Indian alone 29,275 0.10% Native Hawaiian and Other
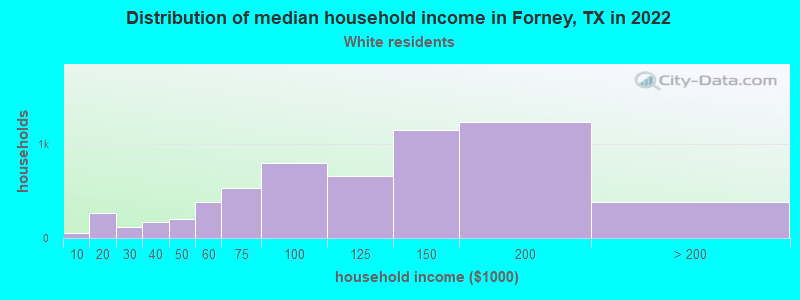
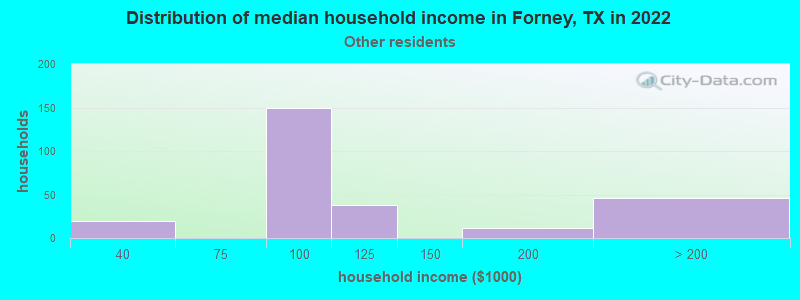
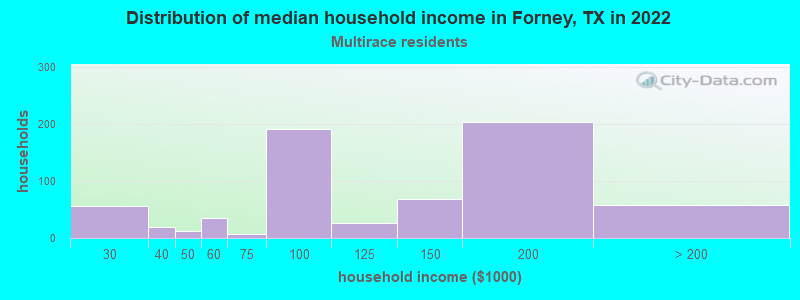
Income and house value in Forney Median household income in 2022 $112,612 White non-Hispanic householders$123,912 Black householders$26,805 Asian householders$81,264 Some other race householders$125,385 Two or more races householders$144,249 Hispanic or Latino race householdersMedian 2022 house value $357,564 White Non-Hispanic householders$337,636 Black or African American householders$364,079 American Indian or Alaska Native householders $431,147 Asian householders$323,456 Some other race householders$503,196 Two or more races householders$326,905 Hispanic or Latino householders
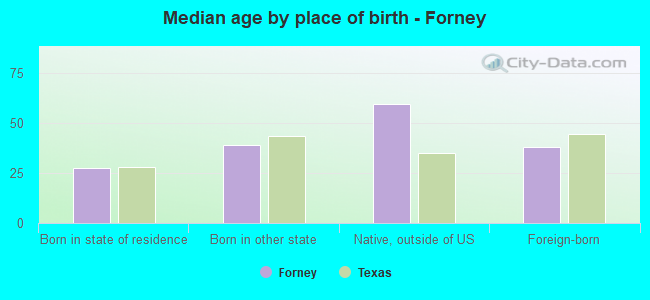
Median age by race in Forney
33.6 Median age for White residents30.9 36.4 33.8 Median age for Black or African American residents32.0 35.3 -684,418,145.3 Median age for American Indian / Alaska Native residents-682,445,758.7 -684,418,145.3 24.8 Median age for Asian residents32.4 12.8 -581,560,283.1 Median age for Native Hawaiian / Pacific Islander residents-666,666,666.0 -577,777,777.2 26.3 Median age for Other race residents24.3 42.5 22.9 Median age for Two or more races residents19.6 23.8 35.1 Median age for White alone residents32.1 37.0 22.5 Median age for Hispanic or Latino residents23.0 23.7
Owner/renter occupied households by race in Forney
House owners and renters - White residents 4,335 73.3% Owner occupied1,579 26.7% Renter occupiedHouse owners and renters - Black or African American residents 926 62.9% Owner occupied546 37.1% Renter occupiedHouse owners and renters - Asian residents 171 59.3% Owner occupied117 40.7% Renter occupiedHouse owners and renters - Native Hawaiian / Pacific Islander residents 40 100.0% Owner occupiedHouse owners and renters - Other race residents 293 100.0% Owner occupiedHouse owners and renters - Two or more races residents 562 89.0% Owner occupied69 11.0% Renter occupiedHouse owners and renters - White alone residents 4,222 70.8% Owner occupied1,744 29.2% Renter occupiedHouse owners and renters - Hispanic or Latino residents 935 98.5% Owner occupied14 1.5% Renter occupied
Language usage in Forney
English speakers - Total 84.6% of residents of Forney speak English at home.
9.3% of residents speak Spanish at home 1,849 75.3% Speak English very well605 24.7% Speak English less than very well3.6% of residents speak other language at home 640 68.2% Speak English very well299 31.8% Speak English less than very well
English speakers - Born in the United States 94.6% of residents of Forney speak English at home.
2.0% of residents speak Spanish at home 121 96.0% Speak English very well5 4.0% Speak English less than very well2.9% of residents speak other language at home 183 100.0% Speak English very well
English speakers - Native, born elsewhere 61.2% of residents of Forney speak English at home.
English speakers - Foreign-born 14.7% of residents of Forney speak English at home.
59.9% of residents speak Spanish at home 535 46.2% Speak English very well624 53.8% Speak English less than very well26.6% of residents speak other language at home 176 34.2% Speak English very well339 65.8% Speak English less than very well
White (Caucasian) - Speak only English Native:
100.0% (14,919)Foreign-born:
3.5% (6)
White (Caucasian) - Speak another language Native:
2.0% (304)Foreign-born:
98.7% (180)
Black or African American - Speak only English Native:
99.3% (4,432)Foreign-born:
5.5% (10)
Black or African American - Speak another language Native:
1.2% (54)Foreign-born:
58.7% (107)
Asian - Speak only English Native:
52.0% (602)Foreign-born:
39.8% (111)
Asian - Speak another language Native:
48.2% (558)Foreign-born:
61.7% (171)
Other race - Speak only English Native:
19.0% (121)Foreign-born:
28.8% (42)
Other race - Speak another language Native:
81.0% (516)Foreign-born:
73.1% (107)
Two or more races - Speak only English Native:
75.7% (1,486)Foreign-born:
5.7% (53)
Two or more races - Speak another language Native:
18.9% (371)Foreign-born:
94.7% (882)
White alone - Speak only English Native:
98.8% (13,915)Foreign-born:
13.3% (13)
White alone - Speak another language Native:
1.0% (146)Foreign-born:
89.6% (85)
Hispanic or Latino - Speak only English Native:
61.4% (2,247)Foreign-born:
7.0% (77)
Hispanic or Latino - Speak another language Native:
35.0% (1,280)Foreign-born:
92.8% (1,011)
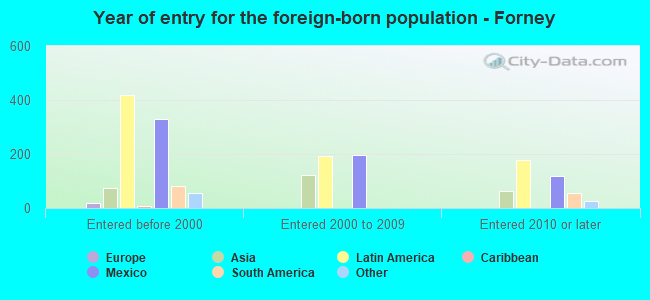
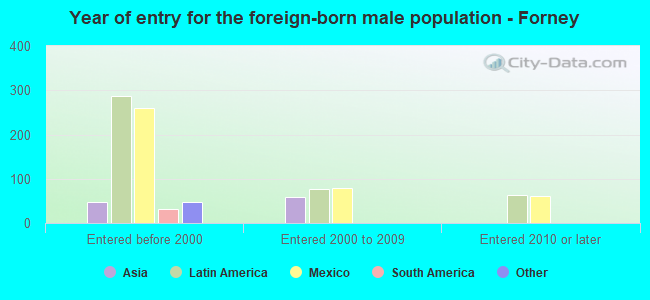
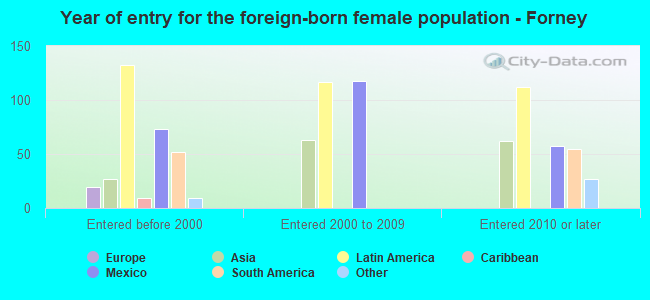
Foreign-born residents in Forney 1,189 residents are foreign born (3.1% Latin America , 1.0% Asia ).
This city:
4.1%Texas:
17.1%
Marital status for residents in Forney Marital status - White (Caucasian) population 15 years and over
Males 28.7% Never married55.3% Now married0.0% Separated2.7% Widowed13.3% DivorcedFemales 26.3% Never married57.2% Now married0.3% Separated4.2% Widowed12.0% DivorcedWomen who gave birth in the past 12 months Now married:
84.7% (237)Unmarried:
15.3% (43)
Women who did not give birth in the past 12 months Now married:
55.5% (2,312)Unmarried:
44.5% (1,851)
Marital status - Black or African American population 15 years and over
Males 23.6% Never married62.6% Now married0.0% Separated0.0% Widowed13.8% DivorcedFemales 47.0% Never married41.9% Now married0.0% Separated4.6% Widowed6.5% DivorcedWomen who gave birth in the past 12 months Now married:
29.4% (58)Unmarried:
70.6% (140)
Women who did not give birth in the past 12 months Now married:
38.8% (498)Unmarried:
61.2% (784)
Marital status - Asian population 15 years and over
Males 44.1% Never married55.9% Now married0.0% Separated0.0% Widowed0.0% DivorcedFemales 63.5% Never married36.5% Now married0.0% Separated0.0% Widowed0.0% DivorcedWomen who gave birth in the past 12 months Now married:
0.0% (0)Unmarried:
100.0% (76)
Women who did not give birth in the past 12 months Now married:
41.2% (90)Unmarried:
58.8% (129)
Marital status - Other race population 15 years and over
Males 63.0% Never married21.0% Now married6.6% Separated0.0% Widowed9.3% DivorcedFemales 42.6% Never married44.6% Now married0.0% Separated0.0% Widowed12.7% DivorcedWomen who gave birth in the past 12 months Now married:
100.0% (54)Unmarried:
0.0% (0)
Women who did not give birth in the past 12 months Now married:
0.0% (0)Unmarried:
100.0% (233)
Marital status - Two or more races population 15 years and over
Males 42.9% Never married47.1% Now married0.0% Separated0.0% Widowed10.1% DivorcedFemales 39.9% Never married39.0% Now married0.0% Separated0.0% Widowed21.1% DivorcedWomen who did not give birth in the past 12 months Now married:
42.3% (301)Unmarried:
57.7% (410)
Marital status - White alone, not Hispanic / Latino population 15 years and over
Males 22.8% Never married58.8% Now married0.0% Separated3.1% Widowed15.3% DivorcedFemales 22.0% Never married59.5% Now married0.2% Separated4.8% Widowed13.5% DivorcedWomen who gave birth in the past 12 months Now married:
89.6% (227)Unmarried:
10.4% (26)
Women who did not give birth in the past 12 months Now married:
59.2% (2,307)Unmarried:
40.8% (1,592)
Marital status - Hispanic or Latino population 15 years and over
Males 59.4% Never married33.9% Now married1.0% Separated0.0% Widowed5.7% DivorcedFemales 53.3% Never married38.0% Now married0.6% Separated0.0% Widowed8.0% DivorcedWomen who gave birth in the past 12 months Now married:
75.3% (85)Unmarried:
24.7% (28)
Women who did not give birth in the past 12 months Now married:
32.0% (518)Unmarried:
68.0% (1,102)
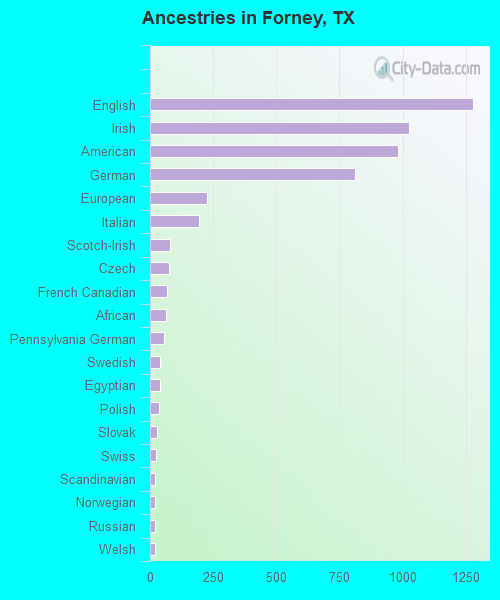
Ancestries in Forney
1,278 12.3% English1,026 9.9% Irish982 9.4% American813 7.8% German224 2.2% European194 1.9% Italian81 0.8% Scotch-Irish74 0.7% Czech66 0.6% French Canadian63 0.6% African56 0.5% Pennsylvania German41 0.4% Swedish38 0.4% Egyptian37 0.4% Polish27 0.3% Slovak25 0.2% Swiss21 0.2% Scandinavian19 0.2% Norwegian18 0.2% Russian18 0.2% Welsh9 0.09% Canadian7 0.07% British
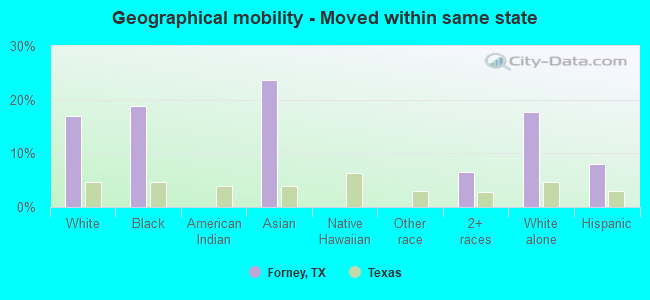
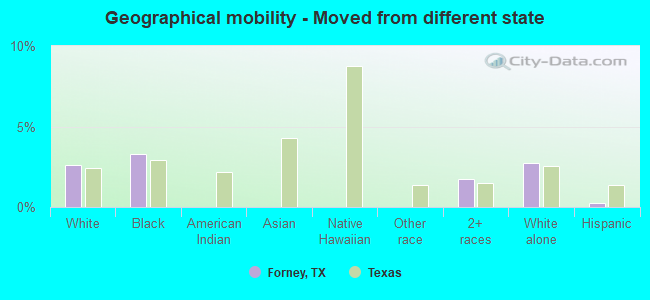
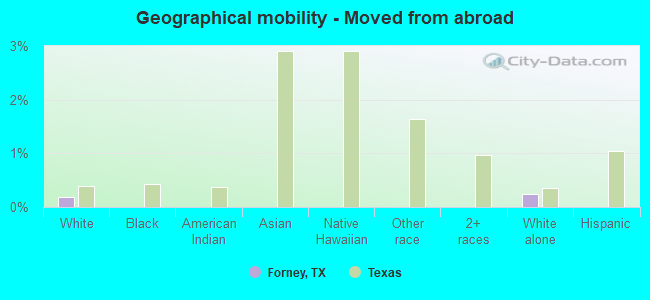
Geographical mobility in Forney Same house 1 year ago 12,399 76.4% White (Caucasian)3,905 75.1% Black or African American14 100.0% American Indian / Alaska Native649 77.6% Asian33 98.2% Native Hawaiian / Pacific Islander830 100.0% Other race2,704 90.9% Two or more races11,491 74.3% White alone, not Hispanic / Latino5,268 93.7% Hispanic or LatinoMoved within same county 865 5.3% White / Caucasian24 0.5% Black or African American27 0.9% Two or more races1,029 6.7% White alone, not Hispanic / Latino13 0.2% Hispanic or LatinoMoved within same state 2,745 16.9% White / Caucasian978 18.8% Black or African American198 23.7% Asian195 6.6% Two or more races2,752 17.8% White alone, not Hispanic / Latino447 7.9% Hispanic or LatinoMoved from different state 420 2.6% White / Caucasian172 3.3% Black or African American52 1.7% Two or more races419 2.7% White alone, not Hispanic / Latino13 0.2% Hispanic or LatinoMoved from abroad 29 0.2% White37 0.2% White alone, not Hispanic / Latino
Children Nativity (place of birth) in Forney
Children under 6 years - Living with two parents Both parents native 2,118 100.0% NativeBoth parents foreign-born 67 42.7% Native90 57.3% Foreign-bornOne native, one foreign-born parent 12 100.0% NativeChildren under 6 years - Living with one parent Native parent 725 100.0% NativeForeign-born parent 172 100.0% NativeChildren 6 to 17 years - Living with two parents Both parents native 2,523 100.0% Native0 0.0% Foreign-bornBoth parents foreign-born 297 94.8% Native16 5.2% Foreign-bornOne native, one foreign-born parent 21 100.0% NativeChildren 6 to 17 years - Living with one parent Native parent 1,419 100.0% NativeForeign-born parent 194 45.0% Native237 55.0% Foreign-born
Grandparents responsible for own grandchildren in Forney
Grandparents (30 to 59 years) White / Caucasian 27 19.8% Responsible for grandchildren108 80.2% Not responsible for grandchildrenBlack or African American 53 64.7% Responsible for grandchildren29 35.3% Not responsible for grandchildrenWhite alone, not Hispanic / Latino 14 10.8% Responsible for grandchildren117 89.2% Not responsible for grandchildrenGrandparents (60 years and over) White / Caucasian 26 17.1% Responsible for grandchildren127 82.9% Not responsible for grandchildrenBlack or African American 143 100.0% Not responsible for grandchildrenWhite alone, not Hispanic / Latino 31 16.9% Responsible for grandchildren150 83.1% Not responsible for grandchildren