Races in Fort Knox, Kentucky (KY) Detailed Stats
Data:
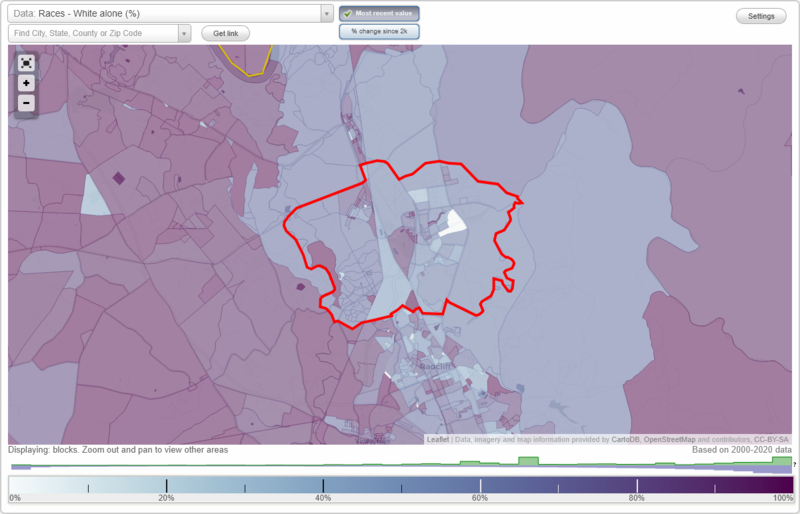
Races - White alone (%)
Races - White alone (% change since 2000)
Races - Black alone (%)
Races - Black alone (% change since 2000)
Races - American Indian alone (%)
Races - American Indian alone (% change since 2000)
Races - Asian alone (%)
Races - Asian alone (% change since 2000)
Races - Hispanic (%)
Races - Hispanic (% change since 2000)
Races - Native Hawaiian and Other Pacific Islander alone (%)
Races - Native Hawaiian and Other Pacific Islander alone (% change since 2000)
Races - Two or more races(%)
Races - Two or more races(% change since 2000)
Races - Other race alone (%)
Races - Other race alone (% change since 2000)
Racial diversity
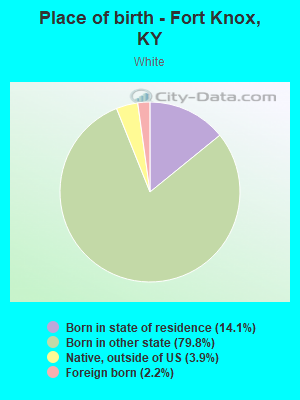
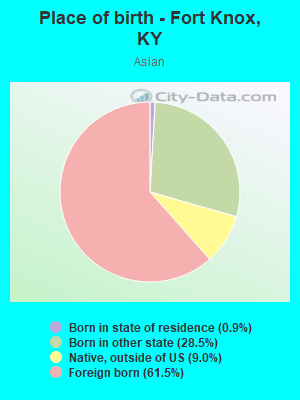
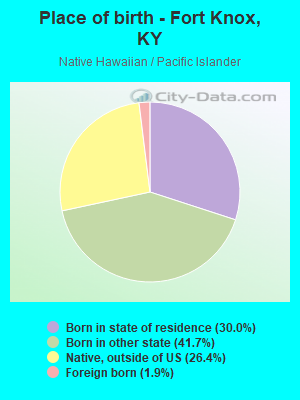
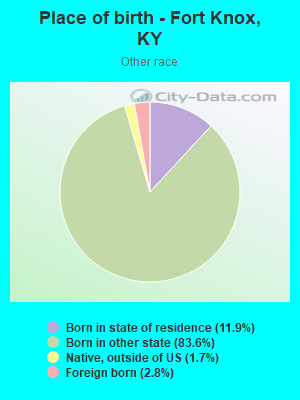
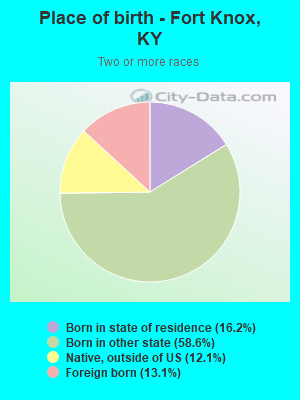
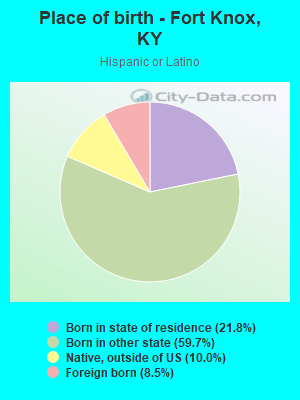
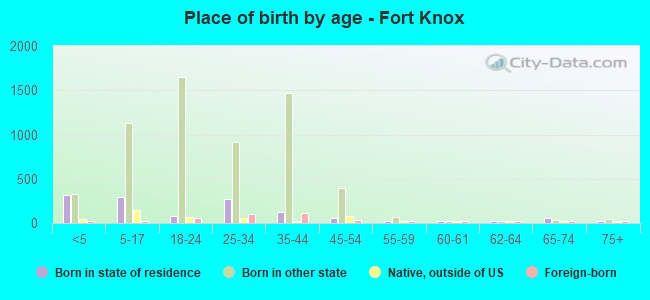
Place of birth - Born in state of residence (%)
Place of birth - Born in state of residence (%) - White
Place of birth - Born in state of residence (%) - Black or African American
Place of birth - Born in state of residence (%) - Asian
Place of birth - Born in state of residence (%) - Hispanic or Latino
Place of birth - Born in state of residence (%) - American Indian and Alaska Native
Place of birth - Born in state of residence (%) - Multirace
Place of birth - Born in state of residence (%) - Other Race
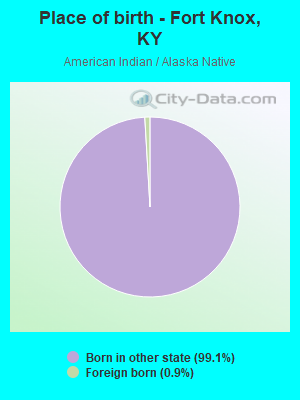
Place of birth - Born in other state (%)
Place of birth - Born in other state (%) - White
Place of birth - Born in other state (%) - Black or African American
Place of birth - Born in other state (%) - Asian
Place of birth - Born in other state (%) - Hispanic or Latino
Place of birth - Born in other state (%) - American Indian and Alaska Native
Place of birth - Born in other state (%) - Multirace
Place of birth - Born in other state (%) - Other Race
Place of birth - Native, outside of US (%)
Place of birth - Native, outside of US (%) - White
Place of birth - Native, outside of US (%) - Black or African American
Place of birth - Native, outside of US (%) - Asian
Place of birth - Native, outside of US (%) - Hispanic or Latino
Place of birth - Native, outside of US (%) - American Indian and Alaska Native
Place of birth - Native, outside of US (%) - Multirace
Place of birth - Native, outside of US (%) - Other Race
Place of birth - Foreign born (%)
Place of birth - Foreign born (%) - White
Place of birth - Foreign born (%) - Black or African American
Place of birth - Foreign born (%) - Asian
Place of birth - Foreign born (%) - Hispanic or Latino
Place of birth - Foreign born (%) - American Indian and Alaska Native
Place of birth - Foreign born (%) - Multirace
Place of birth - Foreign born (%) - Other Race
Residents speaking English at home (%)
Residents speaking English at home - Born in the United States (%)
Residents speaking English at home - Native, born elsewhere (%)
Residents speaking English at home - Foreign born (%)
Residents speaking Spanish at home (%)
Residents speaking Spanish at home - Born in the United States (%)
Residents speaking Spanish at home - Native, born elsewhere (%)
Residents speaking Spanish at home - Foreign born (%)
Residents speaking other language at home (%)
Residents speaking other language at home - Born in the United States (%)
Residents speaking other language at home - Native, born elsewhere (%)
Residents speaking other language at home - Foreign born (%)
Marital status - Never married (%)
Marital status - Now married (%)
Marital status - Separated (%)
Marital status - Widowed (%)
Marital status - Divorced (%)
Ancestries Reported - Arab (%)
Ancestries Reported - Czech (%)
Ancestries Reported - Danish (%)
Ancestries Reported - Dutch (%)
Ancestries Reported - English (%)
Ancestries Reported - French (%)
Ancestries Reported - French Canadian (%)
Ancestries Reported - German (%)
Ancestries Reported - Greek (%)
Ancestries Reported - Hungarian (%)
Ancestries Reported - Irish (%)
Ancestries Reported - Italian (%)
Ancestries Reported - Lithuanian (%)
Ancestries Reported - Norwegian (%)
Ancestries Reported - Polish (%)
Ancestries Reported - Portuguese (%)
Ancestries Reported - Russian (%)
Ancestries Reported - Scotch-Irish (%)
Ancestries Reported - Scottish (%)
Ancestries Reported - Slovak (%)
Ancestries Reported - Subsaharan African (%)
Ancestries Reported - Swedish (%)
Ancestries Reported - Swiss (%)
Ancestries Reported - Ukrainian (%)
Ancestries Reported - United States (%)
Ancestries Reported - Welsh (%)
Ancestries Reported - West Indian (%)
Ancestries Reported - Other (%)
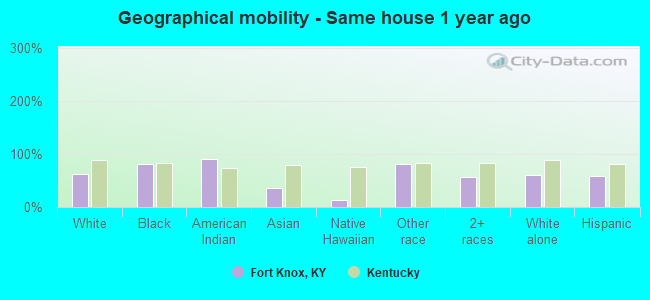
Geographical mobility - Same house 1 year ago (%)
Geographical mobility - Same house 1 year ago (%) - White
Geographical mobility - Same house 1 year ago (%) - Black or African American
Geographical mobility - Same house 1 year ago (%) - Asian
Geographical mobility - Same house 1 year ago (%) - Hispanic or Latino
Geographical mobility - Same house 1 year ago (%) - American Indian and Alaska Native
Geographical mobility - Same house 1 year ago (%) - Multirace
Geographical mobility - Same house 1 year ago (%) - Other Race
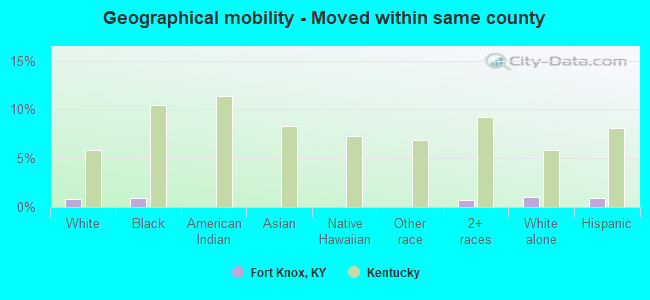
Geographical mobility - Moved within same county (%)
Geographical mobility - Moved within same county (%) - White
Geographical mobility - Moved within same county (%) - Black or African American
Geographical mobility - Moved within same county (%) - Asian
Geographical mobility - Moved within same county (%) - Hispanic or Latino
Geographical mobility - Moved within same county (%) - American Indian and Alaska Native
Geographical mobility - Moved within same county (%) - Multirace
Geographical mobility - Moved within same county (%) - Other Race
Geographical mobility - Moved from different county within same state (%)
Geographical mobility - Moved from different county within same state (%) - White
Geographical mobility - Moved from different county within same state (%) - Black or African American
Geographical mobility - Moved from different county within same state (%) - Asian
Geographical mobility - Moved from different county within same state (%) - Hispanic or Latino
Geographical mobility - Moved from different county within same state (%) - American Indian and Alaska Native
Geographical mobility - Moved from different county within same state (%) - Multirace
Geographical mobility - Moved from different county within same state (%) - Other Race
Geographical mobility - Moved from different state (%)
Geographical mobility - Moved from different state (%) - White
Geographical mobility - Moved from different state (%) - Black or African American
Geographical mobility - Moved from different state (%) - Asian
Geographical mobility - Moved from different state (%) - Hispanic or Latino
Geographical mobility - Moved from different state (%) - American Indian and Alaska Native
Geographical mobility - Moved from different state (%) - Multirace
Geographical mobility - Moved from different state (%) - Other Race
Geographical mobility - Moved from abroad (%)
Geographical mobility - Moved from abroad (%) - White
Geographical mobility - Moved from abroad (%) - Black or African American
Geographical mobility - Moved from abroad (%) - Asian
Geographical mobility - Moved from abroad (%) - Hispanic or Latino
Geographical mobility - Moved from abroad (%) - American Indian and Alaska Native
Geographical mobility - Moved from abroad (%) - Multirace
Geographical mobility - Moved from abroad (%) - Other Race
Place of birth for the foreign-born population - Ireland (%)
Place of birth for the foreign-born population - Denmark (%)
Place of birth for the foreign-born population - Norway (%)
Place of birth for the foreign-born population - Sweden (%)
Place of birth for the foreign-born population - United Kingdom (%)
Place of birth for the foreign-born population - England (%)
Place of birth for the foreign-born population - Scotland (%)
Place of birth for the foreign-born population - Other Northern Europe (%)
Place of birth for the foreign-born population - Austria (%)
Place of birth for the foreign-born population - Belgium (%)
Place of birth for the foreign-born population - France (%)
Place of birth for the foreign-born population - Germany (%)
Place of birth for the foreign-born population - Netherlands (%)
Place of birth for the foreign-born population - Switzerland (%)
Place of birth for the foreign-born population - Other Western Europe (%)
Place of birth for the foreign-born population - Greece (%)
Place of birth for the foreign-born population - Italy (%)
Place of birth for the foreign-born population - Portugal (%)
Place of birth for the foreign-born population - Spain (%)
Place of birth for the foreign-born population - Other Southern Europe (%)
Place of birth for the foreign-born population - Albania (%)
Place of birth for the foreign-born population - Belarus (%)
Place of birth for the foreign-born population - Bosnia and Herzegovina (%)
Place of birth for the foreign-born population - Bulgaria (%)
Place of birth for the foreign-born population - Croatia (%)
Place of birth for the foreign-born population - Czechoslovakia (%)
Place of birth for the foreign-born population - Hungary (%)
Place of birth for the foreign-born population - Latvia (%)
Place of birth for the foreign-born population - Lithuania (%)
Place of birth for the foreign-born population - North Macedonia (Macedonia) (%)
Place of birth for the foreign-born population - Moldova (%)
Place of birth for the foreign-born population - Poland (%)
Place of birth for the foreign-born population - Romania (%)
Place of birth for the foreign-born population - Russia (%)
Place of birth for the foreign-born population - Serbia (%)
Place of birth for the foreign-born population - Ukraine (%)
Place of birth for the foreign-born population - Other Eastern Europe (%)
Place of birth for the foreign-born population - China (%)
Place of birth for the foreign-born population - Hong Kong (%)
Place of birth for the foreign-born population - Taiwan (%)
Place of birth for the foreign-born population - Japan (%)
Place of birth for the foreign-born population - Korea (%)
Place of birth for the foreign-born population - Other Eastern Asia (%)
Place of birth for the foreign-born population - Afghanistan (%)
Place of birth for the foreign-born population - Bangladesh (%)
Place of birth for the foreign-born population - India (%)
Place of birth for the foreign-born population - Iran (%)
Place of birth for the foreign-born population - Kazakhstan (%)
Place of birth for the foreign-born population - Nepal (%)
Place of birth for the foreign-born population - Pakistan (%)
Place of birth for the foreign-born population - Sri Lanka (%)
Place of birth for the foreign-born population - Uzbekistan (%)
Place of birth for the foreign-born population - Other South Central Asia (%)
Place of birth for the foreign-born population - Burma (%)
Place of birth for the foreign-born population - Cambodia (%)
Place of birth for the foreign-born population - Indonesia (%)
Place of birth for the foreign-born population - Laos (%)
Place of birth for the foreign-born population - Malaysia (%)
Place of birth for the foreign-born population - Philippines (%)
Place of birth for the foreign-born population - Singapore (%)
Place of birth for the foreign-born population - Thailand (%)
Place of birth for the foreign-born population - Vietnam (%)
Place of birth for the foreign-born population - Other South Eastern Asia (%)
Place of birth for the foreign-born population - Armenia (%)
Place of birth for the foreign-born population - Iraq (%)
Place of birth for the foreign-born population - Israel (%)
Place of birth for the foreign-born population - Jordan (%)
Place of birth for the foreign-born population - Kuwait (%)
Place of birth for the foreign-born population - Lebanon (%)
Place of birth for the foreign-born population - Saudi Arabia (%)
Place of birth for the foreign-born population - Syria (%)
Place of birth for the foreign-born population - Turkey (%)
Place of birth for the foreign-born population - Yemen (%)
Place of birth for the foreign-born population - Other Western Asia (%)
Place of birth for the foreign-born population - Eritrea (%)
Place of birth for the foreign-born population - Ethiopia (%)
Place of birth for the foreign-born population - Kenya (%)
Place of birth for the foreign-born population - Somalia (%)
Place of birth for the foreign-born population - Uganda (%)
Place of birth for the foreign-born population - Zimbabwe (%)
Place of birth for the foreign-born population - Other Eastern Africa (%)
Place of birth for the foreign-born population - Cameroon (%)
Place of birth for the foreign-born population - Congo (%)
Place of birth for the foreign-born population - Democratic Republic of Congo (Zaire) (%)
Place of birth for the foreign-born population - Other Middle Africa (%)
Place of birth for the foreign-born population - Egypt (%)
Place of birth for the foreign-born population - Morocco (%)
Place of birth for the foreign-born population - Sudan (%)
Place of birth for the foreign-born population - Other Northern Africa (%)
Place of birth for the foreign-born population - South Africa (%)
Place of birth for the foreign-born population - Other Southern Africa (%)
Place of birth for the foreign-born population - Cabo Verde (%)
Place of birth for the foreign-born population - Ghana (%)
Place of birth for the foreign-born population - Liberia (%)
Place of birth for the foreign-born population - Nigeria (%)
Place of birth for the foreign-born population - Senegal (%)
Place of birth for the foreign-born population - Sierra Leone (%)
Place of birth for the foreign-born population - Other Western Africa (%)
Place of birth for the foreign-born population - Australia (%)
Place of birth for the foreign-born population - New Zealand (%)
Place of birth for the foreign-born population - Fiji (%)
Place of birth for the foreign-born population - Micronesia (%)
Place of birth for the foreign-born population - Bahamas (%)
Place of birth for the foreign-born population - Barbados (%)
Place of birth for the foreign-born population - Cuba (%)
Place of birth for the foreign-born population - Dominica (%)
Place of birth for the foreign-born population - Dominican Republic (%)
Place of birth for the foreign-born population - Grenada (%)
Place of birth for the foreign-born population - Haiti (%)
Place of birth for the foreign-born population - Jamaica (%)
Place of birth for the foreign-born population - St. Vincent and the Grenadines (%)
Place of birth for the foreign-born population - Trinidad and Tobago (%)
Place of birth for the foreign-born population - West Indies (%)
Place of birth for the foreign-born population - Other Caribbean (%)
Place of birth for the foreign-born population - Belize (%)
Place of birth for the foreign-born population - Costa Rica (%)
Place of birth for the foreign-born population - El Salvador (%)
Place of birth for the foreign-born population - Guatemala (%)
Place of birth for the foreign-born population - Honduras (%)
Place of birth for the foreign-born population - Mexico (%)
Place of birth for the foreign-born population - Nicaragua (%)
Place of birth for the foreign-born population - Panama (%)
Place of birth for the foreign-born population - Other Central America (%)
Place of birth for the foreign-born population - Argentina (%)
Place of birth for the foreign-born population - Bolivia (%)
Place of birth for the foreign-born population - Brazil (%)
Place of birth for the foreign-born population - Chile (%)
Place of birth for the foreign-born population - Colombia (%)
Place of birth for the foreign-born population - Ecuador (%)
Place of birth for the foreign-born population - Guyana (%)
Place of birth for the foreign-born population - Peru (%)
Place of birth for the foreign-born population - Uruguay (%)
Place of birth for the foreign-born population - Venezuela (%)
Place of birth for the foreign-born population - Other South America (%)
Place of birth for the foreign-born population - Canada (%)
Place of birth for the foreign-born population - Other Northern America (%)
Place of birth for the foreign-born population - Other (%)
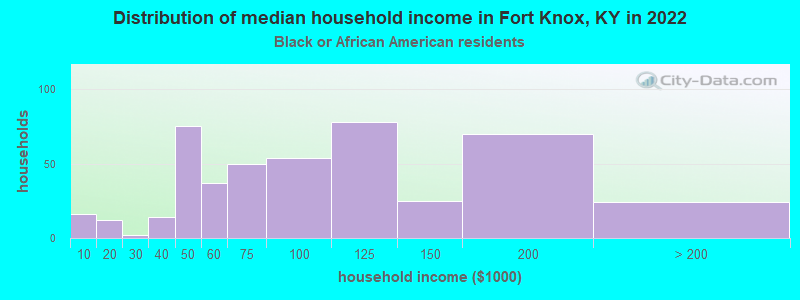
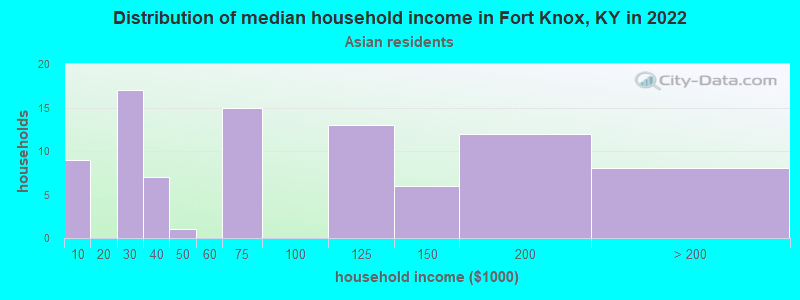
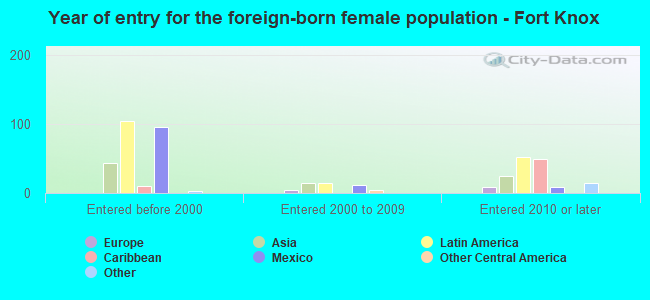
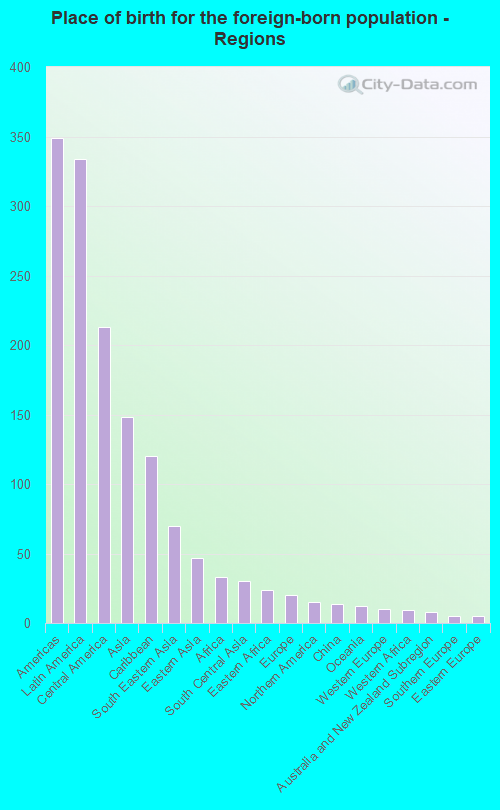
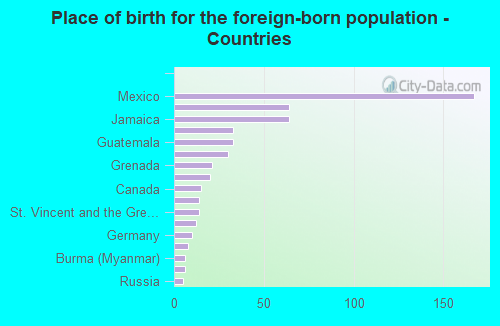
According to 2022 data, the most numerous races in Fort Knox, KY are White alone (4,217 residents), Black alone (1,094 residents), and Hispanic (2,376 residents). 82.5% of Fort Knox residents speak English at home. 6.5% of Fort Knox, KY residents are foreign-born (3.8% born in Latin America, 1.7% born in Asia), which is 38.3% greater than the foreign-born rate of 4.0% across the entire state of Kentucky.
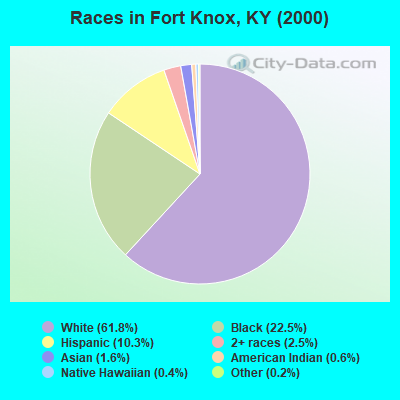
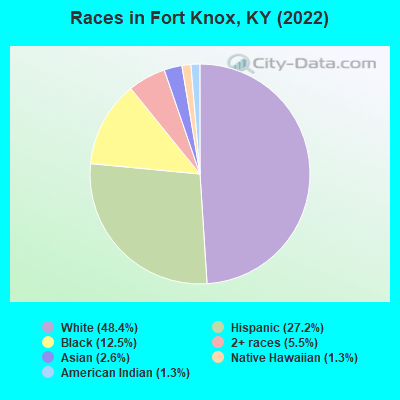
Race distribution in Fort Knox
2000 2022
3,608,013 89.3% White alone 293,639 7.3% Black alone 59,939 1.5% Hispanic 37,750 0.9% Two or more races 29,368 0.7% Asian alone 7,939 0.2% American Indian alone 3,846 0.10% Other race alone 1,275 0.03% Native Hawaiian and Other
3,710,998 82.2% White alone 343,194 7.6% Black alone 187,483 4.2% Hispanic 187,394 4.2% Two or more races 62,240 1.4% Asian alone 13,529 0.3% Other race alone 4,302 0.10% American Indian alone 3,170 0.07% Native Hawaiian and Other
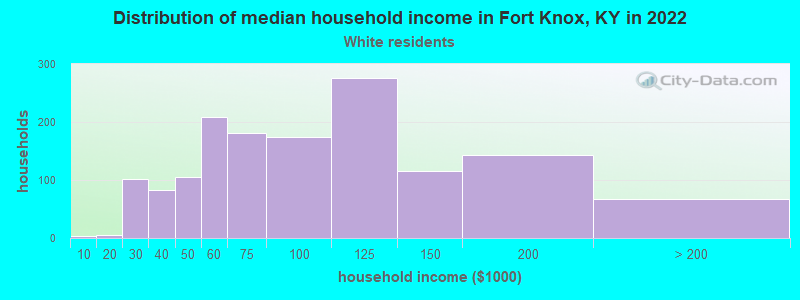
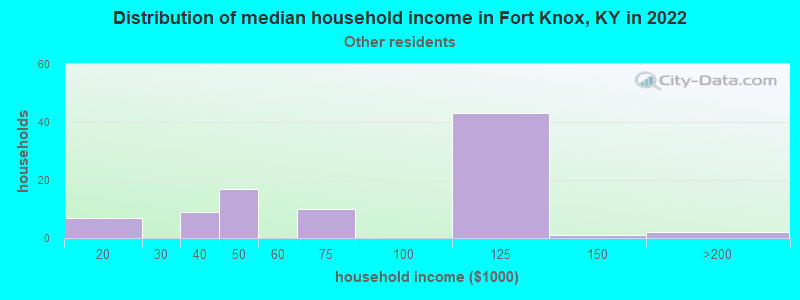
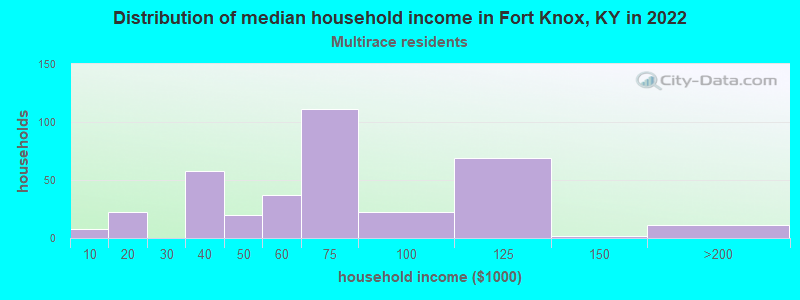
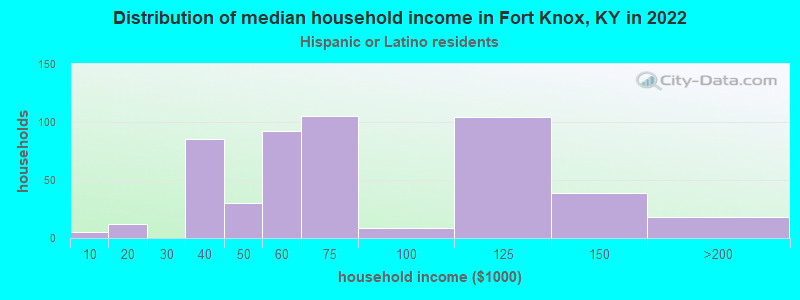
Income and house value in Fort Knox Median household income in 2022 $79,585 White non-Hispanic householders$74,767 Black householders$82,887 Two or more races householders$55,241 Hispanic or Latino race householdersMedian 2022 house value $-747,255,461 White Non-Hispanic householders$-124,542,576 Some other race householders$-124,542,576 Hispanic or Latino householders
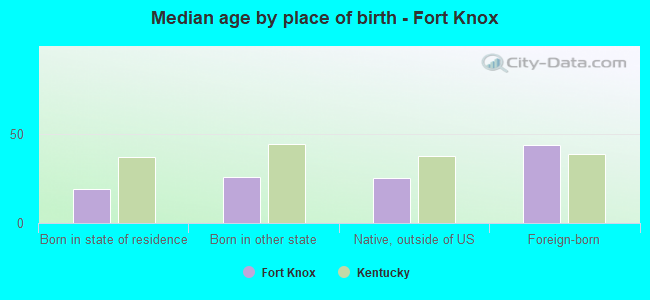
Median age by race in Fort Knox
27.3 Median age for White residents25.3 28.5 26.9 Median age for Black or African American residents32.3 25.0 17.3 Median age for American Indian / Alaska Native residents19.0 -630,065,358.8 28.9 Median age for Asian residents16.9 59.0 6.8 Median age for Native Hawaiian / Pacific Islander residents6.9 50.1 7.2 Median age for Other race residents24.1 4.1 31.4 Median age for Two or more races residents27.5 31.7 27.6 Median age for White alone residents25.7 30.9 19.8 Median age for Hispanic or Latino residents20.6 19.7
Owner/renter occupied households by race in Fort Knox
House owners and renters - White residents 16 1.1% Owner occupied1,438 98.9% Renter occupiedHouse owners and renters - Black or African American residents 343 100.0% Renter occupiedHouse owners and renters - American Indian / Alaska Native residents 1 100.0% Renter occupiedHouse owners and renters - Asian residents 59 100.0% Renter occupiedHouse owners and renters - Native Hawaiian / Pacific Islander residents 2 100.0% Renter occupiedHouse owners and renters - Other race residents 87 100.0% Renter occupiedHouse owners and renters - Two or more races residents 291 100.0% Renter occupiedHouse owners and renters - White alone residents 16 1.3% Owner occupied1,227 98.7% Renter occupiedHouse owners and renters - Hispanic or Latino residents 495 100.0% Renter occupied
Language usage in Fort Knox
English speakers - Total 82.5% of residents of Fort Knox speak English at home.
10.1% of residents speak Spanish at home 625 79.5% Speak English very well161 20.5% Speak English less than very well4.5% of residents speak other language at home 300 86.2% Speak English very well48 13.8% Speak English less than very well
English speakers - Born in the United States 88.3% of residents of Fort Knox speak English at home.
8.3% of residents speak Spanish at home 448 91.1% Speak English very well44 8.9% Speak English less than very well2.4% of residents speak other language at home 143 100.0% Speak English very well
English speakers - Native, born elsewhere 51.7% of residents of Fort Knox speak English at home.
54.8% of residents speak Spanish at home 77 33.8% Speak English very well151 66.2% Speak English less than very well4.1% of residents speak other language at home 17 100.0% Speak English very well
English speakers - Foreign-born 39.2% of residents of Fort Knox speak English at home.
29.7% of residents speak Spanish at home 122 75.3% Speak English very well40 24.7% Speak English less than very well35.3% of residents speak other language at home 144 74.6% Speak English very well49 25.4% Speak English less than very well
White (Caucasian) - Speak only English Native:
93.1% (4,036)Foreign-born:
32.9% (37)
White (Caucasian) - Speak another language Native:
6.0% (260)Foreign-born:
65.5% (73)
Black or African American - Speak only English Native:
99.3% (1,252)Foreign-born:
86.5% (148)
Black or African American - Speak another language Native:
0.8% (10)Foreign-born:
21.2% (36)
American Indian / Alaska Native - Speak another language Native:
56.8% (53)Foreign-born:
98.8% (1)
Asian - Speak only English Native:
70.7% (48)Foreign-born:
5.9% (8)
Asian - Speak another language Native:
28.3% (19)Foreign-born:
94.5% (125)
Native Hawaiian / Pacific Islander - Speak only English Native:
84.8% (155)Foreign-born:
96.3% (4)
Other race - Speak only English Native:
45.7% (86)Foreign-born:
75.4% (9)
Other race - Speak another language Native:
52.0% (97)Foreign-born:
32.9% (4)
Two or more races - Speak only English Native:
50.4% (788)Foreign-born:
33.5% (67)
Two or more races - Speak another language Native:
38.8% (607)Foreign-born:
66.6% (134)
White alone - Speak only English Native:
98.7% (3,623)Foreign-born:
88.4% (40)
White alone - Speak another language Native:
1.2% (45)Foreign-born:
13.3% (6)
Hispanic or Latino - Speak only English Native:
56.7% (1,150)Foreign-born:
16.5% (35)
Hispanic or Latino - Speak another language Native:
39.8% (807)Foreign-born:
78.0% (167)
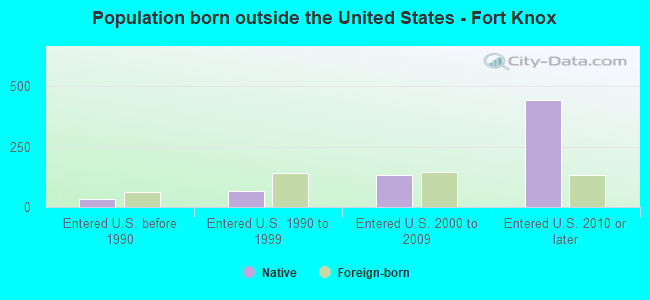
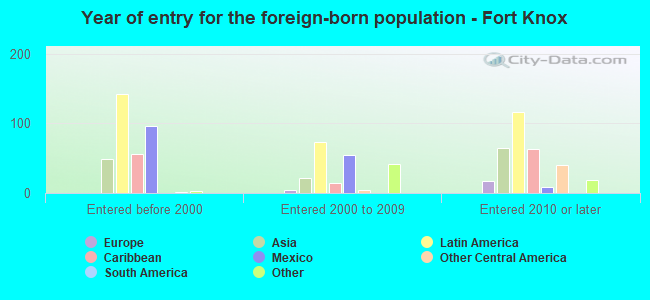
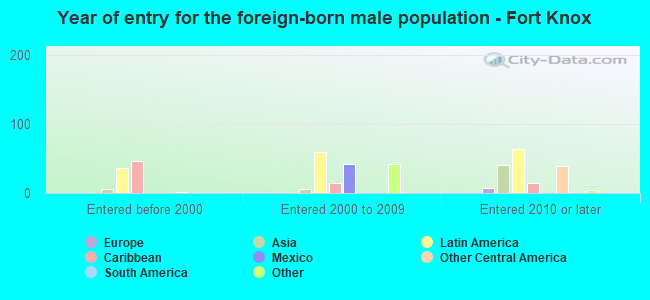
Foreign-born residents in Fort Knox 565 residents are foreign born (3.8% Latin America , 1.7% Asia ).
This city:
6.5%Kentucky:
4.1%
Marital status for residents in Fort Knox Marital status - White (Caucasian) population 15 years and over
Males 46.8% Never married43.2% Now married0.9% Separated0.0% Widowed9.0% DivorcedFemales 16.0% Never married75.2% Now married0.2% Separated2.8% Widowed5.8% DivorcedWomen who gave birth in the past 12 months Now married:
92.0% (125)Unmarried:
8.0% (11)
Women who did not give birth in the past 12 months Now married:
75.3% (835)Unmarried:
24.7% (274)
Marital status - Black or African American population 15 years and over
Males 45.6% Never married53.1% Now married0.0% Separated0.0% Widowed1.4% DivorcedFemales 37.3% Never married58.3% Now married0.0% Separated2.3% Widowed2.1% DivorcedWomen who gave birth in the past 12 months Now married:
100.0% (86)Unmarried:
0.0% (0)
Women who did not give birth in the past 12 months Now married:
53.9% (190)Unmarried:
46.1% (163)
Marital status - American Indian / Alaska Native population 15 years and over
Males 44.6% Never married0.0% Now married0.0% Separated0.0% Widowed55.4% DivorcedFemales 0.0% Never married100.0% Now married0.0% Separated0.0% Widowed0.0% DivorcedWomen who did not give birth in the past 12 months Now married:
100.0% (12)Unmarried:
0.0% (0)
Marital status - Asian population 15 years and over
Males 78.4% Never married21.6% Now married0.0% Separated0.0% Widowed0.0% DivorcedFemales 39.1% Never married53.6% Now married0.0% Separated0.0% Widowed7.3% DivorcedWomen who did not give birth in the past 12 months Now married:
50.6% (39)Unmarried:
49.4% (39)
Marital status - Native Hawaiian / Pacific Islander population 15 years and over
Males 95.9% Never married4.1% Now married0.0% Separated0.0% Widowed0.0% DivorcedFemales 9.5% Never married90.5% Now married0.0% Separated0.0% Widowed0.0% DivorcedWomen who gave birth in the past 12 months Now married:
100.0% (16)Unmarried:
0.0% (0)
Women who did not give birth in the past 12 months Now married:
66.7% (4)Unmarried:
33.3% (2)
Marital status - Other race population 15 years and over
Males 14.8% Never married85.2% Now married0.0% Separated0.0% Widowed0.0% DivorcedFemales 6.3% Never married74.6% Now married0.0% Separated0.0% Widowed19.0% DivorcedWomen who did not give birth in the past 12 months Now married:
72.9% (57)Unmarried:
27.1% (21)
Marital status - Two or more races population 15 years and over
Males 45.7% Never married54.3% Now married0.0% Separated0.0% Widowed0.0% DivorcedFemales 46.4% Never married44.7% Now married0.0% Separated0.0% Widowed8.9% DivorcedWomen who gave birth in the past 12 months Now married:
100.0% (17)Unmarried:
0.0% (0)
Women who did not give birth in the past 12 months Now married:
43.3% (291)Unmarried:
56.7% (382)
Marital status - White alone, not Hispanic / Latino population 15 years and over
Males 41.7% Never married46.5% Now married1.1% Separated0.0% Widowed10.6% DivorcedFemales 17.7% Never married71.7% Now married0.3% Separated3.4% Widowed6.9% DivorcedWomen who gave birth in the past 12 months Now married:
86.9% (73)Unmarried:
13.1% (11)
Women who did not give birth in the past 12 months Now married:
72.0% (648)Unmarried:
28.0% (252)
Marital status - Hispanic or Latino population 15 years and over
Males 63.8% Never married35.6% Now married0.0% Separated0.0% Widowed0.6% DivorcedFemales 27.6% Never married66.3% Now married0.0% Separated0.0% Widowed6.1% DivorcedWomen who gave birth in the past 12 months Now married:
100.0% (70)Unmarried:
0.0% (0)
Women who did not give birth in the past 12 months Now married:
63.2% (454)Unmarried:
36.8% (265)
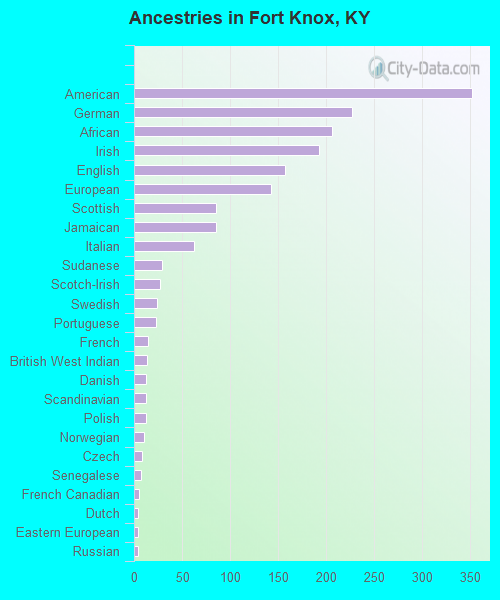
Ancestries in Fort Knox
352 9.1% American227 5.9% German206 5.3% African193 5.0% Irish157 4.1% English143 3.7% European85 2.2% Scottish85 2.2% Jamaican62 1.6% Italian29 0.8% Sudanese27 0.7% Scotch-Irish24 0.6% Swedish23 0.6% Portuguese15 0.4% French14 0.4% British West Indian13 0.3% Danish13 0.3% Scandinavian12 0.3% Polish10 0.3% Norwegian8 0.2% Czech7 0.2% Senegalese5 0.1% French Canadian4 0.1% Dutch4 0.1% Eastern European4 0.1% Russian
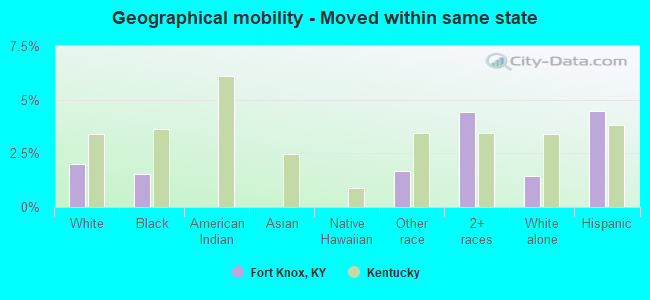
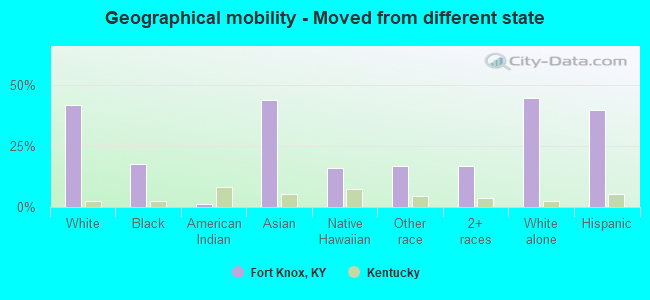
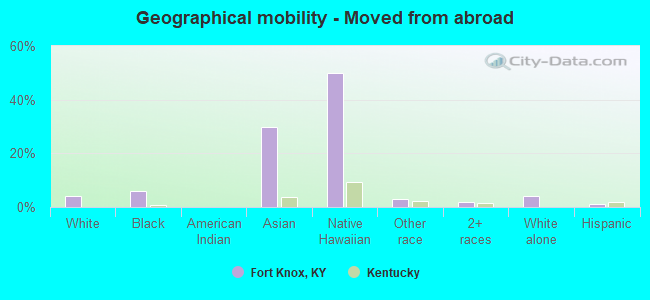
Geographical mobility in Fort Knox Same house 1 year ago 3,098 62.0% White (Caucasian)997 80.5% Black or African American78 90.4% American Indian / Alaska Native81 36.5% Asian25 13.4% Native Hawaiian / Pacific Islander319 81.6% Other race1,011 55.8% Two or more races2,575 61.1% White alone, not Hispanic / Latino1,349 58.9% Hispanic or LatinoMoved within same county 43 0.9% White / Caucasian12 1.0% Black or African American12 0.7% Two or more races41 1.0% White alone, not Hispanic / Latino21 0.9% Hispanic or LatinoMoved within same state 100 2.0% White / Caucasian19 1.5% Black or African American7 1.7% Other race80 4.4% Two or more races61 1.4% White alone, not Hispanic / Latino103 4.5% Hispanic or LatinoMoved from different state 2,100 42.0% White / Caucasian219 17.7% Black or African American1 1.2% American Indian / Alaska Native98 43.9% Asian30 16.1% Native Hawaiian / Pacific Islander66 16.8% Other race303 16.8% Two or more races1,886 44.8% White alone, not Hispanic / Latino908 39.6% Hispanic or LatinoMoved from abroad 208 4.2% White73 5.9% Black or African American67 30.0% Asian92 49.8% Native Hawaiian / Pacific Islander12 3.1% Other race32 1.8% Two or more races166 3.9% White alone, not Hispanic / Latino25 1.1% Hispanic or Latino
Children Nativity (place of birth) in Fort Knox
Children under 6 years - Living with two parents Both parents native 808 100.0% NativeBoth parents foreign-born 54 100.0% NativeOne native, one foreign-born parent 113 100.0% NativeChildren under 6 years - Living with one parent Native parent 82 100.0% NativeChildren 6 to 17 years - Living with two parents Both parents native 1,081 100.0% NativeBoth parents foreign-born 98 95.4% Native5 4.6% Foreign-bornOne native, one foreign-born parent 220 100.0% NativeChildren 6 to 17 years - Living with one parent Native parent 203 100.0% Native
Grandparents responsible for own grandchildren in Fort Knox
Grandparents (30 to 59 years) White / Caucasian 2 100.0% Responsible for grandchildrenBlack or African American 11 100.0% Not responsible for grandchildrenTwo or more races 1 100.0% Responsible for grandchildrenWhite alone, not Hispanic / Latino 2 100.0% Responsible for grandchildren
Grandparents (60 years and over) White / Caucasian 6 100.0% Not responsible for grandchildrenBlack or African American 4 100.0% Not responsible for grandchildrenWhite alone, not Hispanic / Latino 6 100.0% Not responsible for grandchildren