Races in Fort Pierce, Florida (FL) Detailed Stats
Data:
Races - White alone (%)
Races - White alone (% change since 2000)
Races - Black alone (%)
Races - Black alone (% change since 2000)
Races - American Indian alone (%)
Races - American Indian alone (% change since 2000)
Races - Asian alone (%)
Races - Asian alone (% change since 2000)
Races - Hispanic (%)
Races - Hispanic (% change since 2000)
Races - Native Hawaiian and Other Pacific Islander alone (%)
Races - Native Hawaiian and Other Pacific Islander alone (% change since 2000)
Races - Two or more races(%)
Races - Two or more races(% change since 2000)
Races - Other race alone (%)
Races - Other race alone (% change since 2000)
Racial diversity
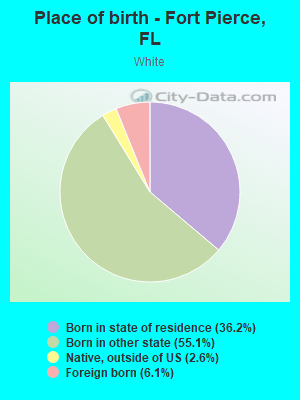
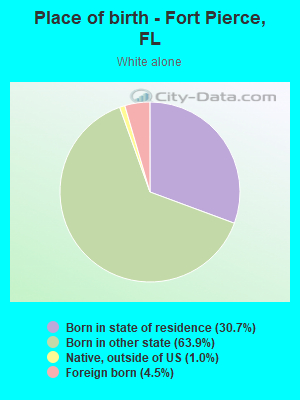
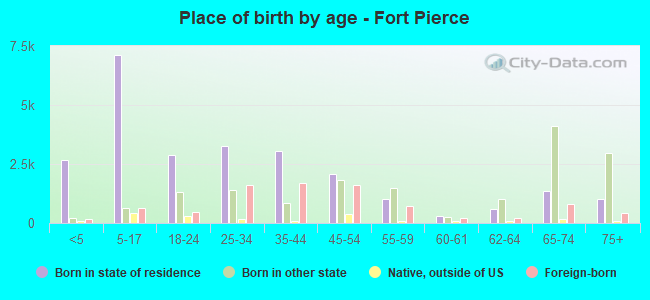
Place of birth - Born in state of residence (%)
Place of birth - Born in state of residence (%) - White
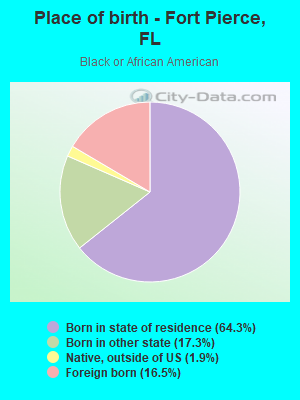
Place of birth - Born in state of residence (%) - Black or African American
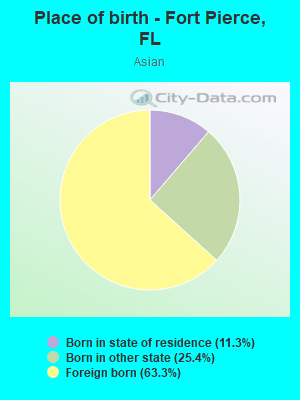
Place of birth - Born in state of residence (%) - Asian
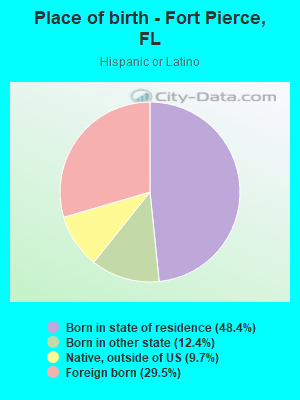
Place of birth - Born in state of residence (%) - Hispanic or Latino
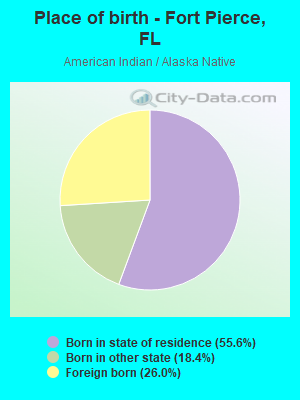
Place of birth - Born in state of residence (%) - American Indian and Alaska Native
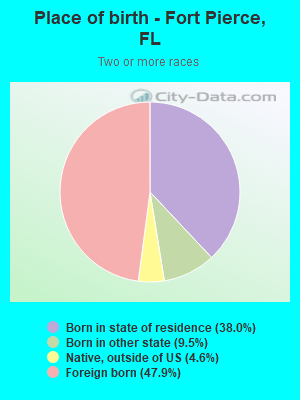
Place of birth - Born in state of residence (%) - Multirace
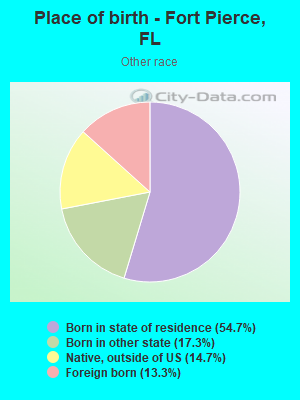
Place of birth - Born in state of residence (%) - Other Race
Place of birth - Born in other state (%)
Place of birth - Born in other state (%) - White
Place of birth - Born in other state (%) - Black or African American
Place of birth - Born in other state (%) - Asian
Place of birth - Born in other state (%) - Hispanic or Latino
Place of birth - Born in other state (%) - American Indian and Alaska Native
Place of birth - Born in other state (%) - Multirace
Place of birth - Born in other state (%) - Other Race
Place of birth - Native, outside of US (%)
Place of birth - Native, outside of US (%) - White
Place of birth - Native, outside of US (%) - Black or African American
Place of birth - Native, outside of US (%) - Asian
Place of birth - Native, outside of US (%) - Hispanic or Latino
Place of birth - Native, outside of US (%) - American Indian and Alaska Native
Place of birth - Native, outside of US (%) - Multirace
Place of birth - Native, outside of US (%) - Other Race
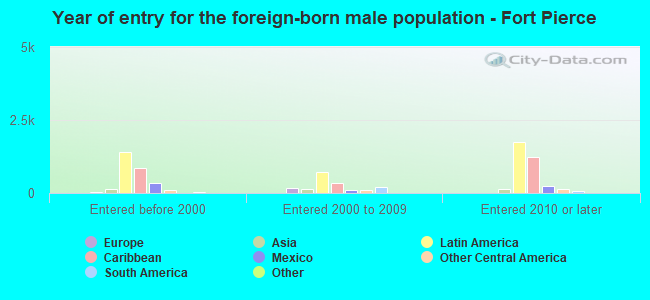
Place of birth - Foreign born (%)
Place of birth - Foreign born (%) - White
Place of birth - Foreign born (%) - Black or African American
Place of birth - Foreign born (%) - Asian
Place of birth - Foreign born (%) - Hispanic or Latino
Place of birth - Foreign born (%) - American Indian and Alaska Native
Place of birth - Foreign born (%) - Multirace
Place of birth - Foreign born (%) - Other Race
Residents speaking English at home (%)
Residents speaking English at home - Born in the United States (%)
Residents speaking English at home - Native, born elsewhere (%)
Residents speaking English at home - Foreign born (%)
Residents speaking Spanish at home (%)
Residents speaking Spanish at home - Born in the United States (%)
Residents speaking Spanish at home - Native, born elsewhere (%)
Residents speaking Spanish at home - Foreign born (%)
Residents speaking other language at home (%)
Residents speaking other language at home - Born in the United States (%)
Residents speaking other language at home - Native, born elsewhere (%)
Residents speaking other language at home - Foreign born (%)
Marital status - Never married (%)
Marital status - Now married (%)
Marital status - Separated (%)
Marital status - Widowed (%)
Marital status - Divorced (%)
Ancestries Reported - Arab (%)
Ancestries Reported - Czech (%)
Ancestries Reported - Danish (%)
Ancestries Reported - Dutch (%)
Ancestries Reported - English (%)
Ancestries Reported - French (%)
Ancestries Reported - French Canadian (%)
Ancestries Reported - German (%)
Ancestries Reported - Greek (%)
Ancestries Reported - Hungarian (%)
Ancestries Reported - Irish (%)
Ancestries Reported - Italian (%)
Ancestries Reported - Lithuanian (%)
Ancestries Reported - Norwegian (%)
Ancestries Reported - Polish (%)
Ancestries Reported - Portuguese (%)
Ancestries Reported - Russian (%)
Ancestries Reported - Scotch-Irish (%)
Ancestries Reported - Scottish (%)
Ancestries Reported - Slovak (%)
Ancestries Reported - Subsaharan African (%)
Ancestries Reported - Swedish (%)
Ancestries Reported - Swiss (%)
Ancestries Reported - Ukrainian (%)
Ancestries Reported - United States (%)
Ancestries Reported - Welsh (%)
Ancestries Reported - West Indian (%)
Ancestries Reported - Other (%)
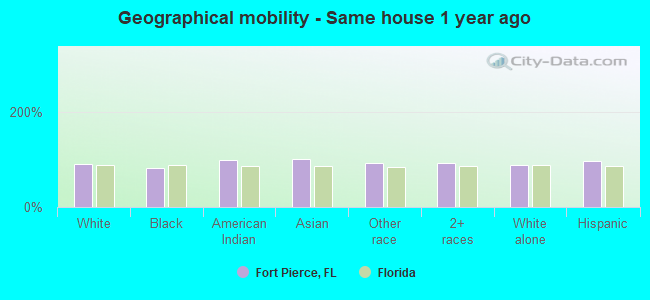
Geographical mobility - Same house 1 year ago (%)
Geographical mobility - Same house 1 year ago (%) - White
Geographical mobility - Same house 1 year ago (%) - Black or African American
Geographical mobility - Same house 1 year ago (%) - Asian
Geographical mobility - Same house 1 year ago (%) - Hispanic or Latino
Geographical mobility - Same house 1 year ago (%) - American Indian and Alaska Native
Geographical mobility - Same house 1 year ago (%) - Multirace
Geographical mobility - Same house 1 year ago (%) - Other Race
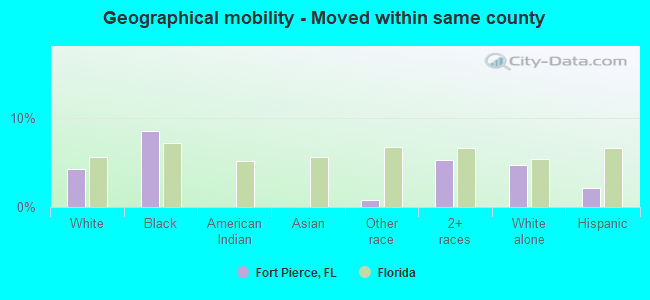
Geographical mobility - Moved within same county (%)
Geographical mobility - Moved within same county (%) - White
Geographical mobility - Moved within same county (%) - Black or African American
Geographical mobility - Moved within same county (%) - Asian
Geographical mobility - Moved within same county (%) - Hispanic or Latino
Geographical mobility - Moved within same county (%) - American Indian and Alaska Native
Geographical mobility - Moved within same county (%) - Multirace
Geographical mobility - Moved within same county (%) - Other Race
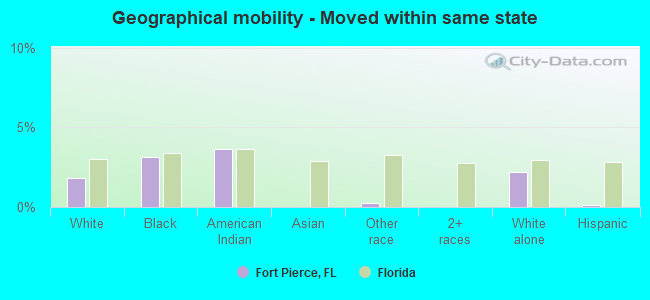
Geographical mobility - Moved from different county within same state (%)
Geographical mobility - Moved from different county within same state (%) - White
Geographical mobility - Moved from different county within same state (%) - Black or African American
Geographical mobility - Moved from different county within same state (%) - Asian
Geographical mobility - Moved from different county within same state (%) - Hispanic or Latino
Geographical mobility - Moved from different county within same state (%) - American Indian and Alaska Native
Geographical mobility - Moved from different county within same state (%) - Multirace
Geographical mobility - Moved from different county within same state (%) - Other Race
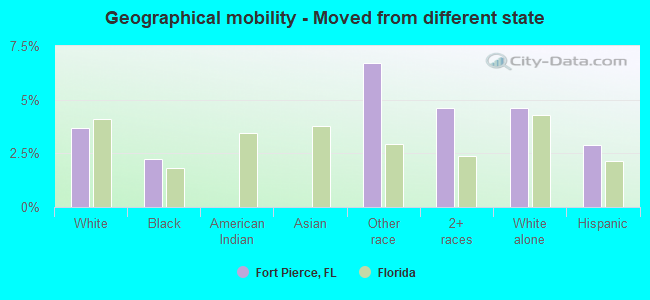
Geographical mobility - Moved from different state (%)
Geographical mobility - Moved from different state (%) - White
Geographical mobility - Moved from different state (%) - Black or African American
Geographical mobility - Moved from different state (%) - Asian
Geographical mobility - Moved from different state (%) - Hispanic or Latino
Geographical mobility - Moved from different state (%) - American Indian and Alaska Native
Geographical mobility - Moved from different state (%) - Multirace
Geographical mobility - Moved from different state (%) - Other Race
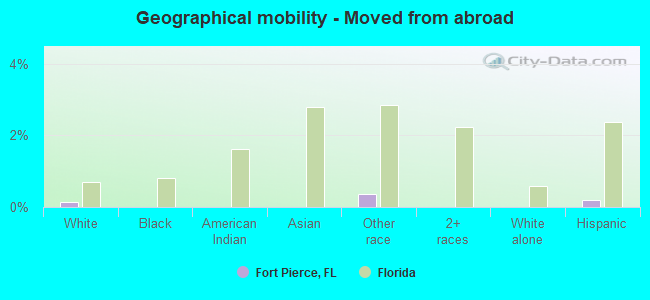
Geographical mobility - Moved from abroad (%)
Geographical mobility - Moved from abroad (%) - White
Geographical mobility - Moved from abroad (%) - Black or African American
Geographical mobility - Moved from abroad (%) - Asian
Geographical mobility - Moved from abroad (%) - Hispanic or Latino
Geographical mobility - Moved from abroad (%) - American Indian and Alaska Native
Geographical mobility - Moved from abroad (%) - Multirace
Geographical mobility - Moved from abroad (%) - Other Race
Place of birth for the foreign-born population - Ireland (%)
Place of birth for the foreign-born population - Denmark (%)
Place of birth for the foreign-born population - Norway (%)
Place of birth for the foreign-born population - Sweden (%)
Place of birth for the foreign-born population - United Kingdom (%)
Place of birth for the foreign-born population - England (%)
Place of birth for the foreign-born population - Scotland (%)
Place of birth for the foreign-born population - Other Northern Europe (%)
Place of birth for the foreign-born population - Austria (%)
Place of birth for the foreign-born population - Belgium (%)
Place of birth for the foreign-born population - France (%)
Place of birth for the foreign-born population - Germany (%)
Place of birth for the foreign-born population - Netherlands (%)
Place of birth for the foreign-born population - Switzerland (%)
Place of birth for the foreign-born population - Other Western Europe (%)
Place of birth for the foreign-born population - Greece (%)
Place of birth for the foreign-born population - Italy (%)
Place of birth for the foreign-born population - Portugal (%)
Place of birth for the foreign-born population - Spain (%)
Place of birth for the foreign-born population - Other Southern Europe (%)
Place of birth for the foreign-born population - Albania (%)
Place of birth for the foreign-born population - Belarus (%)
Place of birth for the foreign-born population - Bosnia and Herzegovina (%)
Place of birth for the foreign-born population - Bulgaria (%)
Place of birth for the foreign-born population - Croatia (%)
Place of birth for the foreign-born population - Czechoslovakia (%)
Place of birth for the foreign-born population - Hungary (%)
Place of birth for the foreign-born population - Latvia (%)
Place of birth for the foreign-born population - Lithuania (%)
Place of birth for the foreign-born population - North Macedonia (Macedonia) (%)
Place of birth for the foreign-born population - Moldova (%)
Place of birth for the foreign-born population - Poland (%)
Place of birth for the foreign-born population - Romania (%)
Place of birth for the foreign-born population - Russia (%)
Place of birth for the foreign-born population - Serbia (%)
Place of birth for the foreign-born population - Ukraine (%)
Place of birth for the foreign-born population - Other Eastern Europe (%)
Place of birth for the foreign-born population - China (%)
Place of birth for the foreign-born population - Hong Kong (%)
Place of birth for the foreign-born population - Taiwan (%)
Place of birth for the foreign-born population - Japan (%)
Place of birth for the foreign-born population - Korea (%)
Place of birth for the foreign-born population - Other Eastern Asia (%)
Place of birth for the foreign-born population - Afghanistan (%)
Place of birth for the foreign-born population - Bangladesh (%)
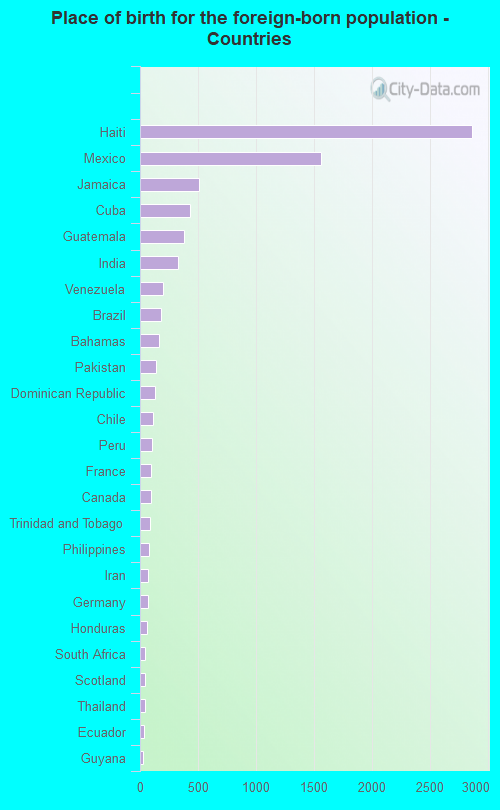
Place of birth for the foreign-born population - India (%)
Place of birth for the foreign-born population - Iran (%)
Place of birth for the foreign-born population - Kazakhstan (%)
Place of birth for the foreign-born population - Nepal (%)
Place of birth for the foreign-born population - Pakistan (%)
Place of birth for the foreign-born population - Sri Lanka (%)
Place of birth for the foreign-born population - Uzbekistan (%)
Place of birth for the foreign-born population - Other South Central Asia (%)
Place of birth for the foreign-born population - Burma (%)
Place of birth for the foreign-born population - Cambodia (%)
Place of birth for the foreign-born population - Indonesia (%)
Place of birth for the foreign-born population - Laos (%)
Place of birth for the foreign-born population - Malaysia (%)
Place of birth for the foreign-born population - Philippines (%)
Place of birth for the foreign-born population - Singapore (%)
Place of birth for the foreign-born population - Thailand (%)
Place of birth for the foreign-born population - Vietnam (%)
Place of birth for the foreign-born population - Other South Eastern Asia (%)
Place of birth for the foreign-born population - Armenia (%)
Place of birth for the foreign-born population - Iraq (%)
Place of birth for the foreign-born population - Israel (%)
Place of birth for the foreign-born population - Jordan (%)
Place of birth for the foreign-born population - Kuwait (%)
Place of birth for the foreign-born population - Lebanon (%)
Place of birth for the foreign-born population - Saudi Arabia (%)
Place of birth for the foreign-born population - Syria (%)
Place of birth for the foreign-born population - Turkey (%)
Place of birth for the foreign-born population - Yemen (%)
Place of birth for the foreign-born population - Other Western Asia (%)
Place of birth for the foreign-born population - Eritrea (%)
Place of birth for the foreign-born population - Ethiopia (%)
Place of birth for the foreign-born population - Kenya (%)
Place of birth for the foreign-born population - Somalia (%)
Place of birth for the foreign-born population - Uganda (%)
Place of birth for the foreign-born population - Zimbabwe (%)
Place of birth for the foreign-born population - Other Eastern Africa (%)
Place of birth for the foreign-born population - Cameroon (%)
Place of birth for the foreign-born population - Congo (%)
Place of birth for the foreign-born population - Democratic Republic of Congo (Zaire) (%)
Place of birth for the foreign-born population - Other Middle Africa (%)
Place of birth for the foreign-born population - Egypt (%)
Place of birth for the foreign-born population - Morocco (%)
Place of birth for the foreign-born population - Sudan (%)
Place of birth for the foreign-born population - Other Northern Africa (%)
Place of birth for the foreign-born population - South Africa (%)
Place of birth for the foreign-born population - Other Southern Africa (%)
Place of birth for the foreign-born population - Cabo Verde (%)
Place of birth for the foreign-born population - Ghana (%)
Place of birth for the foreign-born population - Liberia (%)
Place of birth for the foreign-born population - Nigeria (%)
Place of birth for the foreign-born population - Senegal (%)
Place of birth for the foreign-born population - Sierra Leone (%)
Place of birth for the foreign-born population - Other Western Africa (%)
Place of birth for the foreign-born population - Australia (%)
Place of birth for the foreign-born population - New Zealand (%)
Place of birth for the foreign-born population - Fiji (%)
Place of birth for the foreign-born population - Micronesia (%)
Place of birth for the foreign-born population - Bahamas (%)
Place of birth for the foreign-born population - Barbados (%)
Place of birth for the foreign-born population - Cuba (%)
Place of birth for the foreign-born population - Dominica (%)
Place of birth for the foreign-born population - Dominican Republic (%)
Place of birth for the foreign-born population - Grenada (%)
Place of birth for the foreign-born population - Haiti (%)
Place of birth for the foreign-born population - Jamaica (%)
Place of birth for the foreign-born population - St. Vincent and the Grenadines (%)
Place of birth for the foreign-born population - Trinidad and Tobago (%)
Place of birth for the foreign-born population - West Indies (%)
Place of birth for the foreign-born population - Other Caribbean (%)
Place of birth for the foreign-born population - Belize (%)
Place of birth for the foreign-born population - Costa Rica (%)
Place of birth for the foreign-born population - El Salvador (%)
Place of birth for the foreign-born population - Guatemala (%)
Place of birth for the foreign-born population - Honduras (%)
Place of birth for the foreign-born population - Mexico (%)
Place of birth for the foreign-born population - Nicaragua (%)
Place of birth for the foreign-born population - Panama (%)
Place of birth for the foreign-born population - Other Central America (%)
Place of birth for the foreign-born population - Argentina (%)
Place of birth for the foreign-born population - Bolivia (%)
Place of birth for the foreign-born population - Brazil (%)
Place of birth for the foreign-born population - Chile (%)
Place of birth for the foreign-born population - Colombia (%)
Place of birth for the foreign-born population - Ecuador (%)
Place of birth for the foreign-born population - Guyana (%)
Place of birth for the foreign-born population - Peru (%)
Place of birth for the foreign-born population - Uruguay (%)
Place of birth for the foreign-born population - Venezuela (%)
Place of birth for the foreign-born population - Other South America (%)
Place of birth for the foreign-born population - Canada (%)
Place of birth for the foreign-born population - Other Northern America (%)
Place of birth for the foreign-born population - Other (%)
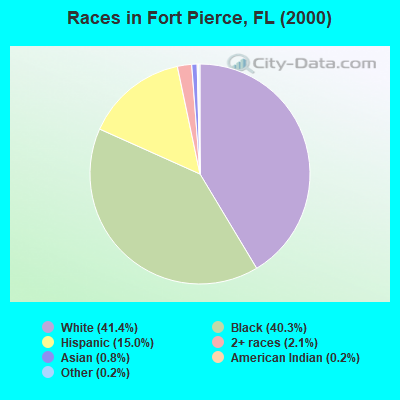
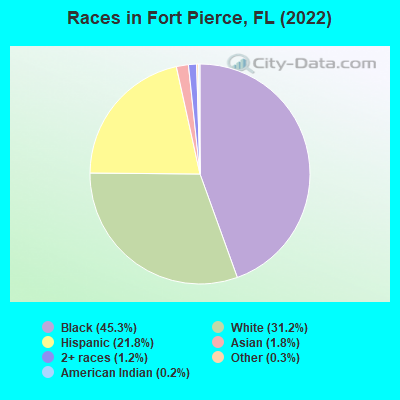
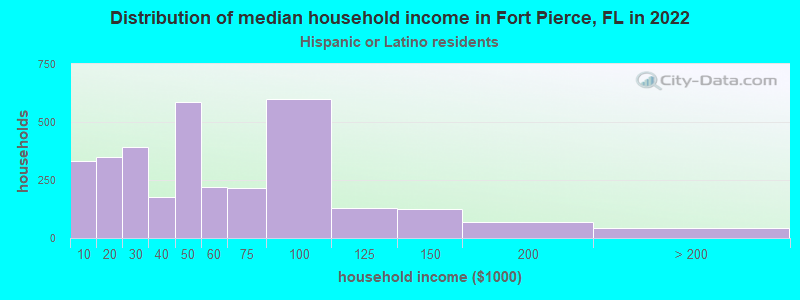
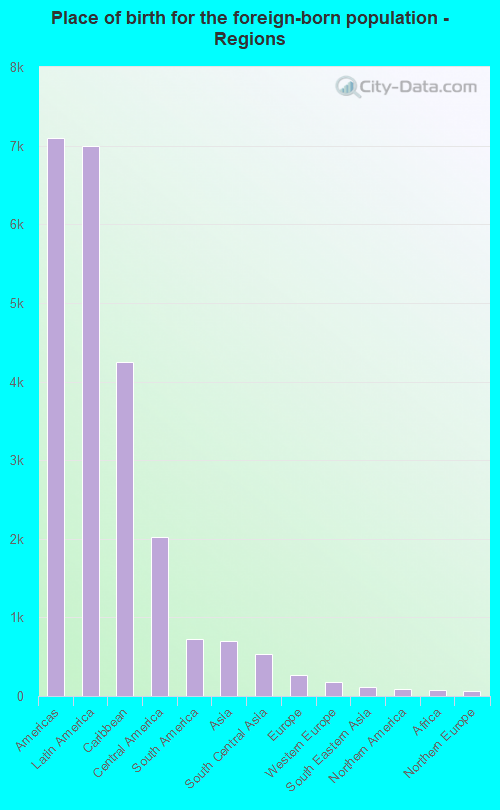
According to 2022 data, the most numerous races in Fort Pierce, FL are White alone (15,769 residents), Hispanic (11,002 residents), and Black alone (22,904 residents). 72.1% of Fort Pierce residents speak English at home. 16.1% of Fort Pierce, FL residents are foreign-born (14.1% born in Latin America), which is 30.5% less than the foreign-born rate of 21.0% across the entire state of Florida.
Race distribution in Fort Pierce
2000 2022
10,458,509 65.4% White alone 2,682,715 16.8% Hispanic 2,264,268 14.2% Black alone 261,693 1.6% Asian alone 236,954 1.5% Two or more races 42,358 0.3% American Indian alone 28,994 0.2% Other race alone 6,887 0.04% Native Hawaiian and Other
11,309,403 50.8% White alone 6,025,039 27.1% Hispanic 3,241,015 14.6% Black alone 861,630 3.9% Two or more races 623,692 2.8% Asian alone 152,054 0.7% Other race alone 22,504 0.1% American Indian alone 9,486 0.04% Native Hawaiian and Other
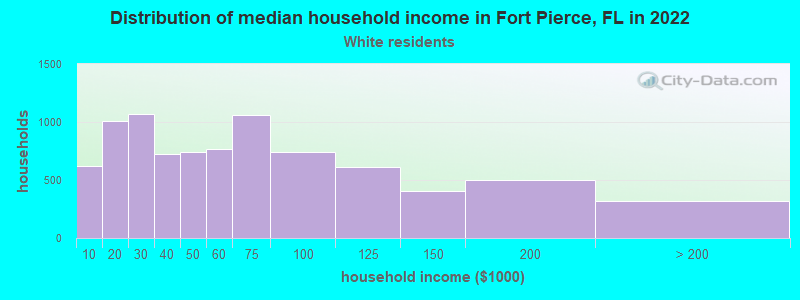
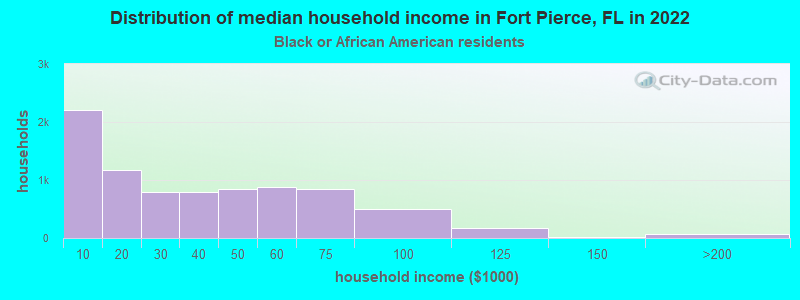
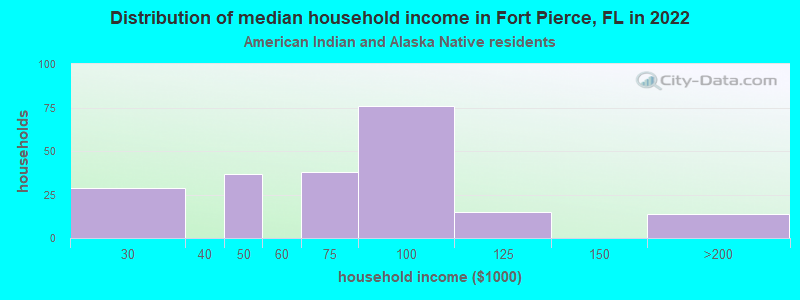
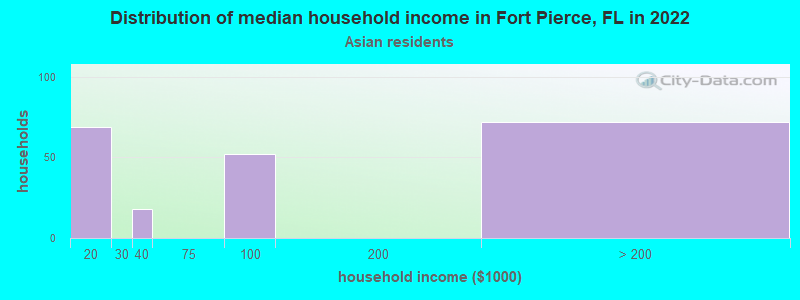
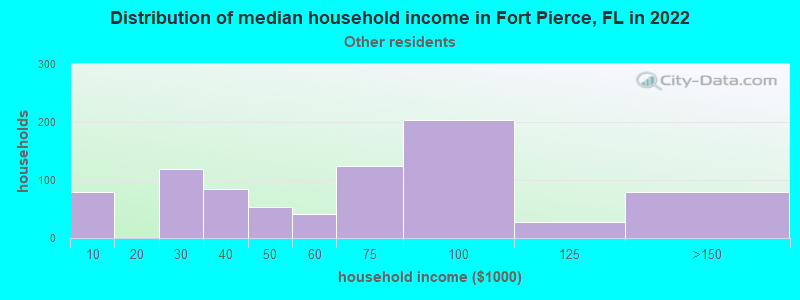
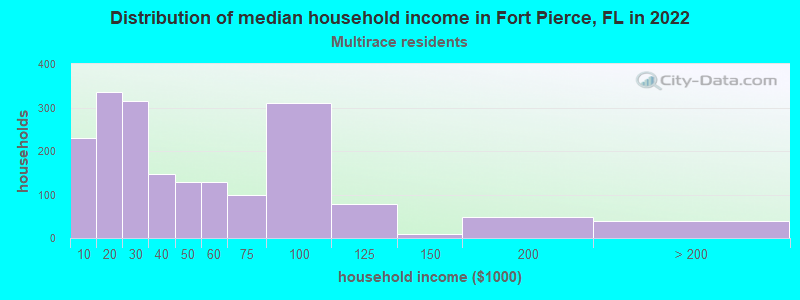
Income and house value in Fort Pierce Median household income in 2022 $53,265 White non-Hispanic householders$34,934 Black householders$90,088 American Indian and Alaska Native householders$68,753 Some other race householders$32,114 Two or more races householders$50,676 Hispanic or Latino race householdersMedian 2022 house value $306,476 White Non-Hispanic householders$216,582 Black or African American householders$271,773 American Indian or Alaska Native householders $246,686 Asian householders$256,303 Some other race householders$265,919 Two or more races householders$231,216 Hispanic or Latino householders
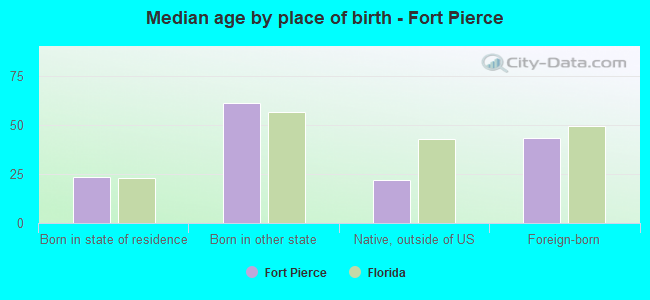
Median age by race in Fort Pierce
53.6 Median age for White residents54.2 51.9 31.8 Median age for Black or African American residents29.9 32.8 27.5 Median age for American Indian / Alaska Native residents28.2 27.2 36.8 Median age for Asian residents17.4 47.6 -660,215,053.1 Median age for Native Hawaiian / Pacific Islander residents-662,309,367.5 -668,008,047.6 26.9 Median age for Other race residents23.6 35.9 34.7 Median age for Two or more races residents30.6 41.8 58.5 Median age for White alone residents58.4 59.2 26.7 Median age for Hispanic or Latino residents25.4 28.2
Owner/renter occupied households by race in Fort Pierce
House owners and renters - White residents 5,554 67.7% Owner occupied2,647 32.3% Renter occupiedHouse owners and renters - Black or African American residents 2,256 30.0% Owner occupied5,255 70.0% Renter occupiedHouse owners and renters - American Indian / Alaska Native residents 126 79.2% Owner occupied33 20.8% Renter occupiedHouse owners and renters - Asian residents 222 97.7% Owner occupied5 2.3% Renter occupiedHouse owners and renters - Other race residents 408 62.8% Owner occupied242 37.2% Renter occupiedHouse owners and renters - Two or more races residents 875 47.7% Owner occupied961 52.3% Renter occupiedHouse owners and renters - White alone residents 5,098 69.6% Owner occupied2,228 30.4% Renter occupiedHouse owners and renters - Hispanic or Latino residents 1,588 52.3% Owner occupied1,450 47.7% Renter occupied
Language usage in Fort Pierce
English speakers - Total 72.1% of residents of Fort Pierce speak English at home.
16.4% of residents speak Spanish at home 4,435 57.7% Speak English very well3,254 42.3% Speak English less than very well12.2% of residents speak other language at home 3,000 52.5% Speak English very well2,719 47.5% Speak English less than very well
English speakers - Born in the United States 94.6% of residents of Fort Pierce speak English at home.
3.7% of residents speak Spanish at home 487 83.4% Speak English very well97 16.6% Speak English less than very well2.0% of residents speak other language at home 232 74.1% Speak English very well81 25.9% Speak English less than very well
English speakers - Native, born elsewhere 28.0% of residents of Fort Pierce speak English at home.
56.8% of residents speak Spanish at home 348 44.8% Speak English very well429 55.2% Speak English less than very well14.1% of residents speak other language at home 193 100.0% Speak English very well
English speakers - Foreign-born 14.1% of residents of Fort Pierce speak English at home.
37.7% of residents speak Spanish at home 911 28.9% Speak English very well2,241 71.1% Speak English less than very well54.3% of residents speak other language at home 1,912 42.2% Speak English very well2,624 57.8% Speak English less than very well
White (Caucasian) - Speak only English Native:
87.2% (15,053)Foreign-born:
23.0% (275)
White (Caucasian) - Speak another language Native:
12.4% (2,139)Foreign-born:
71.5% (854)
Black or African American - Speak only English Native:
93.3% (16,503)Foreign-born:
13.1% (483)
Black or African American - Speak another language Native:
6.9% (1,214)Foreign-born:
100.0% (3,675)
American Indian / Alaska Native - Speak only English Native:
44.6% (103)Foreign-born:
33.9% (35)
American Indian / Alaska Native - Speak another language Native:
61.8% (142)Foreign-born:
47.0% (48)
Asian - Speak only English Native:
98.5% (37)Foreign-born:
18.5% (108)
Other race - Speak another language Native:
55.9% (1,382)Foreign-born:
94.1% (376)
Two or more races - Speak only English Native:
50.8% (1,013)Foreign-born:
14.0% (322)
Two or more races - Speak another language Native:
49.1% (978)Foreign-born:
86.3% (1,992)
White alone - Speak only English Native:
97.1% (14,118)Foreign-born:
40.0% (286)
White alone - Speak another language Native:
2.8% (407)Foreign-born:
59.5% (426)
Hispanic or Latino - Speak only English Native:
37.3% (2,503)Foreign-born:
5.5% (183)
Hispanic or Latino - Speak another language Native:
61.9% (4,153)Foreign-born:
94.1% (3,129)
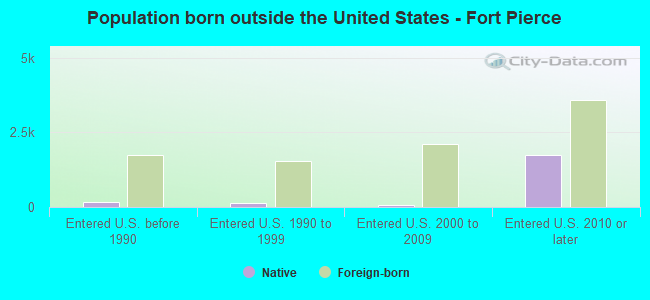
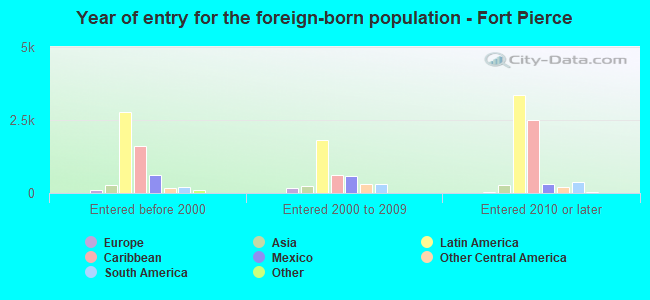
Foreign-born residents in Fort Pierce 8,131 residents are foreign born (14.1% Latin America ).
This city:
16.1%Florida:
21.1%
Marital status for residents in Fort Pierce Marital status - White (Caucasian) population 15 years and over
Males 29.3% Never married45.4% Now married1.7% Separated4.0% Widowed19.6% DivorcedFemales 24.6% Never married37.8% Now married2.6% Separated17.2% Widowed17.8% DivorcedWomen who gave birth in the past 12 months Now married:
52.9% (96)Unmarried:
47.1% (86)
Women who did not give birth in the past 12 months Now married:
33.5% (1,117)Unmarried:
66.5% (2,220)
Marital status - Black or African American population 15 years and over
Males 54.6% Never married29.6% Now married1.7% Separated5.3% Widowed8.7% DivorcedFemales 52.0% Never married23.8% Now married4.1% Separated7.0% Widowed13.0% DivorcedWomen who gave birth in the past 12 months Now married:
31.2% (314)Unmarried:
68.8% (694)
Women who did not give birth in the past 12 months Now married:
17.0% (881)Unmarried:
83.0% (4,303)
Marital status - American Indian / Alaska Native population 15 years and over
Males 0.0% Never married74.2% Now married0.0% Separated9.0% Widowed16.9% DivorcedFemales 25.3% Never married29.7% Now married0.0% Separated12.1% Widowed33.0% DivorcedWomen who did not give birth in the past 12 months Now married:
54.0% (44)Unmarried:
46.0% (38)
Marital status - Asian population 15 years and over
Males 38.1% Never married61.9% Now married0.0% Separated0.0% Widowed0.0% DivorcedFemales 0.6% Never married92.6% Now married0.0% Separated6.7% Widowed0.0% DivorcedWomen who gave birth in the past 12 months Now married:
100.0% (72)Unmarried:
0.0% (0)
Women who did not give birth in the past 12 months Now married:
98.7% (174)Unmarried:
1.3% (2)
Marital status - Other race population 15 years and over
Males 48.8% Never married35.8% Now married0.0% Separated3.6% Widowed11.8% DivorcedFemales 24.1% Never married49.9% Now married0.0% Separated0.0% Widowed26.0% DivorcedWomen who gave birth in the past 12 months Now married:
0.0% (0)Unmarried:
100.0% (21)
Women who did not give birth in the past 12 months Now married:
45.4% (414)Unmarried:
54.6% (497)
Marital status - Two or more races population 15 years and over
Males 41.4% Never married42.4% Now married4.2% Separated3.4% Widowed8.5% DivorcedFemales 26.9% Never married37.8% Now married4.8% Separated8.8% Widowed21.7% DivorcedWomen who gave birth in the past 12 months Now married:
51.8% (56)Unmarried:
48.2% (52)
Women who did not give birth in the past 12 months Now married:
38.0% (388)Unmarried:
62.0% (632)
Marital status - White alone, not Hispanic / Latino population 15 years and over
Males 26.9% Never married46.0% Now married1.3% Separated4.7% Widowed21.0% DivorcedFemales 19.7% Never married38.1% Now married2.4% Separated20.6% Widowed19.1% DivorcedWomen who gave birth in the past 12 months Now married:
80.9% (56)Unmarried:
19.1% (13)
Women who did not give birth in the past 12 months Now married:
36.9% (889)Unmarried:
63.1% (1,520)
Marital status - Hispanic or Latino population 15 years and over
Males 41.7% Never married43.7% Now married4.2% Separated2.6% Widowed7.9% DivorcedFemales 36.2% Never married40.4% Now married3.2% Separated3.9% Widowed16.2% DivorcedWomen who gave birth in the past 12 months Now married:
49.6% (130)Unmarried:
50.4% (132)
Women who did not give birth in the past 12 months Now married:
35.9% (1,014)Unmarried:
64.1% (1,808)
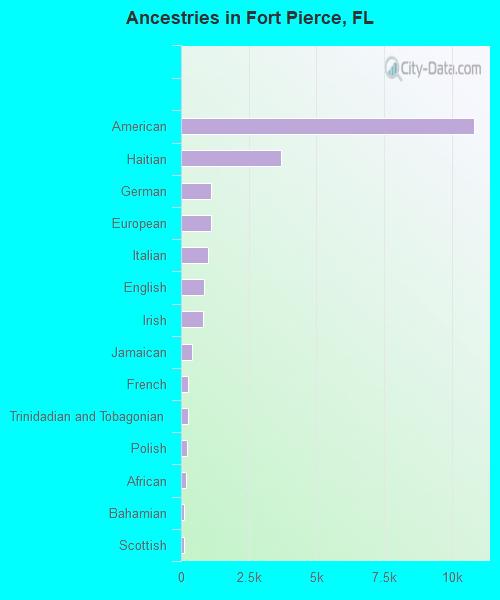
Ancestries in Fort Pierce
10,839 31.4% American3,712 10.7% Haitian1,122 3.2% German1,113 3.2% European1,004 2.9% Italian863 2.5% English829 2.4% Irish407 1.2% Jamaican251 0.7% French242 0.7% Trinidadian and Tobagonian204 0.6% Polish203 0.6% African129 0.4% Bahamian123 0.4% Scottish98 0.3% South African86 0.2% French Canadian80 0.2% Brazilian56 0.2% Slavic54 0.2% Norwegian51 0.1% Swedish40 0.1% British39 0.1% Iranian32 0.09% Scotch-Irish29 0.08% Turkish28 0.08% Northern European28 0.08% Guyanese25 0.07% Eastern European23 0.07% Canadian22 0.06% Dutch18 0.05% Russian18 0.05% West Indian17 0.05% Maltese16 0.05% British West Indian15 0.04% Austrian13 0.04% Greek11 0.03% Welsh
Geographical mobility in Fort Pierce Same house 1 year ago 17,584 90.3% White (Caucasian)18,497 81.4% Black or African American395 98.9% American Indian / Alaska Native768 100.0% Asian2,764 92.8% Other race3,991 92.0% Two or more races13,963 88.8% White alone, not Hispanic / Latino10,456 95.9% Hispanic or LatinoMoved within same county 817 4.2% White / Caucasian1,929 8.5% Black or African American25 0.8% Other race227 5.2% Two or more races745 4.7% White alone, not Hispanic / Latino232 2.1% Hispanic or LatinoMoved within same state 358 1.8% White / Caucasian714 3.1% Black or African American14 3.6% American Indian / Alaska Native8 0.3% Other race341 2.2% White alone, not Hispanic / Latino14 0.1% Hispanic or LatinoMoved from different state 715 3.7% White / Caucasian510 2.2% Black or African American200 6.7% Other race200 4.6% Two or more races727 4.6% White alone, not Hispanic / Latino312 2.9% Hispanic or LatinoMoved from abroad 28 0.1% White10 0.3% Other race22 0.2% Hispanic or Latino
Children Nativity (place of birth) in Fort Pierce
Children under 6 years - Living with two parents Both parents native 6 100.0% NativeBoth parents foreign-born 1,164 100.0% NativeOne native, one foreign-born parent 211 100.0% NativeChildren under 6 years - Living with one parent Native parent 2,335 100.0% NativeForeign-born parent 147 45.2% Native179 54.8% Foreign-bornChildren 6 to 17 years - Living with two parents Both parents native 1,050 100.0% NativeBoth parents foreign-born 611 44.0% Native778 56.0% Foreign-bornOne native, one foreign-born parent 194 100.0% NativeChildren 6 to 17 years - Living with one parent Native parent 3,454 100.0% NativeForeign-born parent 1,088 49.3% Native1,118 50.7% Foreign-born
Grandparents responsible for own grandchildren in Fort Pierce
Grandparents (30 to 59 years) White / Caucasian 80 43.0% Responsible for grandchildren106 57.0% Not responsible for grandchildrenBlack or African American 29 20.1% Responsible for grandchildren115 79.9% Not responsible for grandchildrenTwo or more races 80 100.0% Not responsible for grandchildrenWhite alone, not Hispanic / Latino 82 56.4% Responsible for grandchildren63 43.6% Not responsible for grandchildrenHispanic or Latino 100 100.0% Not responsible for grandchildrenGrandparents (60 years and over) White / Caucasian 69 39.1% Responsible for grandchildren108 60.9% Not responsible for grandchildrenBlack or African American 84 23.9% Responsible for grandchildren269 76.1% Not responsible for grandchildrenTwo or more races 25 100.0% Responsible for grandchildrenWhite alone, not Hispanic / Latino 53 41.4% Responsible for grandchildren75 58.6% Not responsible for grandchildrenHispanic or Latino 16 15.9% Responsible for grandchildren86 84.1% Not responsible for grandchildren