Races in Fort Wayne, Indiana (IN) Detailed Stats
Data:
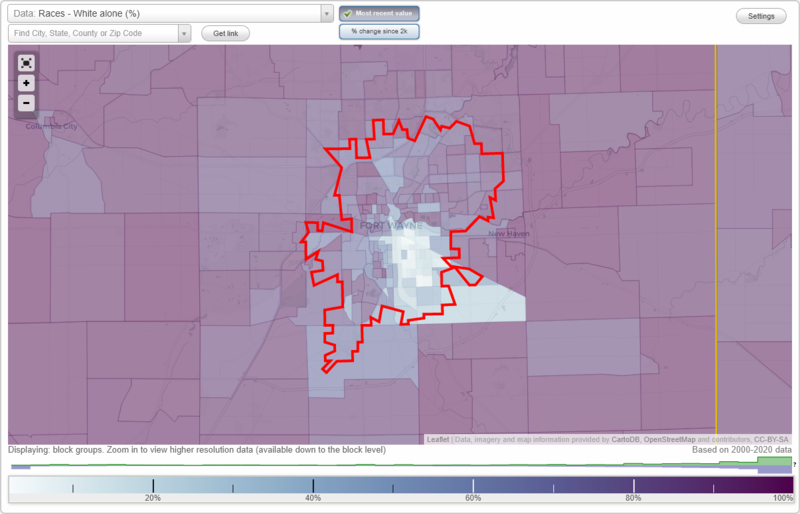
Races - White alone (%)
Races - White alone (% change since 2000)
Races - Black alone (%)
Races - Black alone (% change since 2000)
Races - American Indian alone (%)
Races - American Indian alone (% change since 2000)
Races - Asian alone (%)
Races - Asian alone (% change since 2000)
Races - Hispanic (%)
Races - Hispanic (% change since 2000)
Races - Native Hawaiian and Other Pacific Islander alone (%)
Races - Native Hawaiian and Other Pacific Islander alone (% change since 2000)
Races - Two or more races(%)
Races - Two or more races(% change since 2000)
Races - Other race alone (%)
Races - Other race alone (% change since 2000)
Racial diversity
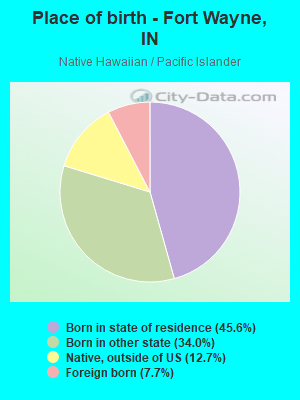
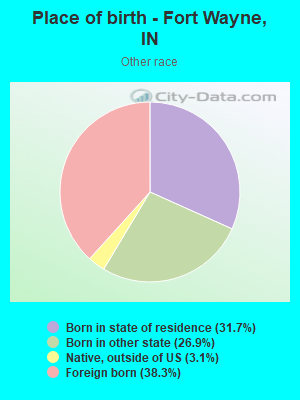
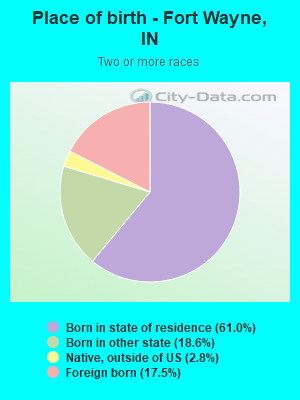
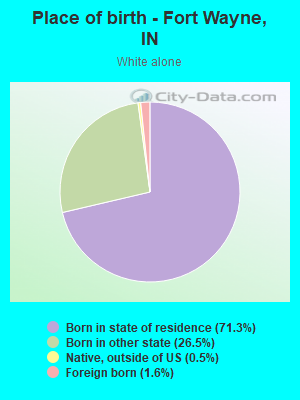
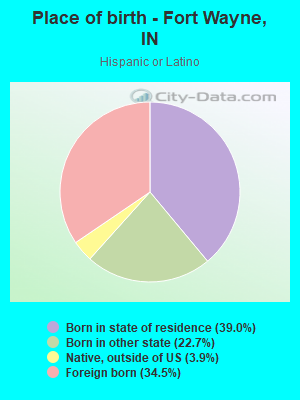
Place of birth - Born in state of residence (%)
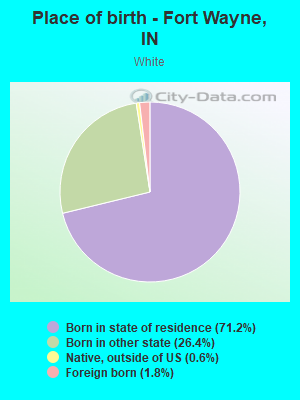
Place of birth - Born in state of residence (%) - White
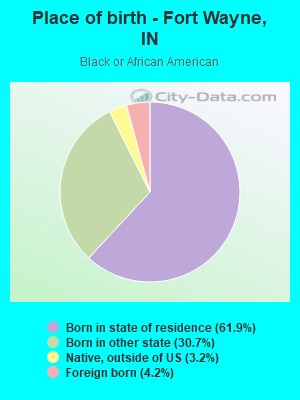
Place of birth - Born in state of residence (%) - Black or African American
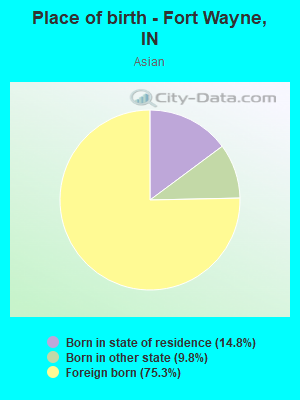
Place of birth - Born in state of residence (%) - Asian
Place of birth - Born in state of residence (%) - Hispanic or Latino
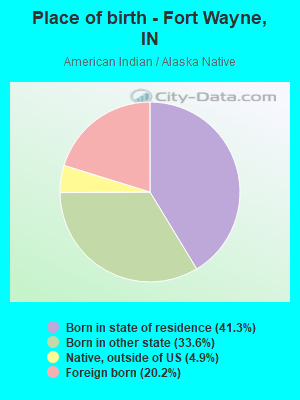
Place of birth - Born in state of residence (%) - American Indian and Alaska Native
Place of birth - Born in state of residence (%) - Multirace
Place of birth - Born in state of residence (%) - Other Race
Place of birth - Born in other state (%)
Place of birth - Born in other state (%) - White
Place of birth - Born in other state (%) - Black or African American
Place of birth - Born in other state (%) - Asian
Place of birth - Born in other state (%) - Hispanic or Latino
Place of birth - Born in other state (%) - American Indian and Alaska Native
Place of birth - Born in other state (%) - Multirace
Place of birth - Born in other state (%) - Other Race
Place of birth - Native, outside of US (%)
Place of birth - Native, outside of US (%) - White
Place of birth - Native, outside of US (%) - Black or African American
Place of birth - Native, outside of US (%) - Asian
Place of birth - Native, outside of US (%) - Hispanic or Latino
Place of birth - Native, outside of US (%) - American Indian and Alaska Native
Place of birth - Native, outside of US (%) - Multirace
Place of birth - Native, outside of US (%) - Other Race
Place of birth - Foreign born (%)
Place of birth - Foreign born (%) - White
Place of birth - Foreign born (%) - Black or African American
Place of birth - Foreign born (%) - Asian
Place of birth - Foreign born (%) - Hispanic or Latino
Place of birth - Foreign born (%) - American Indian and Alaska Native
Place of birth - Foreign born (%) - Multirace
Place of birth - Foreign born (%) - Other Race
Residents speaking English at home (%)
Residents speaking English at home - Born in the United States (%)
Residents speaking English at home - Native, born elsewhere (%)
Residents speaking English at home - Foreign born (%)
Residents speaking Spanish at home (%)
Residents speaking Spanish at home - Born in the United States (%)
Residents speaking Spanish at home - Native, born elsewhere (%)
Residents speaking Spanish at home - Foreign born (%)
Residents speaking other language at home (%)
Residents speaking other language at home - Born in the United States (%)
Residents speaking other language at home - Native, born elsewhere (%)
Residents speaking other language at home - Foreign born (%)
Marital status - Never married (%)
Marital status - Now married (%)
Marital status - Separated (%)
Marital status - Widowed (%)
Marital status - Divorced (%)
Ancestries Reported - Arab (%)
Ancestries Reported - Czech (%)
Ancestries Reported - Danish (%)
Ancestries Reported - Dutch (%)
Ancestries Reported - English (%)
Ancestries Reported - French (%)
Ancestries Reported - French Canadian (%)
Ancestries Reported - German (%)
Ancestries Reported - Greek (%)
Ancestries Reported - Hungarian (%)
Ancestries Reported - Irish (%)
Ancestries Reported - Italian (%)
Ancestries Reported - Lithuanian (%)
Ancestries Reported - Norwegian (%)
Ancestries Reported - Polish (%)
Ancestries Reported - Portuguese (%)
Ancestries Reported - Russian (%)
Ancestries Reported - Scotch-Irish (%)
Ancestries Reported - Scottish (%)
Ancestries Reported - Slovak (%)
Ancestries Reported - Subsaharan African (%)
Ancestries Reported - Swedish (%)
Ancestries Reported - Swiss (%)
Ancestries Reported - Ukrainian (%)
Ancestries Reported - United States (%)
Ancestries Reported - Welsh (%)
Ancestries Reported - West Indian (%)
Ancestries Reported - Other (%)
Geographical mobility - Same house 1 year ago (%)
Geographical mobility - Same house 1 year ago (%) - White
Geographical mobility - Same house 1 year ago (%) - Black or African American
Geographical mobility - Same house 1 year ago (%) - Asian
Geographical mobility - Same house 1 year ago (%) - Hispanic or Latino
Geographical mobility - Same house 1 year ago (%) - American Indian and Alaska Native
Geographical mobility - Same house 1 year ago (%) - Multirace
Geographical mobility - Same house 1 year ago (%) - Other Race
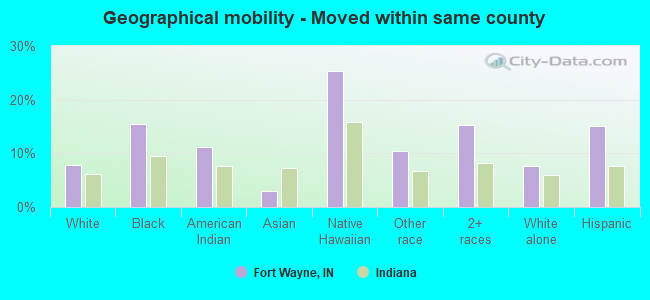
Geographical mobility - Moved within same county (%)
Geographical mobility - Moved within same county (%) - White
Geographical mobility - Moved within same county (%) - Black or African American
Geographical mobility - Moved within same county (%) - Asian
Geographical mobility - Moved within same county (%) - Hispanic or Latino
Geographical mobility - Moved within same county (%) - American Indian and Alaska Native
Geographical mobility - Moved within same county (%) - Multirace
Geographical mobility - Moved within same county (%) - Other Race
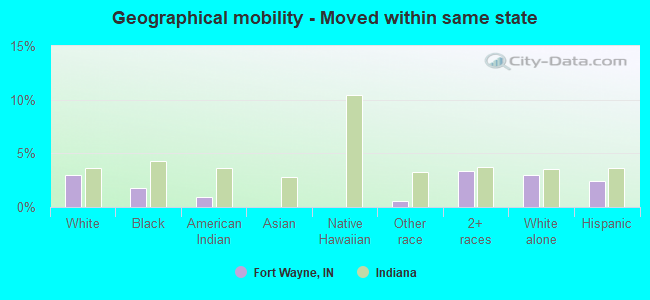
Geographical mobility - Moved from different county within same state (%)
Geographical mobility - Moved from different county within same state (%) - White
Geographical mobility - Moved from different county within same state (%) - Black or African American
Geographical mobility - Moved from different county within same state (%) - Asian
Geographical mobility - Moved from different county within same state (%) - Hispanic or Latino
Geographical mobility - Moved from different county within same state (%) - American Indian and Alaska Native
Geographical mobility - Moved from different county within same state (%) - Multirace
Geographical mobility - Moved from different county within same state (%) - Other Race
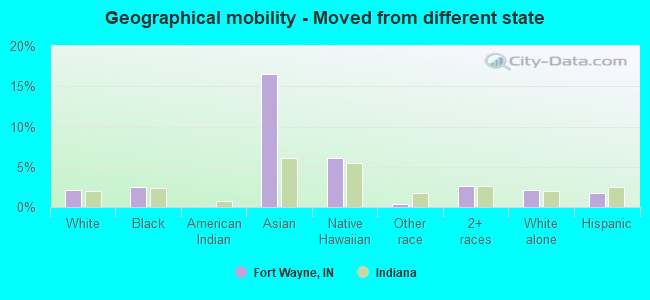
Geographical mobility - Moved from different state (%)
Geographical mobility - Moved from different state (%) - White
Geographical mobility - Moved from different state (%) - Black or African American
Geographical mobility - Moved from different state (%) - Asian
Geographical mobility - Moved from different state (%) - Hispanic or Latino
Geographical mobility - Moved from different state (%) - American Indian and Alaska Native
Geographical mobility - Moved from different state (%) - Multirace
Geographical mobility - Moved from different state (%) - Other Race
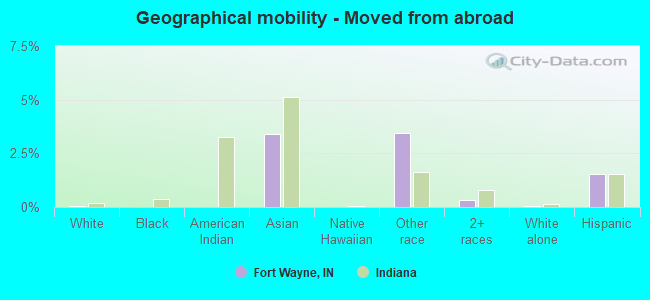
Geographical mobility - Moved from abroad (%)
Geographical mobility - Moved from abroad (%) - White
Geographical mobility - Moved from abroad (%) - Black or African American
Geographical mobility - Moved from abroad (%) - Asian
Geographical mobility - Moved from abroad (%) - Hispanic or Latino
Geographical mobility - Moved from abroad (%) - American Indian and Alaska Native
Geographical mobility - Moved from abroad (%) - Multirace
Geographical mobility - Moved from abroad (%) - Other Race
Place of birth for the foreign-born population - Ireland (%)
Place of birth for the foreign-born population - Denmark (%)
Place of birth for the foreign-born population - Norway (%)
Place of birth for the foreign-born population - Sweden (%)
Place of birth for the foreign-born population - United Kingdom (%)
Place of birth for the foreign-born population - England (%)
Place of birth for the foreign-born population - Scotland (%)
Place of birth for the foreign-born population - Other Northern Europe (%)
Place of birth for the foreign-born population - Austria (%)
Place of birth for the foreign-born population - Belgium (%)
Place of birth for the foreign-born population - France (%)
Place of birth for the foreign-born population - Germany (%)
Place of birth for the foreign-born population - Netherlands (%)
Place of birth for the foreign-born population - Switzerland (%)
Place of birth for the foreign-born population - Other Western Europe (%)
Place of birth for the foreign-born population - Greece (%)
Place of birth for the foreign-born population - Italy (%)
Place of birth for the foreign-born population - Portugal (%)
Place of birth for the foreign-born population - Spain (%)
Place of birth for the foreign-born population - Other Southern Europe (%)
Place of birth for the foreign-born population - Albania (%)
Place of birth for the foreign-born population - Belarus (%)
Place of birth for the foreign-born population - Bosnia and Herzegovina (%)
Place of birth for the foreign-born population - Bulgaria (%)
Place of birth for the foreign-born population - Croatia (%)
Place of birth for the foreign-born population - Czechoslovakia (%)
Place of birth for the foreign-born population - Hungary (%)
Place of birth for the foreign-born population - Latvia (%)
Place of birth for the foreign-born population - Lithuania (%)
Place of birth for the foreign-born population - North Macedonia (Macedonia) (%)
Place of birth for the foreign-born population - Moldova (%)
Place of birth for the foreign-born population - Poland (%)
Place of birth for the foreign-born population - Romania (%)
Place of birth for the foreign-born population - Russia (%)
Place of birth for the foreign-born population - Serbia (%)
Place of birth for the foreign-born population - Ukraine (%)
Place of birth for the foreign-born population - Other Eastern Europe (%)
Place of birth for the foreign-born population - China (%)
Place of birth for the foreign-born population - Hong Kong (%)
Place of birth for the foreign-born population - Taiwan (%)
Place of birth for the foreign-born population - Japan (%)
Place of birth for the foreign-born population - Korea (%)
Place of birth for the foreign-born population - Other Eastern Asia (%)
Place of birth for the foreign-born population - Afghanistan (%)
Place of birth for the foreign-born population - Bangladesh (%)
Place of birth for the foreign-born population - India (%)
Place of birth for the foreign-born population - Iran (%)
Place of birth for the foreign-born population - Kazakhstan (%)
Place of birth for the foreign-born population - Nepal (%)
Place of birth for the foreign-born population - Pakistan (%)
Place of birth for the foreign-born population - Sri Lanka (%)
Place of birth for the foreign-born population - Uzbekistan (%)
Place of birth for the foreign-born population - Other South Central Asia (%)
Place of birth for the foreign-born population - Burma (%)
Place of birth for the foreign-born population - Cambodia (%)
Place of birth for the foreign-born population - Indonesia (%)
Place of birth for the foreign-born population - Laos (%)
Place of birth for the foreign-born population - Malaysia (%)
Place of birth for the foreign-born population - Philippines (%)
Place of birth for the foreign-born population - Singapore (%)
Place of birth for the foreign-born population - Thailand (%)
Place of birth for the foreign-born population - Vietnam (%)
Place of birth for the foreign-born population - Other South Eastern Asia (%)
Place of birth for the foreign-born population - Armenia (%)
Place of birth for the foreign-born population - Iraq (%)
Place of birth for the foreign-born population - Israel (%)
Place of birth for the foreign-born population - Jordan (%)
Place of birth for the foreign-born population - Kuwait (%)
Place of birth for the foreign-born population - Lebanon (%)
Place of birth for the foreign-born population - Saudi Arabia (%)
Place of birth for the foreign-born population - Syria (%)
Place of birth for the foreign-born population - Turkey (%)
Place of birth for the foreign-born population - Yemen (%)
Place of birth for the foreign-born population - Other Western Asia (%)
Place of birth for the foreign-born population - Eritrea (%)
Place of birth for the foreign-born population - Ethiopia (%)
Place of birth for the foreign-born population - Kenya (%)
Place of birth for the foreign-born population - Somalia (%)
Place of birth for the foreign-born population - Uganda (%)
Place of birth for the foreign-born population - Zimbabwe (%)
Place of birth for the foreign-born population - Other Eastern Africa (%)
Place of birth for the foreign-born population - Cameroon (%)
Place of birth for the foreign-born population - Congo (%)
Place of birth for the foreign-born population - Democratic Republic of Congo (Zaire) (%)
Place of birth for the foreign-born population - Other Middle Africa (%)
Place of birth for the foreign-born population - Egypt (%)
Place of birth for the foreign-born population - Morocco (%)
Place of birth for the foreign-born population - Sudan (%)
Place of birth for the foreign-born population - Other Northern Africa (%)
Place of birth for the foreign-born population - South Africa (%)
Place of birth for the foreign-born population - Other Southern Africa (%)
Place of birth for the foreign-born population - Cabo Verde (%)
Place of birth for the foreign-born population - Ghana (%)
Place of birth for the foreign-born population - Liberia (%)
Place of birth for the foreign-born population - Nigeria (%)
Place of birth for the foreign-born population - Senegal (%)
Place of birth for the foreign-born population - Sierra Leone (%)
Place of birth for the foreign-born population - Other Western Africa (%)
Place of birth for the foreign-born population - Australia (%)
Place of birth for the foreign-born population - New Zealand (%)
Place of birth for the foreign-born population - Fiji (%)
Place of birth for the foreign-born population - Micronesia (%)
Place of birth for the foreign-born population - Bahamas (%)
Place of birth for the foreign-born population - Barbados (%)
Place of birth for the foreign-born population - Cuba (%)
Place of birth for the foreign-born population - Dominica (%)
Place of birth for the foreign-born population - Dominican Republic (%)
Place of birth for the foreign-born population - Grenada (%)
Place of birth for the foreign-born population - Haiti (%)
Place of birth for the foreign-born population - Jamaica (%)
Place of birth for the foreign-born population - St. Vincent and the Grenadines (%)
Place of birth for the foreign-born population - Trinidad and Tobago (%)
Place of birth for the foreign-born population - West Indies (%)
Place of birth for the foreign-born population - Other Caribbean (%)
Place of birth for the foreign-born population - Belize (%)
Place of birth for the foreign-born population - Costa Rica (%)
Place of birth for the foreign-born population - El Salvador (%)
Place of birth for the foreign-born population - Guatemala (%)
Place of birth for the foreign-born population - Honduras (%)
Place of birth for the foreign-born population - Mexico (%)
Place of birth for the foreign-born population - Nicaragua (%)
Place of birth for the foreign-born population - Panama (%)
Place of birth for the foreign-born population - Other Central America (%)
Place of birth for the foreign-born population - Argentina (%)
Place of birth for the foreign-born population - Bolivia (%)
Place of birth for the foreign-born population - Brazil (%)
Place of birth for the foreign-born population - Chile (%)
Place of birth for the foreign-born population - Colombia (%)
Place of birth for the foreign-born population - Ecuador (%)
Place of birth for the foreign-born population - Guyana (%)
Place of birth for the foreign-born population - Peru (%)
Place of birth for the foreign-born population - Uruguay (%)
Place of birth for the foreign-born population - Venezuela (%)
Place of birth for the foreign-born population - Other South America (%)
Place of birth for the foreign-born population - Canada (%)
Place of birth for the foreign-born population - Other Northern America (%)
Place of birth for the foreign-born population - Other (%)
According to 2022 data, the most numerous races in Fort Wayne, IN are White alone (170,377 residents), Black alone (38,179 residents), and Hispanic (28,936 residents). 87.1% of Fort Wayne residents speak English at home. 9.4% of Fort Wayne, IN residents are foreign-born (4.3% born in Asia, 3.1% born in Latin America), which is 36.3% greater than the foreign-born rate of 6.0% across the entire state of Indiana.
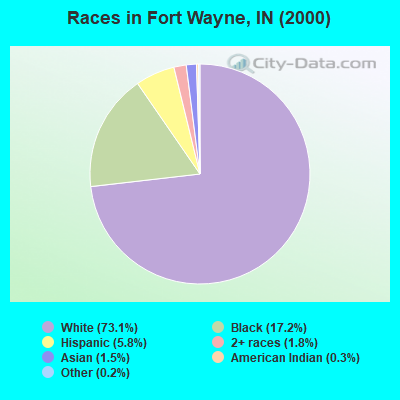
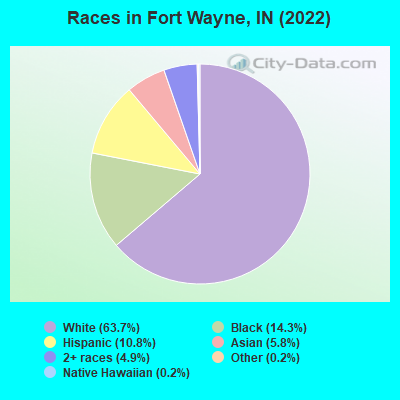
Race distribution in Fort Wayne
2000 2022
150,368 73.1% White alone 35,391 17.2% Black alone 11,884 5.8% Hispanic 3,732 1.8% Two or more races 3,156 1.5% Asian alone 653 0.3% American Indian alone 470 0.2% Other race alone 73 0.04% Native Hawaiian and Other
170,377 63.7% White alone 38,179 14.3% Black alone 28,936 10.8% Hispanic 15,446 5.8% Asian alone 13,131 4.9% Two or more races 571 0.2% Other race alone 564 0.2% Native Hawaiian and Other 232 0.09% American Indian alone
2000 2022
5,219,373 85.8% White alone 505,462 8.3% Black alone 214,536 3.5% Hispanic 61,115 1.0% Two or more races 58,424 1.0% Asian alone 13,654 0.2% American Indian alone 6,348 0.1% Other race alone 1,573 0.03% Native Hawaiian and Other
5,192,455 76.0% White alone 628,054 9.2% Black alone 534,528 7.8% Hispanic 263,242 3.9% Two or more races 172,880 2.5% Asian alone 33,467 0.5% Other race alone 5,866 0.09% American Indian alone 2,545 0.04% Native Hawaiian and Other
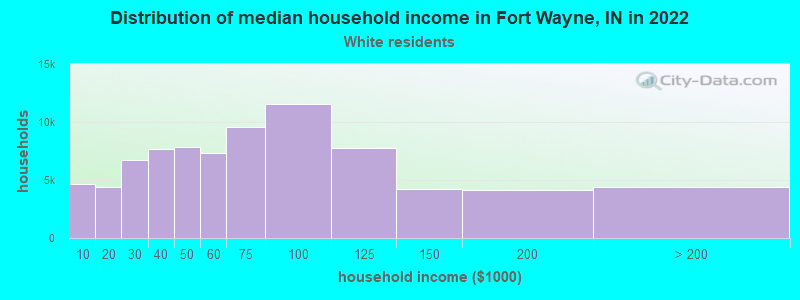
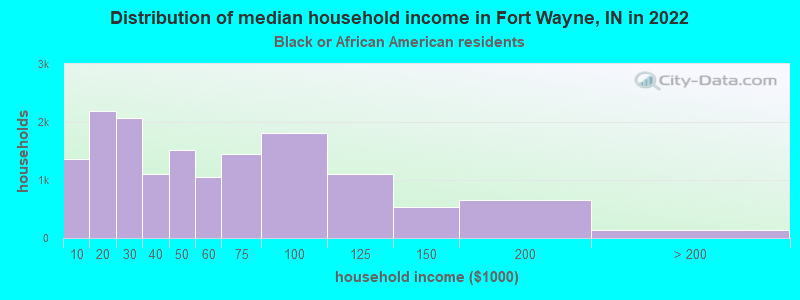
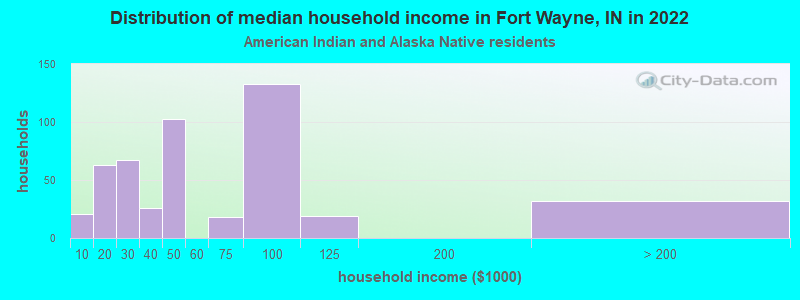
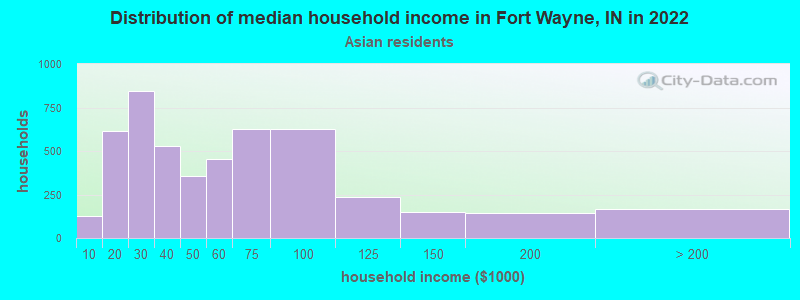
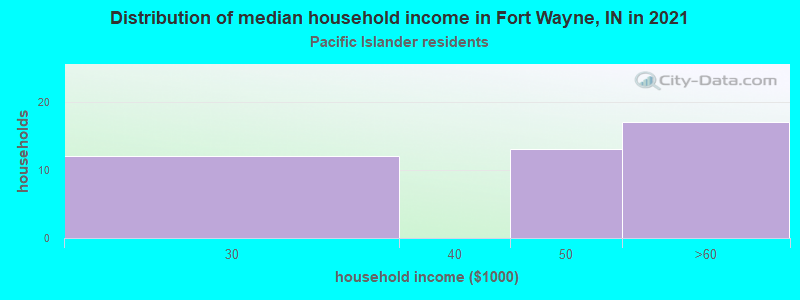
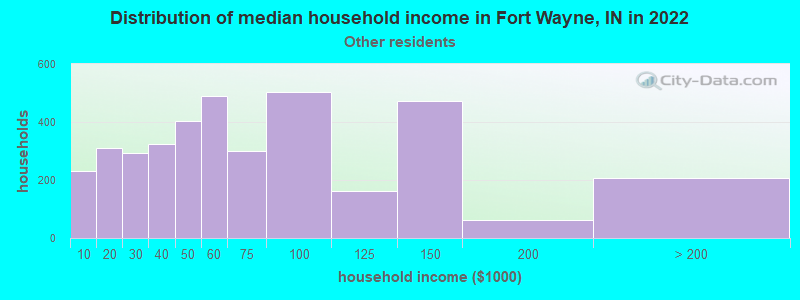
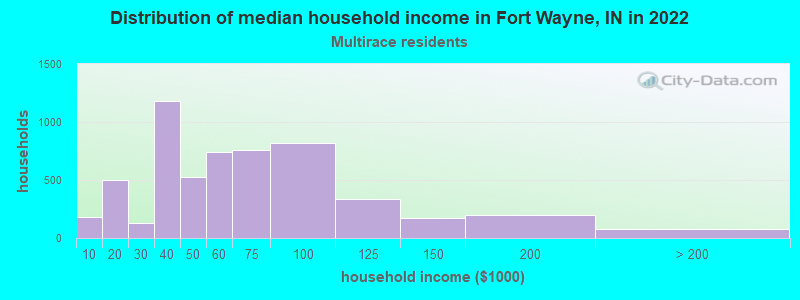
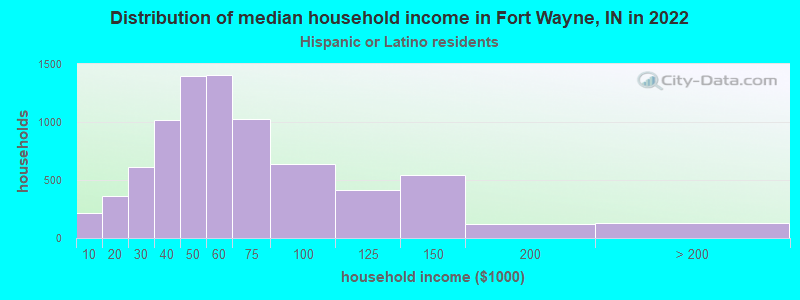
Income and house value in Fort Wayne Median household income in 2022 $62,079 White non-Hispanic householders$43,444 Black householders$43,654 American Indian and Alaska Native householders$55,199 Asian householders$56,726 Some other race householders$53,792 Two or more races householders$53,421 Hispanic or Latino race householdersMedian 2022 house value $183,521 White Non-Hispanic householders$138,057 Black or African American householders$159,718 American Indian or Alaska Native householders $196,612 Asian householders$154,719 Native Hawaiian and other Pacific Islander householders$148,292 Some other race householders$165,192 Two or more races householders$141,389 Hispanic or Latino householders
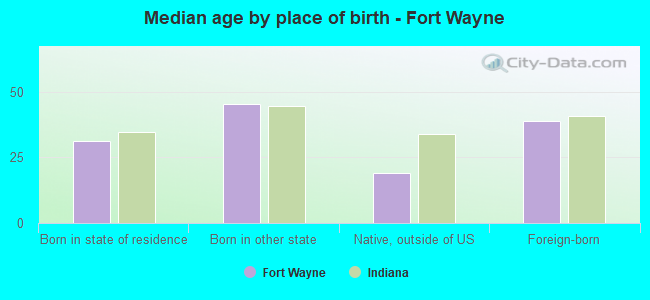
Median age by race in Fort Wayne
40.6 Median age for White residents39.0 42.4 31.4 Median age for Black or African American residents31.1 32.4 22.6 Median age for American Indian / Alaska Native residents36.6 19.6 27.0 Median age for Asian residents26.0 28.2 29.9 Median age for Native Hawaiian / Pacific Islander residents-666,666,666.0 29.9 26.2 Median age for Other race residents26.9 24.2 22.6 Median age for Two or more races residents22.0 24.4 40.9 Median age for White alone residents39.2 42.5 25.0 Median age for Hispanic or Latino residents25.5 24.5
Owner/renter occupied households by race in Fort Wayne
House owners and renters - White residents 55,984 69.8% Owner occupied24,208 30.2% Renter occupiedHouse owners and renters - Black or African American residents 4,934 32.9% Owner occupied10,043 67.1% Renter occupiedHouse owners and renters - American Indian / Alaska Native residents 252 36.4% Owner occupied440 63.6% Renter occupiedHouse owners and renters - Asian residents 2,586 57.3% Owner occupied1,929 42.7% Renter occupiedHouse owners and renters - Native Hawaiian / Pacific Islander residents 7 15.6% Owner occupied38 84.4% Renter occupiedHouse owners and renters - Other race residents 2,779 71.4% Owner occupied1,112 28.6% Renter occupiedHouse owners and renters - Two or more races residents 2,974 52.9% Owner occupied2,643 47.1% Renter occupiedHouse owners and renters - White alone residents 55,649 70.0% Owner occupied23,891 30.0% Renter occupiedHouse owners and renters - Hispanic or Latino residents 4,803 60.9% Owner occupied3,080 39.1% Renter occupied
Language usage in Fort Wayne
English speakers - Total 87.1% of residents of Fort Wayne speak English at home.
7.0% of residents speak Spanish at home 10,017 57.1% Speak English very well7,521 42.9% Speak English less than very well5.9% of residents speak other language at home 8,476 57.8% Speak English very well6,191 42.2% Speak English less than very well
English speakers - Born in the United States 92.2% of residents of Fort Wayne speak English at home.
5.9% of residents speak Spanish at home 3,377 85.1% Speak English very well590 14.9% Speak English less than very well1.8% of residents speak other language at home 876 71.5% Speak English very well349 28.5% Speak English less than very well
English speakers - Native, born elsewhere 76.6% of residents of Fort Wayne speak English at home.
20.1% of residents speak Spanish at home 388 66.0% Speak English very well200 34.0% Speak English less than very well3.3% of residents speak other language at home 90 93.8% Speak English very well6 6.2% Speak English less than very well
English speakers - Foreign-born 22.4% of residents of Fort Wayne speak English at home.
33.9% of residents speak Spanish at home 3,113 34.6% Speak English very well5,896 65.4% Speak English less than very well43.7% of residents speak other language at home 6,243 53.8% Speak English very well5,356 46.2% Speak English less than very well
White (Caucasian) - Speak only English Native:
98.7% (158,130)Foreign-born:
28.4% (899)
White (Caucasian) - Speak another language Native:
1.3% (2,088)Foreign-born:
71.6% (2,264)
Black or African American - Speak only English Native:
97.6% (32,939)Foreign-born:
20.6% (626)
Black or African American - Speak another language Native:
2.3% (790)Foreign-born:
79.5% (2,414)
American Indian / Alaska Native - Speak only English Native:
52.9% (425)Foreign-born:
4.1% (9)
American Indian / Alaska Native - Speak another language Native:
51.7% (415)Foreign-born:
97.0% (211)
Asian - Speak only English Native:
32.7% (768)Foreign-born:
20.1% (2,355)
Asian - Speak another language Native:
67.3% (1,578)Foreign-born:
79.9% (9,370)
Native Hawaiian / Pacific Islander - Speak another language Native:
25.1% (31)Foreign-born:
100.0% (19)
Other race - Speak only English Native:
44.8% (3,397)Foreign-born:
16.8% (871)
Other race - Speak another language Native:
55.2% (4,192)Foreign-born:
83.2% (4,302)
Two or more races - Speak only English Native:
81.8% (14,014)Foreign-born:
11.7% (505)
Two or more races - Speak another language Native:
18.2% (3,120)Foreign-born:
88.3% (3,827)
White alone - Speak only English Native:
98.9% (156,720)Foreign-born:
32.1% (899)
White alone - Speak another language Native:
1.1% (1,797)Foreign-born:
67.9% (1,905)
Hispanic or Latino - Speak only English Native:
52.5% (8,495)Foreign-born:
11.8% (1,178)
Hispanic or Latino - Speak another language Native:
47.5% (7,686)Foreign-born:
88.2% (8,804)
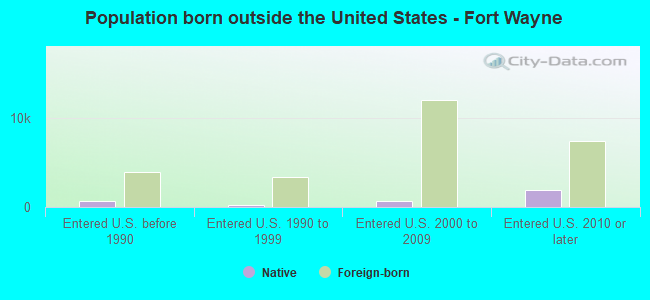
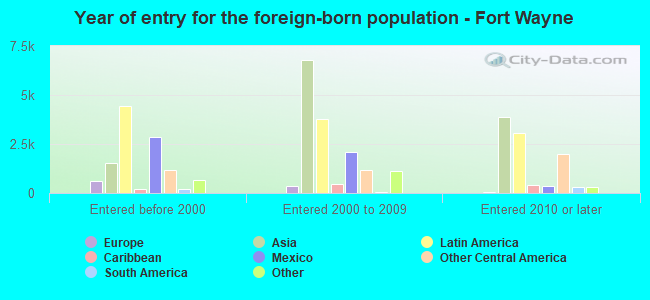
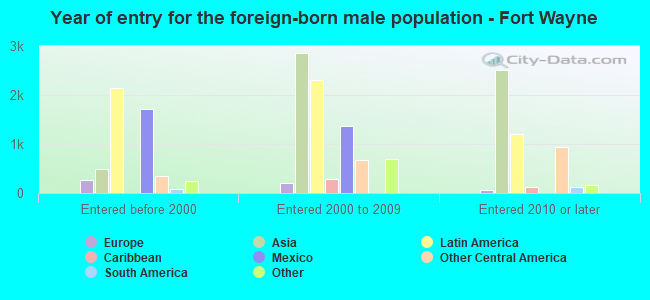
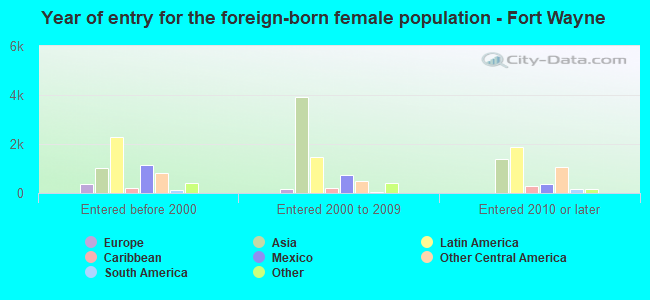
Foreign-born residents in Fort Wayne 25,309 residents are foreign born (4.3% Asia , 3.1% Latin America ).
This city:
9.4%Indiana:
5.6%
Marital status for residents in Fort Wayne Marital status - White (Caucasian) population 15 years and over
Males 33.0% Never married49.0% Now married1.0% Separated3.6% Widowed13.3% DivorcedFemales 28.6% Never married46.0% Now married0.6% Separated10.6% Widowed14.2% DivorcedWomen who gave birth in the past 12 months Now married:
82.0% (2,141)Unmarried:
18.0% (470)
Women who did not give birth in the past 12 months Now married:
41.2% (15,036)Unmarried:
58.8% (21,459)
Marital status - Black or African American population 15 years and over
Males 55.0% Never married33.4% Now married1.1% Separated2.4% Widowed8.1% DivorcedFemales 56.1% Never married22.1% Now married2.4% Separated9.6% Widowed9.7% DivorcedWomen who gave birth in the past 12 months Now married:
23.4% (162)Unmarried:
76.6% (532)
Women who did not give birth in the past 12 months Now married:
21.5% (2,048)Unmarried:
78.5% (7,500)
Marital status - American Indian / Alaska Native population 15 years and over
Males 55.7% Never married32.2% Now married0.0% Separated0.0% Widowed12.1% DivorcedFemales 62.6% Never married23.5% Now married0.0% Separated8.3% Widowed5.5% DivorcedWomen who gave birth in the past 12 months Now married:
100.0% (2)Unmarried:
0.0% (0)
Women who did not give birth in the past 12 months Now married:
14.0% (68)Unmarried:
86.0% (420)
Marital status - Asian population 15 years and over
Males 37.3% Never married59.7% Now married0.0% Separated0.0% Widowed3.0% DivorcedFemales 33.6% Never married51.8% Now married2.5% Separated9.8% Widowed2.3% DivorcedWomen who gave birth in the past 12 months Now married:
78.1% (402)Unmarried:
21.9% (113)
Women who did not give birth in the past 12 months Now married:
55.2% (2,379)Unmarried:
44.8% (1,934)
Marital status - Native Hawaiian / Pacific Islander population 15 years and over
Males 100.0% Never married0.0% Now married0.0% Separated0.0% Widowed0.0% DivorcedFemales 60.0% Never married22.0% Now married0.0% Separated0.0% Widowed18.0% DivorcedWomen who gave birth in the past 12 months Now married:
0.0% (0)Unmarried:
100.0% (15)
Women who did not give birth in the past 12 months Now married:
11.5% (6)Unmarried:
88.5% (48)
Marital status - Other race population 15 years and over
Males 50.3% Never married40.0% Now married0.6% Separated0.0% Widowed9.1% DivorcedFemales 41.9% Never married46.1% Now married1.5% Separated2.4% Widowed8.1% DivorcedWomen who gave birth in the past 12 months Now married:
24.8% (133)Unmarried:
75.2% (403)
Women who did not give birth in the past 12 months Now married:
42.6% (1,240)Unmarried:
57.4% (1,672)
Marital status - Two or more races population 15 years and over
Males 52.9% Never married33.8% Now married0.0% Separated1.2% Widowed12.1% DivorcedFemales 45.0% Never married36.0% Now married4.4% Separated4.0% Widowed10.7% DivorcedWomen who gave birth in the past 12 months Now married:
16.5% (73)Unmarried:
83.5% (370)
Women who did not give birth in the past 12 months Now married:
36.9% (2,006)Unmarried:
63.1% (3,431)
Marital status - White alone, not Hispanic / Latino population 15 years and over
Males 33.1% Never married48.8% Now married1.0% Separated3.6% Widowed13.5% DivorcedFemales 28.4% Never married46.0% Now married0.6% Separated10.6% Widowed14.3% DivorcedWomen who gave birth in the past 12 months Now married:
84.8% (2,141)Unmarried:
15.2% (383)
Women who did not give birth in the past 12 months Now married:
41.1% (14,833)Unmarried:
58.9% (21,216)
Marital status - Hispanic or Latino population 15 years and over
Males 43.7% Never married44.3% Now married0.3% Separated0.6% Widowed11.1% DivorcedFemales 44.2% Never married44.6% Now married3.6% Separated2.4% Widowed5.2% DivorcedWomen who gave birth in the past 12 months Now married:
21.1% (206)Unmarried:
78.9% (769)
Women who did not give birth in the past 12 months Now married:
43.2% (2,853)Unmarried:
56.8% (3,747)
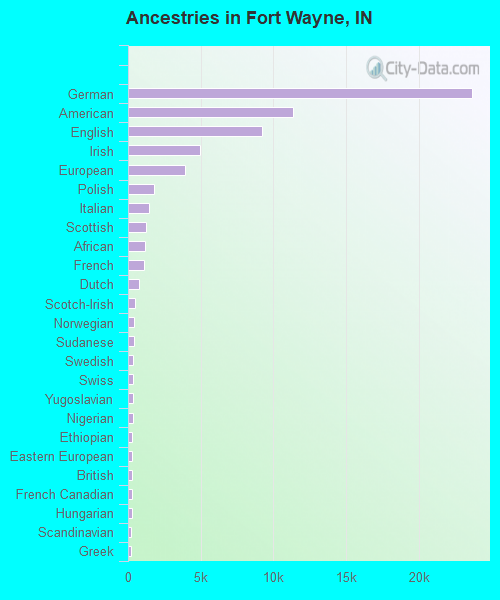
Ancestries in Fort Wayne
23,660 18.2% German11,338 8.7% American9,226 7.1% English4,972 3.8% Irish3,948 3.0% European1,802 1.4% Polish1,442 1.1% Italian1,242 1.0% Scottish1,189 0.9% African1,089 0.8% French774 0.6% Dutch496 0.4% Scotch-Irish431 0.3% Norwegian424 0.3% Sudanese363 0.3% Swedish363 0.3% Swiss346 0.3% Yugoslavian319 0.2% Nigerian309 0.2% Ethiopian300 0.2% Eastern European299 0.2% British281 0.2% French Canadian243 0.2% Hungarian234 0.2% Scandinavian222 0.2% Greek215 0.2% Croatian209 0.2% Northern European205 0.2% Kenyan196 0.2% German Russian193 0.1% Ukrainian183 0.1% Russian175 0.1% Macedonian173 0.1% Canadian172 0.1% Welsh170 0.1% Somali151 0.1% Serbian146 0.1% Danish145 0.1% Syrian126 0.10% Pennsylvania German110 0.08% Finnish105 0.08% Haitian88 0.07% Belgian86 0.07% Romanian77 0.06% Austrian74 0.06% Arab72 0.06% Slovak68 0.05% Portuguese64 0.05% Czech63 0.05% Latvian57 0.04% Lebanese52 0.04% West Indian51 0.04% Lithuanian50 0.04% Israeli49 0.04% South African47 0.04% Liberian44 0.03% Moroccan41 0.03% Jamaican38 0.03% Jordanian34 0.03% Trinidadian and Tobagonian32 0.02% Iraqi32 0.02% Slovene32 0.02% Afghan32 0.02% British West Indian26 0.02% Luxembourger21 0.02% Bulgarian21 0.02% Albanian18 0.01% Brazilian17 0.01% Basque16 0.01% Slavic14 0.01% Palestinian10 0.01% Czechoslovakian8 0.01% Bahamian7 0.01% Iranian
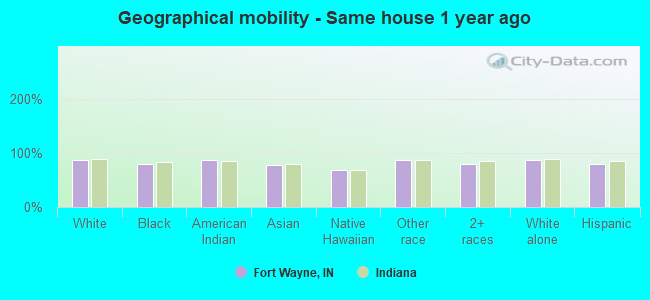
Geographical mobility in Fort Wayne Same house 1 year ago 148,538 87.0% White (Caucasian)30,918 80.2% Black or African American1,092 87.2% American Indian / Alaska Native11,829 77.0% Asian95 67.9% Native Hawaiian / Pacific Islander9,915 85.8% Other race18,449 78.4% Two or more races147,014 87.2% White alone, not Hispanic / Latino22,328 79.3% Hispanic or LatinoMoved within same county 13,354 7.8% White / Caucasian5,993 15.5% Black or African American140 11.2% American Indian / Alaska Native472 3.1% Asian35 25.3% Native Hawaiian / Pacific Islander1,205 10.4% Other race3,583 15.2% Two or more races12,982 7.7% White alone, not Hispanic / Latino4,236 15.0% Hispanic or LatinoMoved within same state 5,078 3.0% White / Caucasian666 1.7% Black or African American12 0.9% American Indian / Alaska Native65 0.6% Other race787 3.3% Two or more races4,954 2.9% White alone, not Hispanic / Latino690 2.4% Hispanic or LatinoMoved from different state 3,665 2.1% White / Caucasian976 2.5% Black or African American2,536 16.5% Asian8 6.1% Native Hawaiian / Pacific Islander49 0.4% Other race628 2.7% Two or more races3,504 2.1% White alone, not Hispanic / Latino482 1.7% Hispanic or LatinoMoved from abroad 58 0.0% White523 3.4% Asian396 3.4% Other race82 0.3% Two or more races58 0.0% White alone, not Hispanic / Latino428 1.5% Hispanic or Latino
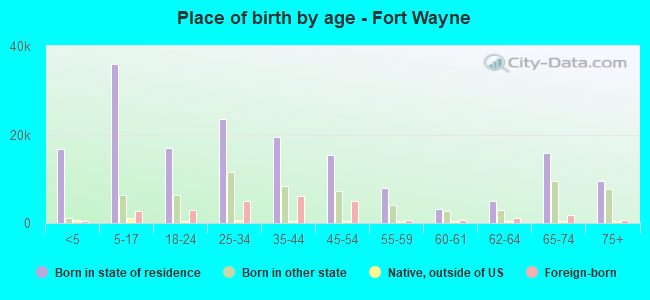
Children Nativity (place of birth) in Fort Wayne
Children under 6 years - Living with two parents Both parents native 9,825 100.0% NativeBoth parents foreign-born 2,519 98.7% Native34 1.3% Foreign-bornOne native, one foreign-born parent 736 100.0% NativeChildren under 6 years - Living with one parent Native parent 8,137 100.0% NativeForeign-born parent 631 100.0% NativeChildren 6 to 17 years - Living with two parents Both parents native 18,026 100.0% NativeBoth parents foreign-born 4,012 72.9% Native1,492 27.1% Foreign-bornOne native, one foreign-born parent 1,166 100.0% NativeChildren 6 to 17 years - Living with one parent Native parent 11,583 100.0% NativeForeign-born parent 2,530 57.7% Native1,857 42.3% Foreign-born
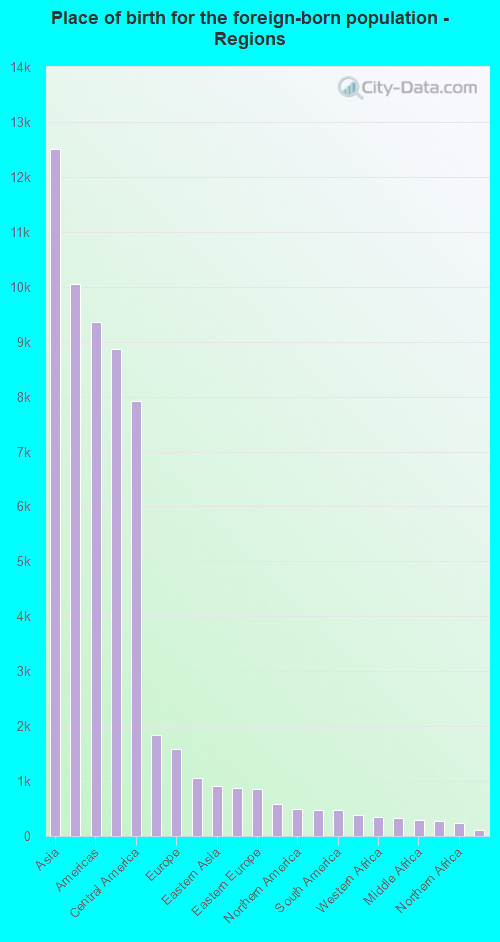
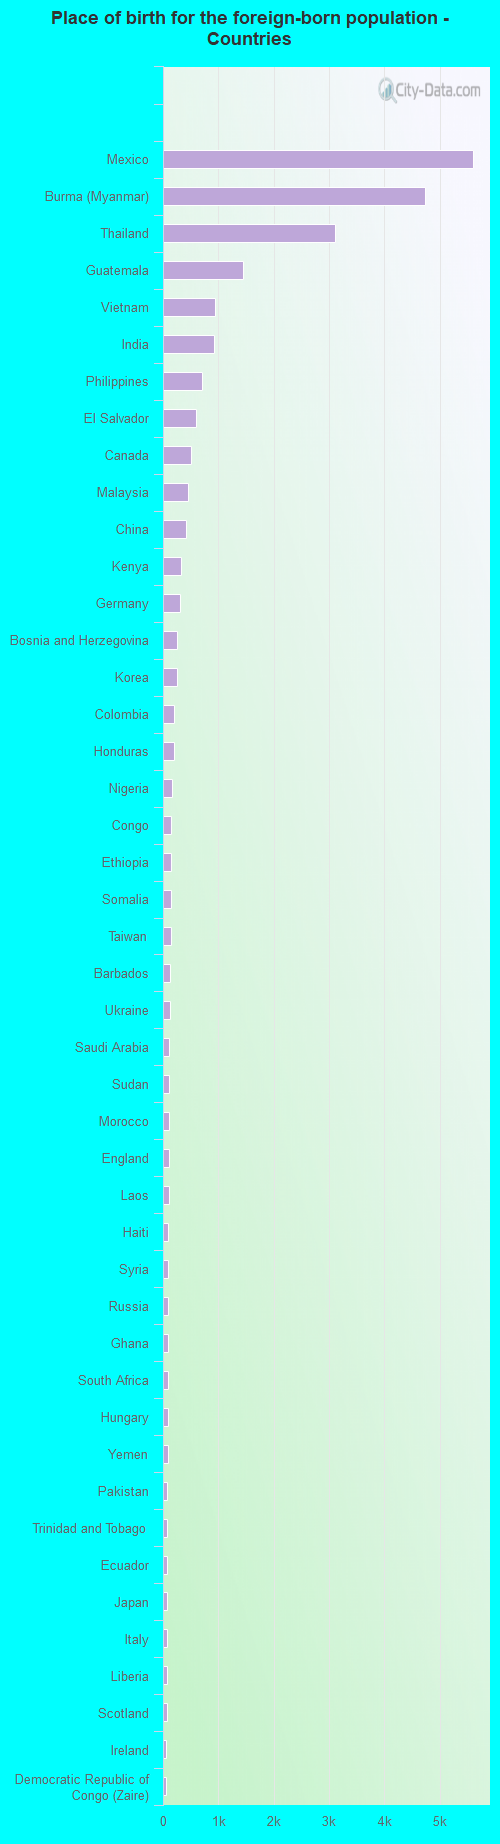
Place of birth for residents in Fort Wayne 12,515 Asia10,054 South Eastern Asia9,364 Americas8,864 Latin America7,921 Central America1,839 Africa1,589 Europe1,052 South Central Asia902 Eastern Asia876 Eastern Africa864 Eastern Europe581 China500 Northern America472 Caribbean470 South America388 Western Asia341 Western Africa336 Western Europe288 Middle Africa273 Northern Europe243 Northern Africa115 Southern Europe89 Southern Africa5,612 Mexico4,737 Burma (Myanmar)3,114 Thailand1,437 Guatemala932 Vietnam922 India704 Philippines605 El Salvador500 Canada446 Malaysia423 China331 Kenya299 Germany259 Bosnia and Herzegovina255 Korea206 Colombia200 Honduras170 Nigeria153 Congo153 Ethiopia146 Somalia140 Taiwan130 Barbados128 Ukraine116 Saudi Arabia110 Sudan105 Morocco102 England100 Laos98 Haiti91 Syria91 Russia89 Ghana89 South Africa88 Hungary87 Yemen80 Pakistan77 Trinidad and Tobago76 Ecuador65 Japan65 Italy64 Liberia64 Scotland63 Ireland55 Democratic Republic of Congo (Zaire)49 Greece47 Albania44 Jamaica44 Brazil42 Cuba40 Latvia40 Bolivia38 Bangladesh38 Argentina37 Bahamas36 Bulgaria36 Lebanon35 Romania35 Grenada32 Nicaragua31 Panama30 Venezuela29 Iraq27 Poland27 Algeria25 United Kingdom23 Croatia21 Belarus19 France18 Indonesia17 Switzerland17 Hong Kong16 Togo16 Guyana16 Peru15 Kuwait14 Uganda12 Israel12 Czechoslovakia10 Norway10 Serbia10 Zimbabwe7 Iran6 Denmark5 Dominican Republic2 Sri Lanka2 Kazakhstan
Grandparents responsible for own grandchildren in Fort Wayne
Grandparents (30 to 59 years) White / Caucasian 306 33.4% Responsible for grandchildren609 66.6% Not responsible for grandchildrenBlack or African American 185 50.5% Responsible for grandchildren182 49.5% Not responsible for grandchildrenAmerican Indian / Alaska Native 10 100.0% Not responsible for grandchildrenAsian 50 10.5% Responsible for grandchildren431 89.5% Not responsible for grandchildrenOther race 58 21.1% Responsible for grandchildren218 78.9% Not responsible for grandchildrenTwo or more races 119 52.7% Responsible for grandchildren107 47.3% Not responsible for grandchildrenWhite alone, not Hispanic / Latino 306 33.4% Responsible for grandchildren609 66.6% Not responsible for grandchildrenHispanic or Latino 194 39.1% Responsible for grandchildren302 60.9% Not responsible for grandchildrenGrandparents (60 years and over) White / Caucasian 585 40.9% Responsible for grandchildren846 59.1% Not responsible for grandchildrenBlack or African American 168 37.7% Responsible for grandchildren278 62.3% Not responsible for grandchildrenAmerican Indian / Alaska Native 4 100.0% Not responsible for grandchildrenAsian 83 14.1% Responsible for grandchildren507 85.9% Not responsible for grandchildrenOther race 69 100.0% Not responsible for grandchildrenTwo or more races 10 26.1% Responsible for grandchildren29 73.9% Not responsible for grandchildrenWhite alone, not Hispanic / Latino 585 40.9% Responsible for grandchildren846 59.1% Not responsible for grandchildrenHispanic or Latino 2 1.0% Responsible for grandchildren171 99.0% Not responsible for grandchildren
Zip codes: 46774 , 46802 , 46803 , 46804 , 46805 , 46806 , 46807 , 46808 , 46809 , 46814 , 46815 , 46816 , 46818 , 46819 , 46825 , 46835 , 46845 .