Races in Fountain Valley, California (CA) Detailed Stats
Data:
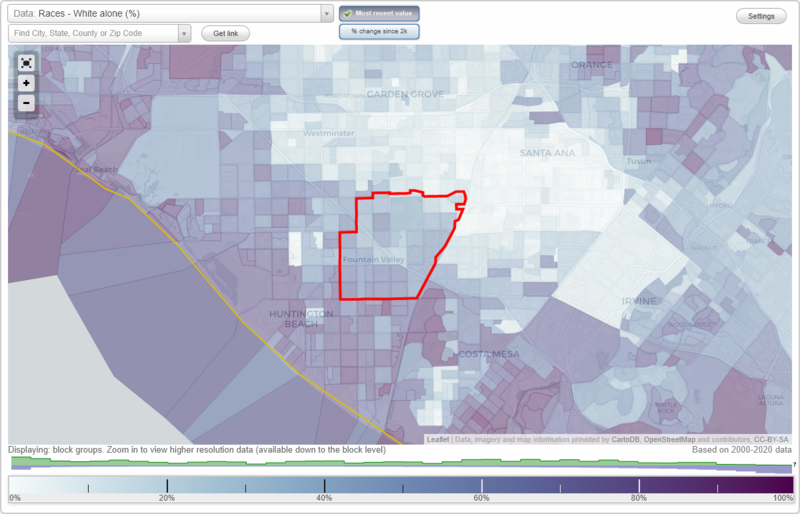
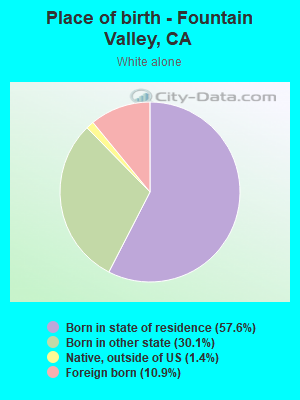
Races - White alone (%)
Races - White alone (% change since 2000)
Races - Black alone (%)
Races - Black alone (% change since 2000)
Races - American Indian alone (%)
Races - American Indian alone (% change since 2000)
Races - Asian alone (%)
Races - Asian alone (% change since 2000)
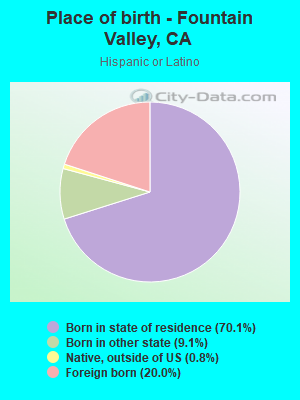
Races - Hispanic (%)
Races - Hispanic (% change since 2000)
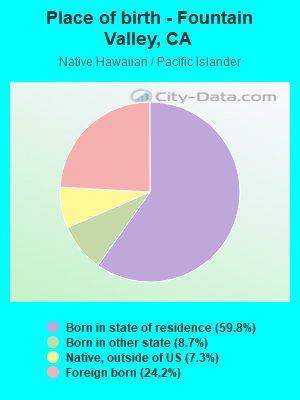
Races - Native Hawaiian and Other Pacific Islander alone (%)
Races - Native Hawaiian and Other Pacific Islander alone (% change since 2000)
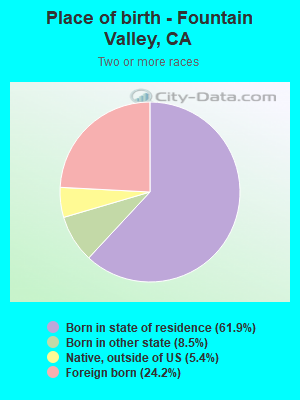
Races - Two or more races(%)
Races - Two or more races(% change since 2000)
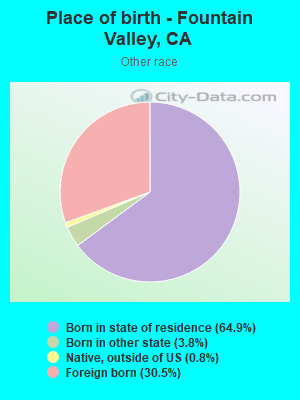
Races - Other race alone (%)
Races - Other race alone (% change since 2000)
Racial diversity
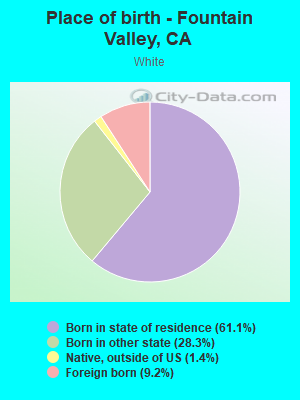
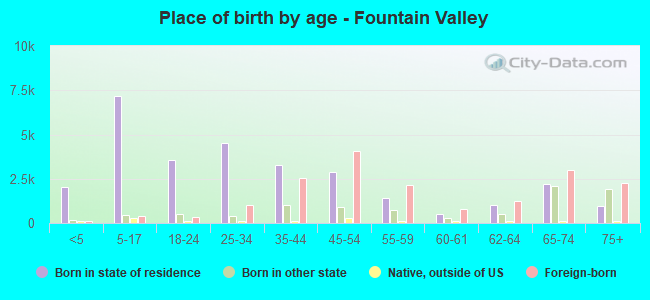
Place of birth - Born in state of residence (%)
Place of birth - Born in state of residence (%) - White
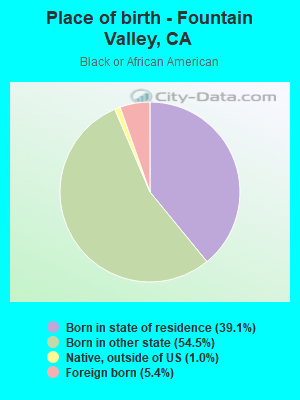
Place of birth - Born in state of residence (%) - Black or African American
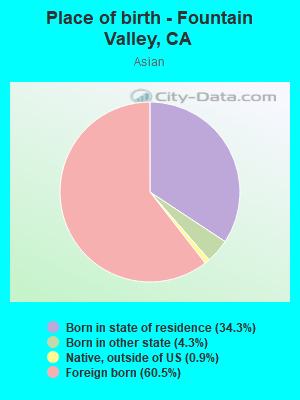
Place of birth - Born in state of residence (%) - Asian
Place of birth - Born in state of residence (%) - Hispanic or Latino
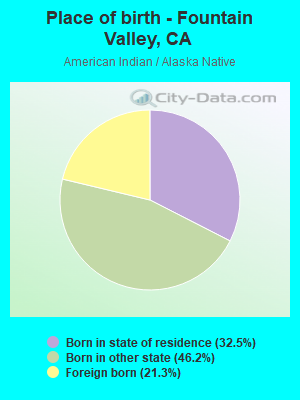
Place of birth - Born in state of residence (%) - American Indian and Alaska Native
Place of birth - Born in state of residence (%) - Multirace
Place of birth - Born in state of residence (%) - Other Race
Place of birth - Born in other state (%)
Place of birth - Born in other state (%) - White
Place of birth - Born in other state (%) - Black or African American
Place of birth - Born in other state (%) - Asian
Place of birth - Born in other state (%) - Hispanic or Latino
Place of birth - Born in other state (%) - American Indian and Alaska Native
Place of birth - Born in other state (%) - Multirace
Place of birth - Born in other state (%) - Other Race
Place of birth - Native, outside of US (%)
Place of birth - Native, outside of US (%) - White
Place of birth - Native, outside of US (%) - Black or African American
Place of birth - Native, outside of US (%) - Asian
Place of birth - Native, outside of US (%) - Hispanic or Latino
Place of birth - Native, outside of US (%) - American Indian and Alaska Native
Place of birth - Native, outside of US (%) - Multirace
Place of birth - Native, outside of US (%) - Other Race
Place of birth - Foreign born (%)
Place of birth - Foreign born (%) - White
Place of birth - Foreign born (%) - Black or African American
Place of birth - Foreign born (%) - Asian
Place of birth - Foreign born (%) - Hispanic or Latino
Place of birth - Foreign born (%) - American Indian and Alaska Native
Place of birth - Foreign born (%) - Multirace
Place of birth - Foreign born (%) - Other Race
Residents speaking English at home (%)
Residents speaking English at home - Born in the United States (%)
Residents speaking English at home - Native, born elsewhere (%)
Residents speaking English at home - Foreign born (%)
Residents speaking Spanish at home (%)
Residents speaking Spanish at home - Born in the United States (%)
Residents speaking Spanish at home - Native, born elsewhere (%)
Residents speaking Spanish at home - Foreign born (%)
Residents speaking other language at home (%)
Residents speaking other language at home - Born in the United States (%)
Residents speaking other language at home - Native, born elsewhere (%)
Residents speaking other language at home - Foreign born (%)
Marital status - Never married (%)
Marital status - Now married (%)
Marital status - Separated (%)
Marital status - Widowed (%)
Marital status - Divorced (%)
Ancestries Reported - Arab (%)
Ancestries Reported - Czech (%)
Ancestries Reported - Danish (%)
Ancestries Reported - Dutch (%)
Ancestries Reported - English (%)
Ancestries Reported - French (%)
Ancestries Reported - French Canadian (%)
Ancestries Reported - German (%)
Ancestries Reported - Greek (%)
Ancestries Reported - Hungarian (%)
Ancestries Reported - Irish (%)
Ancestries Reported - Italian (%)
Ancestries Reported - Lithuanian (%)
Ancestries Reported - Norwegian (%)
Ancestries Reported - Polish (%)
Ancestries Reported - Portuguese (%)
Ancestries Reported - Russian (%)
Ancestries Reported - Scotch-Irish (%)
Ancestries Reported - Scottish (%)
Ancestries Reported - Slovak (%)
Ancestries Reported - Subsaharan African (%)
Ancestries Reported - Swedish (%)
Ancestries Reported - Swiss (%)
Ancestries Reported - Ukrainian (%)
Ancestries Reported - United States (%)
Ancestries Reported - Welsh (%)
Ancestries Reported - West Indian (%)
Ancestries Reported - Other (%)
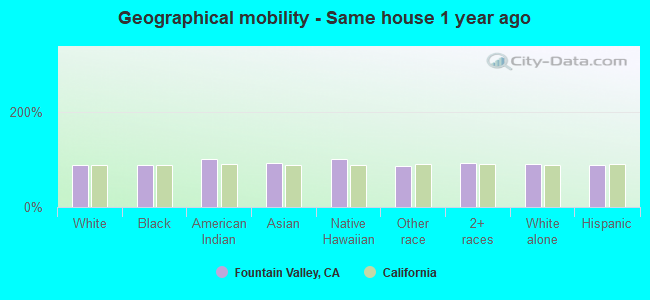
Geographical mobility - Same house 1 year ago (%)
Geographical mobility - Same house 1 year ago (%) - White
Geographical mobility - Same house 1 year ago (%) - Black or African American
Geographical mobility - Same house 1 year ago (%) - Asian
Geographical mobility - Same house 1 year ago (%) - Hispanic or Latino
Geographical mobility - Same house 1 year ago (%) - American Indian and Alaska Native
Geographical mobility - Same house 1 year ago (%) - Multirace
Geographical mobility - Same house 1 year ago (%) - Other Race
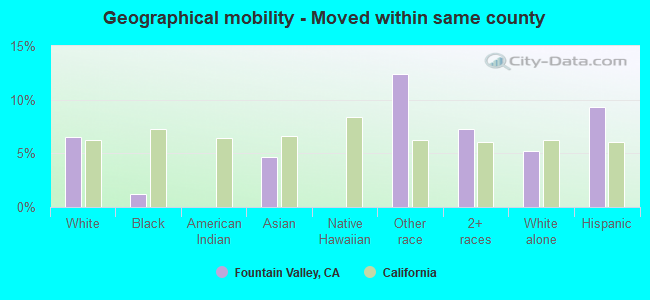
Geographical mobility - Moved within same county (%)
Geographical mobility - Moved within same county (%) - White
Geographical mobility - Moved within same county (%) - Black or African American
Geographical mobility - Moved within same county (%) - Asian
Geographical mobility - Moved within same county (%) - Hispanic or Latino
Geographical mobility - Moved within same county (%) - American Indian and Alaska Native
Geographical mobility - Moved within same county (%) - Multirace
Geographical mobility - Moved within same county (%) - Other Race
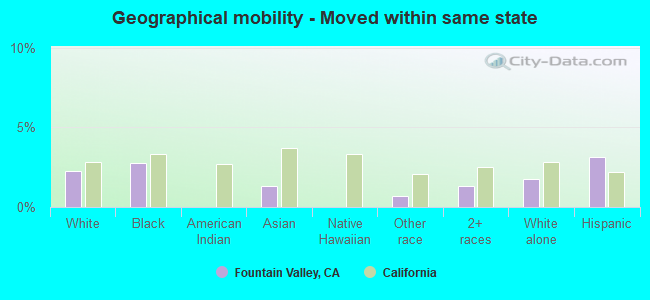
Geographical mobility - Moved from different county within same state (%)
Geographical mobility - Moved from different county within same state (%) - White
Geographical mobility - Moved from different county within same state (%) - Black or African American
Geographical mobility - Moved from different county within same state (%) - Asian
Geographical mobility - Moved from different county within same state (%) - Hispanic or Latino
Geographical mobility - Moved from different county within same state (%) - American Indian and Alaska Native
Geographical mobility - Moved from different county within same state (%) - Multirace
Geographical mobility - Moved from different county within same state (%) - Other Race
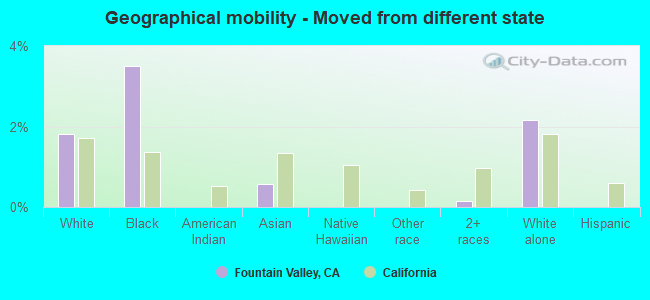
Geographical mobility - Moved from different state (%)
Geographical mobility - Moved from different state (%) - White
Geographical mobility - Moved from different state (%) - Black or African American
Geographical mobility - Moved from different state (%) - Asian
Geographical mobility - Moved from different state (%) - Hispanic or Latino
Geographical mobility - Moved from different state (%) - American Indian and Alaska Native
Geographical mobility - Moved from different state (%) - Multirace
Geographical mobility - Moved from different state (%) - Other Race
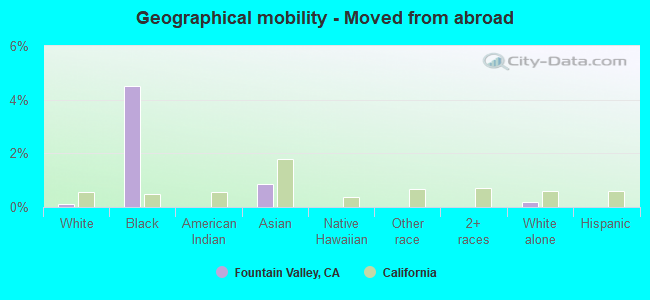
Geographical mobility - Moved from abroad (%)
Geographical mobility - Moved from abroad (%) - White
Geographical mobility - Moved from abroad (%) - Black or African American
Geographical mobility - Moved from abroad (%) - Asian
Geographical mobility - Moved from abroad (%) - Hispanic or Latino
Geographical mobility - Moved from abroad (%) - American Indian and Alaska Native
Geographical mobility - Moved from abroad (%) - Multirace
Geographical mobility - Moved from abroad (%) - Other Race
Place of birth for the foreign-born population - Ireland (%)
Place of birth for the foreign-born population - Denmark (%)
Place of birth for the foreign-born population - Norway (%)
Place of birth for the foreign-born population - Sweden (%)
Place of birth for the foreign-born population - United Kingdom (%)
Place of birth for the foreign-born population - England (%)
Place of birth for the foreign-born population - Scotland (%)
Place of birth for the foreign-born population - Other Northern Europe (%)
Place of birth for the foreign-born population - Austria (%)
Place of birth for the foreign-born population - Belgium (%)
Place of birth for the foreign-born population - France (%)
Place of birth for the foreign-born population - Germany (%)
Place of birth for the foreign-born population - Netherlands (%)
Place of birth for the foreign-born population - Switzerland (%)
Place of birth for the foreign-born population - Other Western Europe (%)
Place of birth for the foreign-born population - Greece (%)
Place of birth for the foreign-born population - Italy (%)
Place of birth for the foreign-born population - Portugal (%)
Place of birth for the foreign-born population - Spain (%)
Place of birth for the foreign-born population - Other Southern Europe (%)
Place of birth for the foreign-born population - Albania (%)
Place of birth for the foreign-born population - Belarus (%)
Place of birth for the foreign-born population - Bosnia and Herzegovina (%)
Place of birth for the foreign-born population - Bulgaria (%)
Place of birth for the foreign-born population - Croatia (%)
Place of birth for the foreign-born population - Czechoslovakia (%)
Place of birth for the foreign-born population - Hungary (%)
Place of birth for the foreign-born population - Latvia (%)
Place of birth for the foreign-born population - Lithuania (%)
Place of birth for the foreign-born population - North Macedonia (Macedonia) (%)
Place of birth for the foreign-born population - Moldova (%)
Place of birth for the foreign-born population - Poland (%)
Place of birth for the foreign-born population - Romania (%)
Place of birth for the foreign-born population - Russia (%)
Place of birth for the foreign-born population - Serbia (%)
Place of birth for the foreign-born population - Ukraine (%)
Place of birth for the foreign-born population - Other Eastern Europe (%)
Place of birth for the foreign-born population - China (%)
Place of birth for the foreign-born population - Hong Kong (%)
Place of birth for the foreign-born population - Taiwan (%)
Place of birth for the foreign-born population - Japan (%)
Place of birth for the foreign-born population - Korea (%)
Place of birth for the foreign-born population - Other Eastern Asia (%)
Place of birth for the foreign-born population - Afghanistan (%)
Place of birth for the foreign-born population - Bangladesh (%)
Place of birth for the foreign-born population - India (%)
Place of birth for the foreign-born population - Iran (%)
Place of birth for the foreign-born population - Kazakhstan (%)
Place of birth for the foreign-born population - Nepal (%)
Place of birth for the foreign-born population - Pakistan (%)
Place of birth for the foreign-born population - Sri Lanka (%)
Place of birth for the foreign-born population - Uzbekistan (%)
Place of birth for the foreign-born population - Other South Central Asia (%)
Place of birth for the foreign-born population - Burma (%)
Place of birth for the foreign-born population - Cambodia (%)
Place of birth for the foreign-born population - Indonesia (%)
Place of birth for the foreign-born population - Laos (%)
Place of birth for the foreign-born population - Malaysia (%)
Place of birth for the foreign-born population - Philippines (%)
Place of birth for the foreign-born population - Singapore (%)
Place of birth for the foreign-born population - Thailand (%)
Place of birth for the foreign-born population - Vietnam (%)
Place of birth for the foreign-born population - Other South Eastern Asia (%)
Place of birth for the foreign-born population - Armenia (%)
Place of birth for the foreign-born population - Iraq (%)
Place of birth for the foreign-born population - Israel (%)
Place of birth for the foreign-born population - Jordan (%)
Place of birth for the foreign-born population - Kuwait (%)
Place of birth for the foreign-born population - Lebanon (%)
Place of birth for the foreign-born population - Saudi Arabia (%)
Place of birth for the foreign-born population - Syria (%)
Place of birth for the foreign-born population - Turkey (%)
Place of birth for the foreign-born population - Yemen (%)
Place of birth for the foreign-born population - Other Western Asia (%)
Place of birth for the foreign-born population - Eritrea (%)
Place of birth for the foreign-born population - Ethiopia (%)
Place of birth for the foreign-born population - Kenya (%)
Place of birth for the foreign-born population - Somalia (%)
Place of birth for the foreign-born population - Uganda (%)
Place of birth for the foreign-born population - Zimbabwe (%)
Place of birth for the foreign-born population - Other Eastern Africa (%)
Place of birth for the foreign-born population - Cameroon (%)
Place of birth for the foreign-born population - Congo (%)
Place of birth for the foreign-born population - Democratic Republic of Congo (Zaire) (%)
Place of birth for the foreign-born population - Other Middle Africa (%)
Place of birth for the foreign-born population - Egypt (%)
Place of birth for the foreign-born population - Morocco (%)
Place of birth for the foreign-born population - Sudan (%)
Place of birth for the foreign-born population - Other Northern Africa (%)
Place of birth for the foreign-born population - South Africa (%)
Place of birth for the foreign-born population - Other Southern Africa (%)
Place of birth for the foreign-born population - Cabo Verde (%)
Place of birth for the foreign-born population - Ghana (%)
Place of birth for the foreign-born population - Liberia (%)
Place of birth for the foreign-born population - Nigeria (%)
Place of birth for the foreign-born population - Senegal (%)
Place of birth for the foreign-born population - Sierra Leone (%)
Place of birth for the foreign-born population - Other Western Africa (%)
Place of birth for the foreign-born population - Australia (%)
Place of birth for the foreign-born population - New Zealand (%)
Place of birth for the foreign-born population - Fiji (%)
Place of birth for the foreign-born population - Micronesia (%)
Place of birth for the foreign-born population - Bahamas (%)
Place of birth for the foreign-born population - Barbados (%)
Place of birth for the foreign-born population - Cuba (%)
Place of birth for the foreign-born population - Dominica (%)
Place of birth for the foreign-born population - Dominican Republic (%)
Place of birth for the foreign-born population - Grenada (%)
Place of birth for the foreign-born population - Haiti (%)
Place of birth for the foreign-born population - Jamaica (%)
Place of birth for the foreign-born population - St. Vincent and the Grenadines (%)
Place of birth for the foreign-born population - Trinidad and Tobago (%)
Place of birth for the foreign-born population - West Indies (%)
Place of birth for the foreign-born population - Other Caribbean (%)
Place of birth for the foreign-born population - Belize (%)
Place of birth for the foreign-born population - Costa Rica (%)
Place of birth for the foreign-born population - El Salvador (%)
Place of birth for the foreign-born population - Guatemala (%)
Place of birth for the foreign-born population - Honduras (%)
Place of birth for the foreign-born population - Mexico (%)
Place of birth for the foreign-born population - Nicaragua (%)
Place of birth for the foreign-born population - Panama (%)
Place of birth for the foreign-born population - Other Central America (%)
Place of birth for the foreign-born population - Argentina (%)
Place of birth for the foreign-born population - Bolivia (%)
Place of birth for the foreign-born population - Brazil (%)
Place of birth for the foreign-born population - Chile (%)
Place of birth for the foreign-born population - Colombia (%)
Place of birth for the foreign-born population - Ecuador (%)
Place of birth for the foreign-born population - Guyana (%)
Place of birth for the foreign-born population - Peru (%)
Place of birth for the foreign-born population - Uruguay (%)
Place of birth for the foreign-born population - Venezuela (%)
Place of birth for the foreign-born population - Other South America (%)
Place of birth for the foreign-born population - Canada (%)
Place of birth for the foreign-born population - Other Northern America (%)
Place of birth for the foreign-born population - Other (%)
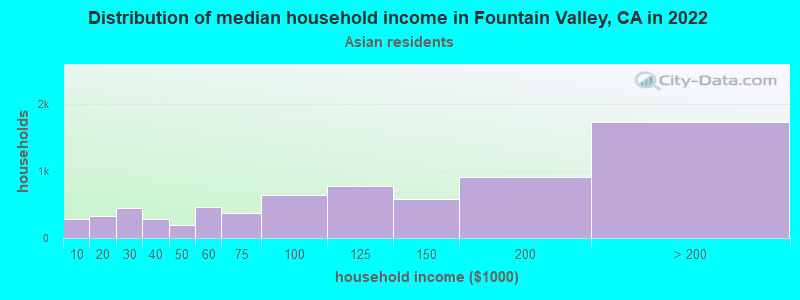
According to 2022 data, the most numerous races in Fountain Valley, CA are Hispanic (8,838 residents), White alone (23,057 residents), and Asian alone (21,601 residents). 58.4% of Fountain Valley residents speak English at home. 31.0% of Fountain Valley, CA residents are foreign-born (23.2% born in Asia, 3.7% born in Latin America), which is 16.0% greater than the foreign-born rate of 26.0% across the entire state of California.
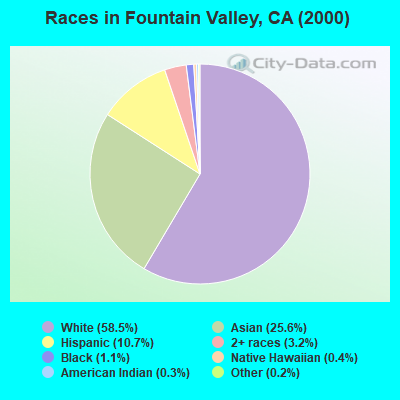
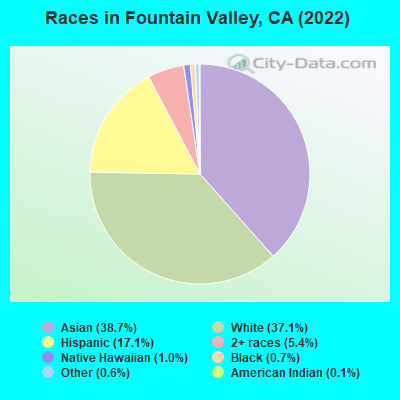
Race distribution in Fountain Valley
2000 2022
15,816,790 46.7% White alone 10,966,556 32.4% Hispanic 3,648,860 10.8% Asian alone 2,181,926 6.4% Black alone 903,115 2.7% Two or more races 178,984 0.5% American Indian alone 103,736 0.3% Native Hawaiian and Other 71,681 0.2% Other race alone
15,732,184 40.3% Hispanic 13,160,426 33.7% White alone 5,957,867 15.3% Asian alone 2,025,218 5.2% Black alone 1,663,222 4.3% Two or more races 251,618 0.6% Other race alone 135,777 0.3% Native Hawaiian and Other 103,030 0.3% American Indian alone
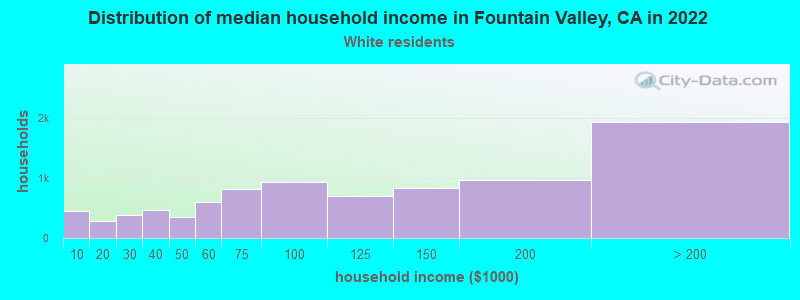
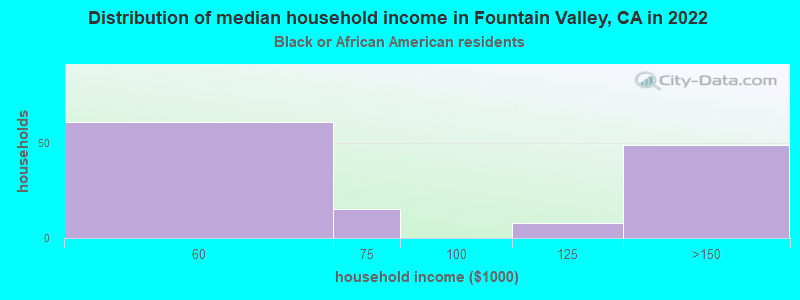
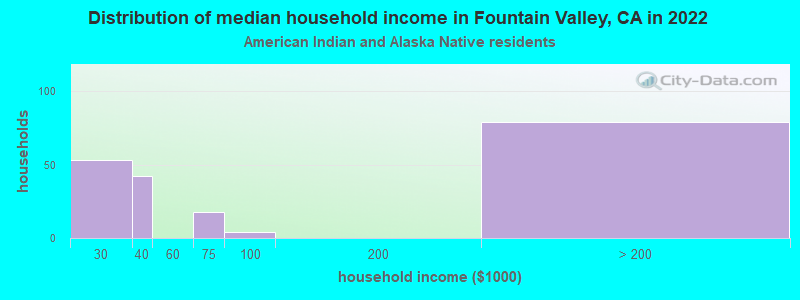
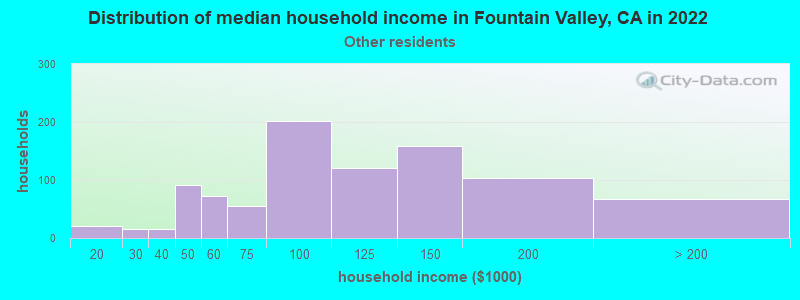
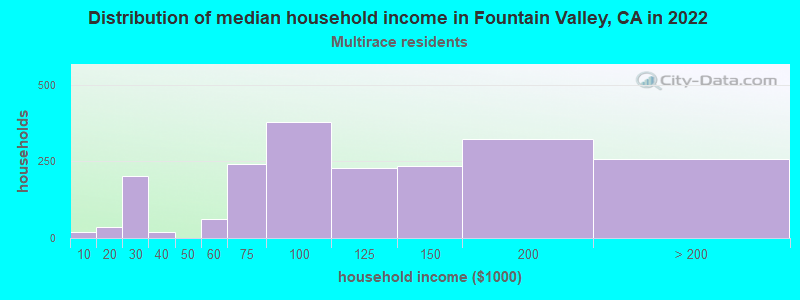
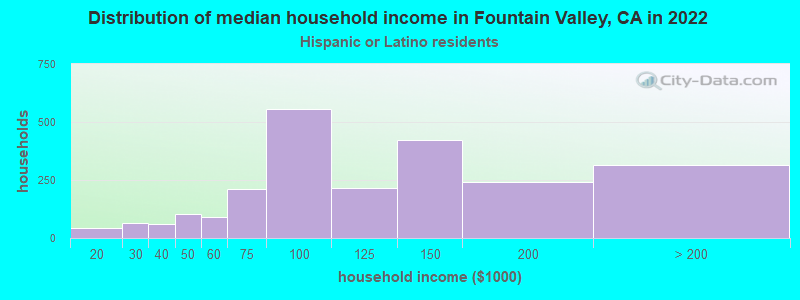
Income and house value in Fountain Valley Median household income in 2022 $119,798 White non-Hispanic householders$122,992 Black householders$112,674 American Indian and Alaska Native householders$121,041 Asian householders$101,900 Native Hawaiian and other Pacific Islander householders$125,649 Some other race householders$80,572 Two or more races householders$126,951 Hispanic or Latino race householdersMedian 2022 house value over $1,000,000 White Non-Hispanic householders$899,824 Black or African American householders$817,400 American Indian or Alaska Native householders over $1,000,000 Asian householders$929,698 Native Hawaiian and other Pacific Islander householdersover $1,000,000 Some other race householdersover $1,000,000 Two or more races householdersover $1,000,000 Hispanic or Latino householders
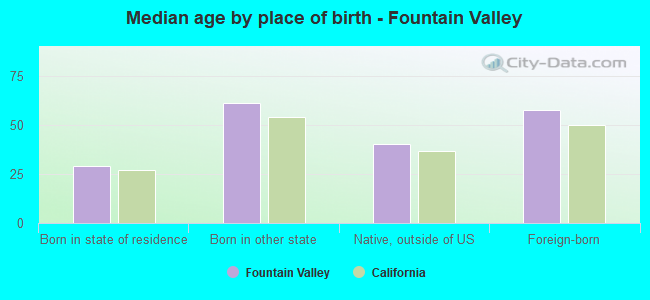
Median age by race in Fountain Valley
51.0 Median age for White residents49.1 52.0 59.0 Median age for Black or African American residents45.4 60.9 67.9 Median age for American Indian / Alaska Native residents66.1 53.5 46.0 Median age for Asian residents46.2 46.1 43.0 Median age for Native Hawaiian / Pacific Islander residents55.9 27.6 33.9 Median age for Other race residents35.0 33.7 29.4 Median age for Two or more races residents35.8 27.4 51.9 Median age for White alone residents50.3 52.7 30.4 Median age for Hispanic or Latino residents30.7 30.6
Owner/renter occupied households by race in Fountain Valley
House owners and renters - White residents 6,787 71.5% Owner occupied2,711 28.5% Renter occupiedHouse owners and renters - Black or African American residents 137 95.8% Owner occupied6 4.2% Renter occupiedHouse owners and renters - American Indian / Alaska Native residents 37 43.4% Owner occupied48 56.6% Renter occupiedHouse owners and renters - Asian residents 5,305 75.1% Owner occupied1,755 24.9% Renter occupiedHouse owners and renters - Native Hawaiian / Pacific Islander residents 5 100.0% Renter occupiedHouse owners and renters - Other race residents 398 59.3% Owner occupied273 40.7% Renter occupiedHouse owners and renters - Two or more races residents 961 48.7% Owner occupied1,014 51.3% Renter occupiedHouse owners and renters - White alone residents 6,641 71.8% Owner occupied2,609 28.2% Renter occupiedHouse owners and renters - Hispanic or Latino residents 1,223 57.2% Owner occupied917 42.8% Renter occupied
Language usage in Fountain Valley
English speakers - Total 58.4% of residents of Fountain Valley speak English at home.
7.7% of residents speak Spanish at home 2,964 71.5% Speak English very well1,182 28.5% Speak English less than very well34.4% of residents speak other language at home 9,697 52.4% Speak English very well8,823 47.6% Speak English less than very well
English speakers - Born in the United States 90.6% of residents of Fountain Valley speak English at home.
3.2% of residents speak Spanish at home 237 81.4% Speak English very well54 18.6% Speak English less than very well6.4% of residents speak other language at home 554 93.9% Speak English very well36 6.1% Speak English less than very well
English speakers - Native, born elsewhere 68.0% of residents of Fountain Valley speak English at home.
1.9% of residents speak Spanish at home 15 100.0% Speak English very well29.2% of residents speak other language at home 130 55.3% Speak English very well105 44.7% Speak English less than very well
English speakers - Foreign-born 10.2% of residents of Fountain Valley speak English at home.
10.2% of residents speak Spanish at home 855 49.5% Speak English very well872 50.5% Speak English less than very well81.2% of residents speak other language at home 5,659 41.0% Speak English very well8,130 59.0% Speak English less than very well
White (Caucasian) - Speak only English Native:
96.2% (20,639)Foreign-born:
35.8% (791)
White (Caucasian) - Speak another language Native:
6.8% (1,466)Foreign-born:
69.7% (1,543)
Black or African American - Speak only English Native:
97.5% (341)Foreign-born:
36.8% (7)
Black or African American - Speak another language Native:
2.4% (8)Foreign-born:
62.0% (12)
Asian - Speak only English Native:
45.4% (3,527)Foreign-born:
4.4% (582)
Asian - Speak another language Native:
53.9% (4,189)Foreign-born:
95.3% (12,475)
Native Hawaiian / Pacific Islander - Speak only English Native:
91.6% (67)Foreign-born:
31.6% (13)
Native Hawaiian / Pacific Islander - Speak another language Native:
13.1% (10)Foreign-born:
72.3% (29)
Other race - Speak only English Native:
56.8% (1,001)Foreign-born:
8.8% (65)
Other race - Speak another language Native:
44.5% (784)Foreign-born:
92.4% (690)
Two or more races - Speak only English Native:
63.6% (3,598)Foreign-born:
10.5% (206)
Two or more races - Speak another language Native:
36.3% (2,055)Foreign-born:
86.7% (1,706)
White alone - Speak only English Native:
94.5% (18,814)Foreign-born:
30.1% (764)
White alone - Speak another language Native:
5.5% (1,101)Foreign-born:
70.1% (1,780)
Hispanic or Latino - Speak only English Native:
69.1% (4,602)Foreign-born:
10.9% (186)
Hispanic or Latino - Speak another language Native:
30.6% (2,036)Foreign-born:
90.9% (1,544)
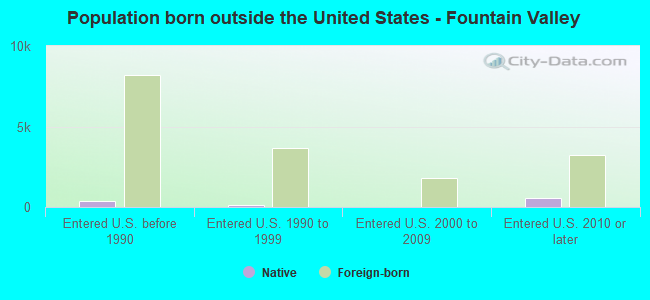
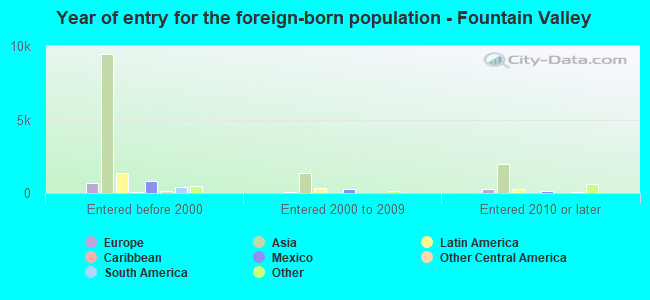
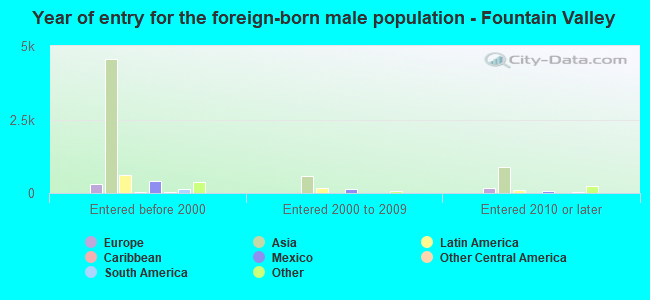
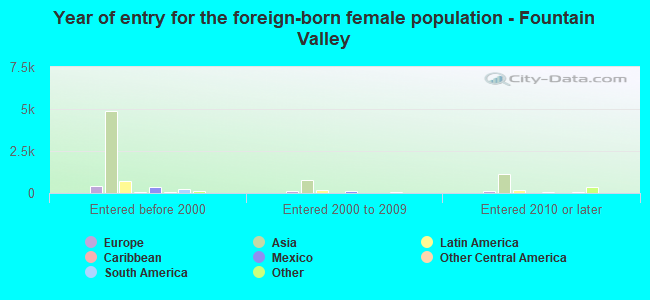
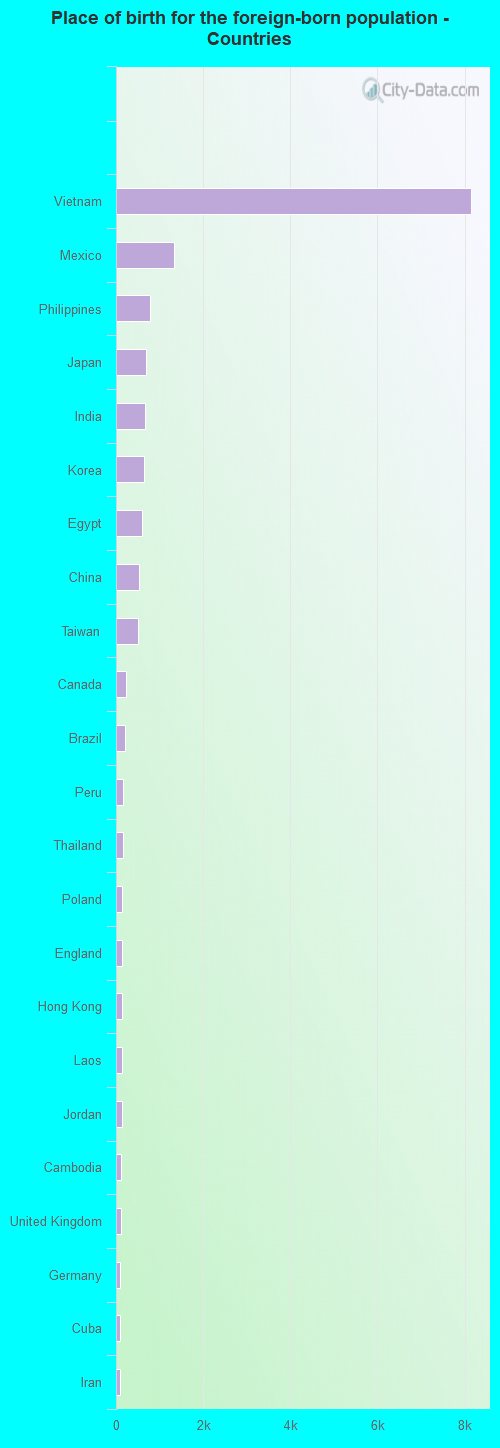
Foreign-born residents in Fountain Valley 17,415 residents are foreign born (23.2% Asia , 3.7% Latin America ).
This city:
31.0%California:
100.0%
Marital status for residents in Fountain Valley Marital status - White (Caucasian) population 15 years and over
Males 31.9% Never married56.3% Now married1.2% Separated1.8% Widowed8.8% DivorcedFemales 28.2% Never married49.7% Now married1.7% Separated8.9% Widowed11.5% DivorcedWomen who gave birth in the past 12 months Now married:
100.0% (107)Unmarried:
0.0% (0)
Women who did not give birth in the past 12 months Now married:
39.2% (1,851)Unmarried:
60.8% (2,866)
Marital status - Black or African American population 15 years and over
Males 27.5% Never married49.0% Now married0.0% Separated0.0% Widowed23.5% DivorcedFemales 15.0% Never married64.4% Now married0.0% Separated16.9% Widowed3.7% DivorcedWomen who gave birth in the past 12 months Now married:
100.0% (5)Unmarried:
0.0% (0)
Women who did not give birth in the past 12 months Now married:
32.7% (15)Unmarried:
67.3% (30)
Marital status - American Indian / Alaska Native population 15 years and over
Males 0.0% Never married50.6% Now married0.0% Separated0.0% Widowed49.4% DivorcedFemales 35.5% Never married17.1% Now married0.0% Separated19.7% Widowed27.6% DivorcedWomen who did not give birth in the past 12 months Now married:
0.0% (0)Unmarried:
100.0% (52)
Marital status - Asian population 15 years and over
Males 32.6% Never married59.4% Now married0.6% Separated2.4% Widowed5.0% DivorcedFemales 28.2% Never married54.8% Now married1.3% Separated9.1% Widowed6.6% DivorcedWomen who gave birth in the past 12 months Now married:
94.9% (133)Unmarried:
5.1% (7)
Women who did not give birth in the past 12 months Now married:
46.1% (2,213)Unmarried:
53.9% (2,585)
Marital status - Native Hawaiian / Pacific Islander population 15 years and over
Males 17.3% Never married82.7% Now married0.0% Separated0.0% Widowed0.0% DivorcedFemales 0.0% Never married100.0% Now married0.0% Separated0.0% Widowed0.0% DivorcedWomen who did not give birth in the past 12 months Now married:
100.0% (20)Unmarried:
0.0% (0)
Marital status - Other race population 15 years and over
Males 38.3% Never married52.7% Now married1.6% Separated2.1% Widowed5.3% DivorcedFemales 25.7% Never married56.6% Now married2.3% Separated10.0% Widowed5.4% DivorcedWomen who gave birth in the past 12 months Now married:
0.0% (0)Unmarried:
100.0% (1)
Women who did not give birth in the past 12 months Now married:
63.1% (450)Unmarried:
36.9% (263)
Marital status - Two or more races population 15 years and over
Males 60.6% Never married34.9% Now married0.0% Separated4.5% Widowed0.0% DivorcedFemales 52.5% Never married37.1% Now married0.8% Separated6.8% Widowed2.8% DivorcedWomen who gave birth in the past 12 months Now married:
0.0% (0)Unmarried:
100.0% (41)
Women who did not give birth in the past 12 months Now married:
37.5% (721)Unmarried:
62.5% (1,202)
Marital status - White alone, not Hispanic / Latino population 15 years and over
Males 29.4% Never married57.8% Now married1.4% Separated1.9% Widowed9.3% DivorcedFemales 25.9% Never married52.2% Now married1.8% Separated9.4% Widowed10.7% DivorcedWomen who gave birth in the past 12 months Now married:
100.0% (121)Unmarried:
0.0% (0)
Women who did not give birth in the past 12 months Now married:
42.2% (1,844)Unmarried:
57.8% (2,527)
Marital status - Hispanic or Latino population 15 years and over
Males 45.6% Never married48.1% Now married0.4% Separated1.0% Widowed4.9% DivorcedFemales 39.9% Never married40.6% Now married1.2% Separated6.6% Widowed11.7% DivorcedWomen who gave birth in the past 12 months Now married:
31.8% (7)Unmarried:
68.2% (15)
Women who did not give birth in the past 12 months Now married:
35.8% (815)Unmarried:
64.2% (1,463)
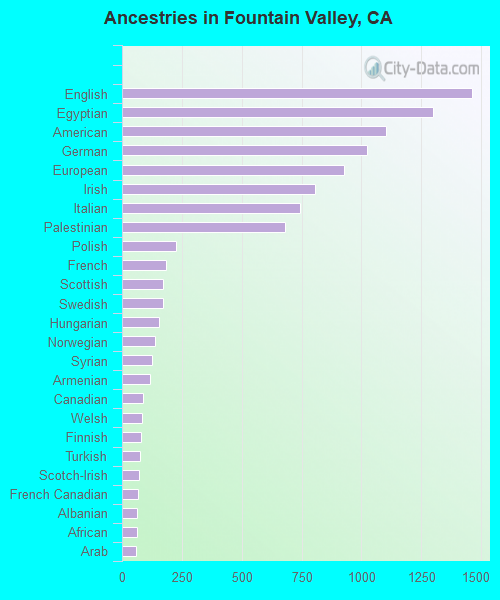
Ancestries in Fountain Valley
1,343 4.5% English1,133 3.8% American966 3.2% Irish896 3.0% German882 2.9% European805 2.7% Egyptian634 2.1% Italian391 1.3% Polish259 0.9% Palestinian186 0.6% Armenian159 0.5% Scottish154 0.5% Brazilian149 0.5% Eastern European146 0.5% Swedish120 0.4% Norwegian119 0.4% Russian110 0.4% Danish102 0.3% Syrian98 0.3% Dutch89 0.3% Greek86 0.3% Yugoslavian85 0.3% British81 0.3% Canadian77 0.3% Jordanian75 0.2% Portuguese74 0.2% Hungarian71 0.2% French Canadian71 0.2% Scandinavian70 0.2% French61 0.2% Albanian59 0.2% Scotch-Irish54 0.2% Arab54 0.2% Welsh44 0.1% Slovak29 0.10% Lithuanian27 0.09% Czechoslovakian27 0.09% Czech25 0.08% Nigerian24 0.08% Croatian23 0.08% Finnish22 0.07% Iranian21 0.07% Ukrainian20 0.07% Lebanese19 0.06% Northern European19 0.06% Australian16 0.05% Austrian13 0.04% Latvian11 0.04% Belgian9 0.03% Basque9 0.03% Romanian7 0.02% African
Geographical mobility in Fountain Valley Same house 1 year ago 21,279 89.3% White (Caucasian)327 89.2% Black or African American240 100.0% American Indian / Alaska Native20,115 93.0% Asian142 100.0% Native Hawaiian / Pacific Islander2,043 85.2% Other race7,247 92.6% Two or more races21,295 91.0% White alone, not Hispanic / Latino7,653 87.0% Hispanic or LatinoMoved within same county 1,549 6.5% White / Caucasian5 1.2% Black or African American1,014 4.7% Asian296 12.4% Other race566 7.2% Two or more races1,225 5.2% White alone, not Hispanic / Latino820 9.3% Hispanic or LatinoMoved within same state 545 2.3% White / Caucasian10 2.7% Black or African American285 1.3% Asian16 0.7% Other race103 1.3% Two or more races411 1.8% White alone, not Hispanic / Latino275 3.1% Hispanic or LatinoMoved from different state 429 1.8% White / Caucasian13 3.5% Black or African American123 0.6% Asian12 0.2% Two or more races506 2.2% White alone, not Hispanic / LatinoMoved from abroad 29 0.1% White17 4.5% Black or African American184 0.8% Asian43 0.2% White alone, not Hispanic / Latino
Children Nativity (place of birth) in Fountain Valley
Children under 6 years - Living with two parents Both parents native 918 100.0% NativeBoth parents foreign-born 557 97.3% Native16 2.7% Foreign-bornOne native, one foreign-born parent 359 100.0% NativeChildren under 6 years - Living with one parent Native parent 661 100.0% Native0 0.0% Foreign-bornForeign-born parent 34 47.9% Native36 52.1% Foreign-bornChildren 6 to 17 years - Living with two parents Both parents native 2,853 99.9% Native2 0.1% Foreign-bornBoth parents foreign-born 1,899 87.7% Native267 12.3% Foreign-bornOne native, one foreign-born parent 1,020 100.0% NativeChildren 6 to 17 years - Living with one parent Native parent 862 100.0% NativeForeign-born parent 453 56.9% Native344 43.1% Foreign-born
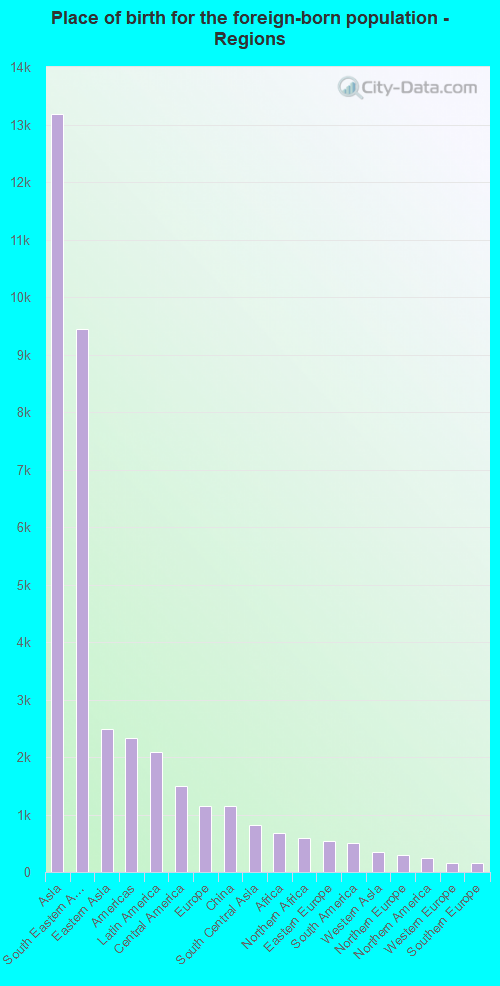
Place of birth for residents in Fountain Valley 13,181 Asia9,443 South Eastern Asia2,489 Eastern Asia2,328 Americas2,091 Latin America1,498 Central America1,153 Europe1,153 China814 South Central Asia673 Africa587 Northern Africa536 Eastern Europe509 South America351 Western Asia304 Northern Europe237 Northern America163 Western Europe148 Southern Europe84 Caribbean77 Oceania58 Southern Africa53 Australia and New Zealand Subregion18 Western Africa9 Eastern Africa8,151 Vietnam1,337 Mexico774 Philippines691 Japan657 India644 Korea587 Egypt517 China497 Taiwan237 Canada206 Brazil154 Peru152 Thailand149 Poland143 England138 Hong Kong133 Laos130 Jordan119 Cambodia117 United Kingdom93 Germany84 Cuba84 Iran73 Burma66 Greece62 Russia61 Syria58 South Africa54 Pakistan53 Guatemala53 Colombia49 El Salvador47 Italy44 Panama43 Czechoslovakia40 Kuwait38 Uruguay33 Lebanon32 Netherlands31 Australia29 Indonesia27 France25 Ecuador24 Fiji22 New Zealand20 Denmark20 Hungary20 Portugal18 Argentina16 Ireland14 Spain14 Uzbekistan12 Nicaragua12 Chile12 Nigeria10 Austria10 Turkey10 Saudi Arabia9 Ukraine9 Croatia9 Zimbabwe9 Latvia9 Serbia8 Malaysia7 Scotland6 Liberia6 Romania4 Afghanistan4 Israel
Grandparents responsible for own grandchildren in Fountain Valley
Grandparents (30 to 59 years) White / Caucasian 60 32.7% Responsible for grandchildren123 67.3% Not responsible for grandchildrenAsian 18 16.5% Responsible for grandchildren89 83.5% Not responsible for grandchildrenOther race 46 83.9% Responsible for grandchildren9 16.1% Not responsible for grandchildrenTwo or more races 88 100.0% Not responsible for grandchildrenWhite alone, not Hispanic / Latino 31 25.5% Responsible for grandchildren91 74.5% Not responsible for grandchildrenHispanic or Latino 84 49.0% Responsible for grandchildren87 51.0% Not responsible for grandchildrenGrandparents (60 years and over) White / Caucasian 89 22.7% Responsible for grandchildren304 77.3% Not responsible for grandchildrenAsian 64 10.6% Responsible for grandchildren542 89.4% Not responsible for grandchildrenOther race 26 100.0% Not responsible for grandchildrenTwo or more races 97 100.0% Not responsible for grandchildrenWhite alone, not Hispanic / Latino 110 26.1% Responsible for grandchildren311 73.9% Not responsible for grandchildrenHispanic or Latino 172 100.0% Not responsible for grandchildren