Races in Fowler, California (CA) Detailed Stats
Data:
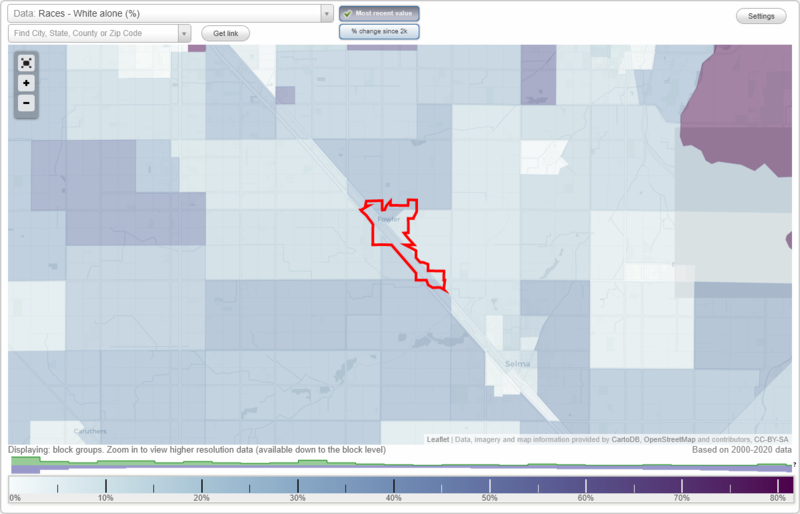
Races - White alone (%)
Races - White alone (% change since 2000)
Races - Black alone (%)
Races - Black alone (% change since 2000)
Races - American Indian alone (%)
Races - American Indian alone (% change since 2000)
Races - Asian alone (%)
Races - Asian alone (% change since 2000)
Races - Hispanic (%)
Races - Hispanic (% change since 2000)
Races - Native Hawaiian and Other Pacific Islander alone (%)
Races - Native Hawaiian and Other Pacific Islander alone (% change since 2000)
Races - Two or more races(%)
Races - Two or more races(% change since 2000)
Races - Other race alone (%)
Races - Other race alone (% change since 2000)
Racial diversity
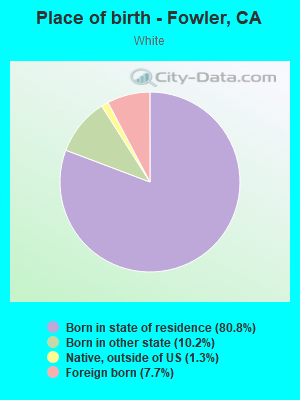
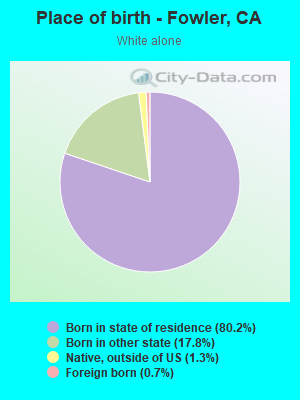
Place of birth - Born in state of residence (%)
Place of birth - Born in state of residence (%) - White
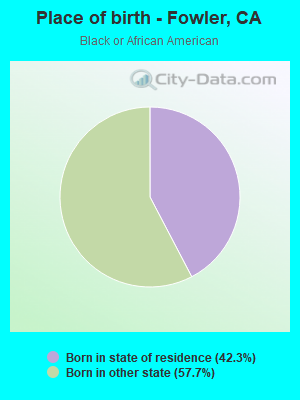
Place of birth - Born in state of residence (%) - Black or African American
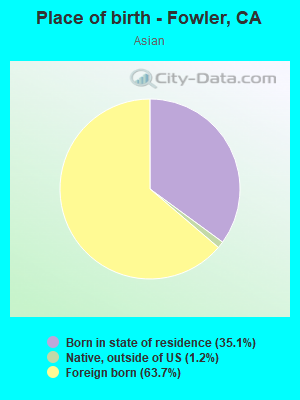
Place of birth - Born in state of residence (%) - Asian
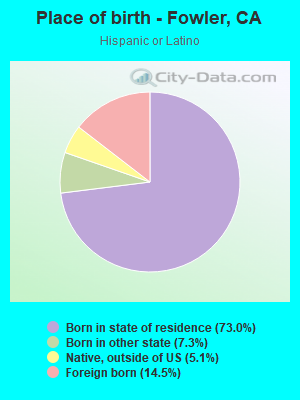
Place of birth - Born in state of residence (%) - Hispanic or Latino
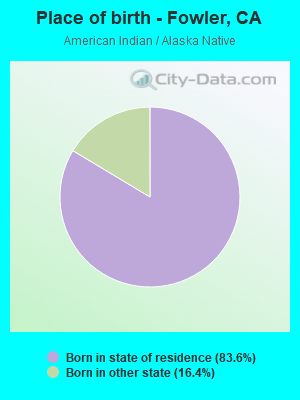
Place of birth - Born in state of residence (%) - American Indian and Alaska Native
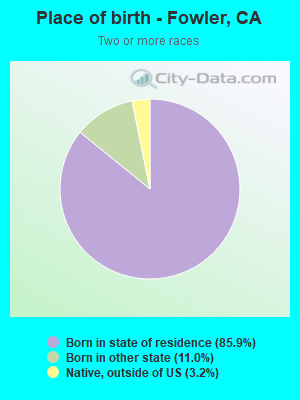
Place of birth - Born in state of residence (%) - Multirace
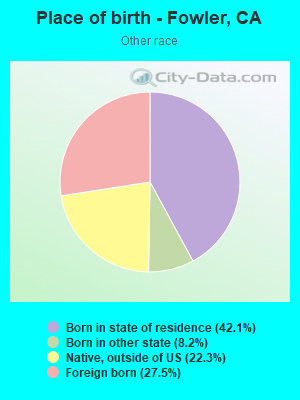
Place of birth - Born in state of residence (%) - Other Race
Place of birth - Born in other state (%)
Place of birth - Born in other state (%) - White
Place of birth - Born in other state (%) - Black or African American
Place of birth - Born in other state (%) - Asian
Place of birth - Born in other state (%) - Hispanic or Latino
Place of birth - Born in other state (%) - American Indian and Alaska Native
Place of birth - Born in other state (%) - Multirace
Place of birth - Born in other state (%) - Other Race
Place of birth - Native, outside of US (%)
Place of birth - Native, outside of US (%) - White
Place of birth - Native, outside of US (%) - Black or African American
Place of birth - Native, outside of US (%) - Asian
Place of birth - Native, outside of US (%) - Hispanic or Latino
Place of birth - Native, outside of US (%) - American Indian and Alaska Native
Place of birth - Native, outside of US (%) - Multirace
Place of birth - Native, outside of US (%) - Other Race
Place of birth - Foreign born (%)
Place of birth - Foreign born (%) - White
Place of birth - Foreign born (%) - Black or African American
Place of birth - Foreign born (%) - Asian
Place of birth - Foreign born (%) - Hispanic or Latino
Place of birth - Foreign born (%) - American Indian and Alaska Native
Place of birth - Foreign born (%) - Multirace
Place of birth - Foreign born (%) - Other Race
Residents speaking English at home (%)
Residents speaking English at home - Born in the United States (%)
Residents speaking English at home - Native, born elsewhere (%)
Residents speaking English at home - Foreign born (%)
Residents speaking Spanish at home (%)
Residents speaking Spanish at home - Born in the United States (%)
Residents speaking Spanish at home - Native, born elsewhere (%)
Residents speaking Spanish at home - Foreign born (%)
Residents speaking other language at home (%)
Residents speaking other language at home - Born in the United States (%)
Residents speaking other language at home - Native, born elsewhere (%)
Residents speaking other language at home - Foreign born (%)
Marital status - Never married (%)
Marital status - Now married (%)
Marital status - Separated (%)
Marital status - Widowed (%)
Marital status - Divorced (%)
Ancestries Reported - Arab (%)
Ancestries Reported - Czech (%)
Ancestries Reported - Danish (%)
Ancestries Reported - Dutch (%)
Ancestries Reported - English (%)
Ancestries Reported - French (%)
Ancestries Reported - French Canadian (%)
Ancestries Reported - German (%)
Ancestries Reported - Greek (%)
Ancestries Reported - Hungarian (%)
Ancestries Reported - Irish (%)
Ancestries Reported - Italian (%)
Ancestries Reported - Lithuanian (%)
Ancestries Reported - Norwegian (%)
Ancestries Reported - Polish (%)
Ancestries Reported - Portuguese (%)
Ancestries Reported - Russian (%)
Ancestries Reported - Scotch-Irish (%)
Ancestries Reported - Scottish (%)
Ancestries Reported - Slovak (%)
Ancestries Reported - Subsaharan African (%)
Ancestries Reported - Swedish (%)
Ancestries Reported - Swiss (%)
Ancestries Reported - Ukrainian (%)
Ancestries Reported - United States (%)
Ancestries Reported - Welsh (%)
Ancestries Reported - West Indian (%)
Ancestries Reported - Other (%)
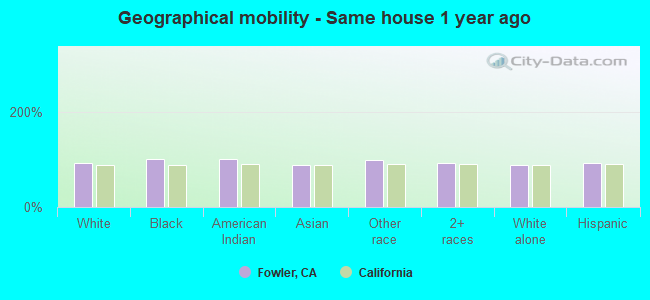
Geographical mobility - Same house 1 year ago (%)
Geographical mobility - Same house 1 year ago (%) - White
Geographical mobility - Same house 1 year ago (%) - Black or African American
Geographical mobility - Same house 1 year ago (%) - Asian
Geographical mobility - Same house 1 year ago (%) - Hispanic or Latino
Geographical mobility - Same house 1 year ago (%) - American Indian and Alaska Native
Geographical mobility - Same house 1 year ago (%) - Multirace
Geographical mobility - Same house 1 year ago (%) - Other Race
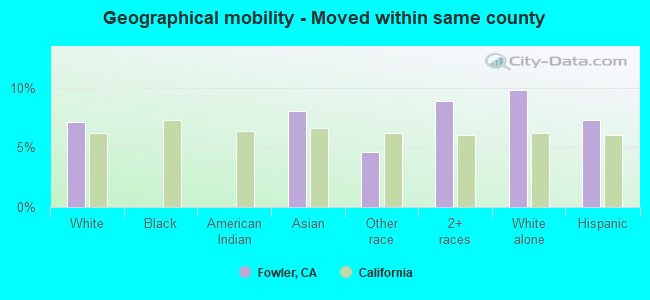
Geographical mobility - Moved within same county (%)
Geographical mobility - Moved within same county (%) - White
Geographical mobility - Moved within same county (%) - Black or African American
Geographical mobility - Moved within same county (%) - Asian
Geographical mobility - Moved within same county (%) - Hispanic or Latino
Geographical mobility - Moved within same county (%) - American Indian and Alaska Native
Geographical mobility - Moved within same county (%) - Multirace
Geographical mobility - Moved within same county (%) - Other Race
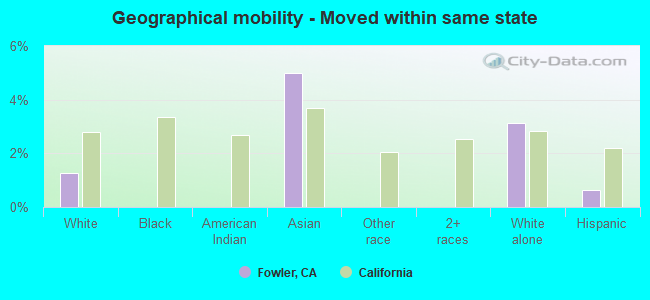
Geographical mobility - Moved from different county within same state (%)
Geographical mobility - Moved from different county within same state (%) - White
Geographical mobility - Moved from different county within same state (%) - Black or African American
Geographical mobility - Moved from different county within same state (%) - Asian
Geographical mobility - Moved from different county within same state (%) - Hispanic or Latino
Geographical mobility - Moved from different county within same state (%) - American Indian and Alaska Native
Geographical mobility - Moved from different county within same state (%) - Multirace
Geographical mobility - Moved from different county within same state (%) - Other Race
Geographical mobility - Moved from different state (%)
Geographical mobility - Moved from different state (%) - White
Geographical mobility - Moved from different state (%) - Black or African American
Geographical mobility - Moved from different state (%) - Asian
Geographical mobility - Moved from different state (%) - Hispanic or Latino
Geographical mobility - Moved from different state (%) - American Indian and Alaska Native
Geographical mobility - Moved from different state (%) - Multirace
Geographical mobility - Moved from different state (%) - Other Race
Geographical mobility - Moved from abroad (%)
Geographical mobility - Moved from abroad (%) - White
Geographical mobility - Moved from abroad (%) - Black or African American
Geographical mobility - Moved from abroad (%) - Asian
Geographical mobility - Moved from abroad (%) - Hispanic or Latino
Geographical mobility - Moved from abroad (%) - American Indian and Alaska Native
Geographical mobility - Moved from abroad (%) - Multirace
Geographical mobility - Moved from abroad (%) - Other Race
Place of birth for the foreign-born population - Ireland (%)
Place of birth for the foreign-born population - Denmark (%)
Place of birth for the foreign-born population - Norway (%)
Place of birth for the foreign-born population - Sweden (%)
Place of birth for the foreign-born population - United Kingdom (%)
Place of birth for the foreign-born population - England (%)
Place of birth for the foreign-born population - Scotland (%)
Place of birth for the foreign-born population - Other Northern Europe (%)
Place of birth for the foreign-born population - Austria (%)
Place of birth for the foreign-born population - Belgium (%)
Place of birth for the foreign-born population - France (%)
Place of birth for the foreign-born population - Germany (%)
Place of birth for the foreign-born population - Netherlands (%)
Place of birth for the foreign-born population - Switzerland (%)
Place of birth for the foreign-born population - Other Western Europe (%)
Place of birth for the foreign-born population - Greece (%)
Place of birth for the foreign-born population - Italy (%)
Place of birth for the foreign-born population - Portugal (%)
Place of birth for the foreign-born population - Spain (%)
Place of birth for the foreign-born population - Other Southern Europe (%)
Place of birth for the foreign-born population - Albania (%)
Place of birth for the foreign-born population - Belarus (%)
Place of birth for the foreign-born population - Bosnia and Herzegovina (%)
Place of birth for the foreign-born population - Bulgaria (%)
Place of birth for the foreign-born population - Croatia (%)
Place of birth for the foreign-born population - Czechoslovakia (%)
Place of birth for the foreign-born population - Hungary (%)
Place of birth for the foreign-born population - Latvia (%)
Place of birth for the foreign-born population - Lithuania (%)
Place of birth for the foreign-born population - North Macedonia (Macedonia) (%)
Place of birth for the foreign-born population - Moldova (%)
Place of birth for the foreign-born population - Poland (%)
Place of birth for the foreign-born population - Romania (%)
Place of birth for the foreign-born population - Russia (%)
Place of birth for the foreign-born population - Serbia (%)
Place of birth for the foreign-born population - Ukraine (%)
Place of birth for the foreign-born population - Other Eastern Europe (%)
Place of birth for the foreign-born population - China (%)
Place of birth for the foreign-born population - Hong Kong (%)
Place of birth for the foreign-born population - Taiwan (%)
Place of birth for the foreign-born population - Japan (%)
Place of birth for the foreign-born population - Korea (%)
Place of birth for the foreign-born population - Other Eastern Asia (%)
Place of birth for the foreign-born population - Afghanistan (%)
Place of birth for the foreign-born population - Bangladesh (%)
Place of birth for the foreign-born population - India (%)
Place of birth for the foreign-born population - Iran (%)
Place of birth for the foreign-born population - Kazakhstan (%)
Place of birth for the foreign-born population - Nepal (%)
Place of birth for the foreign-born population - Pakistan (%)
Place of birth for the foreign-born population - Sri Lanka (%)
Place of birth for the foreign-born population - Uzbekistan (%)
Place of birth for the foreign-born population - Other South Central Asia (%)
Place of birth for the foreign-born population - Burma (%)
Place of birth for the foreign-born population - Cambodia (%)
Place of birth for the foreign-born population - Indonesia (%)
Place of birth for the foreign-born population - Laos (%)
Place of birth for the foreign-born population - Malaysia (%)
Place of birth for the foreign-born population - Philippines (%)
Place of birth for the foreign-born population - Singapore (%)
Place of birth for the foreign-born population - Thailand (%)
Place of birth for the foreign-born population - Vietnam (%)
Place of birth for the foreign-born population - Other South Eastern Asia (%)
Place of birth for the foreign-born population - Armenia (%)
Place of birth for the foreign-born population - Iraq (%)
Place of birth for the foreign-born population - Israel (%)
Place of birth for the foreign-born population - Jordan (%)
Place of birth for the foreign-born population - Kuwait (%)
Place of birth for the foreign-born population - Lebanon (%)
Place of birth for the foreign-born population - Saudi Arabia (%)
Place of birth for the foreign-born population - Syria (%)
Place of birth for the foreign-born population - Turkey (%)
Place of birth for the foreign-born population - Yemen (%)
Place of birth for the foreign-born population - Other Western Asia (%)
Place of birth for the foreign-born population - Eritrea (%)
Place of birth for the foreign-born population - Ethiopia (%)
Place of birth for the foreign-born population - Kenya (%)
Place of birth for the foreign-born population - Somalia (%)
Place of birth for the foreign-born population - Uganda (%)
Place of birth for the foreign-born population - Zimbabwe (%)
Place of birth for the foreign-born population - Other Eastern Africa (%)
Place of birth for the foreign-born population - Cameroon (%)
Place of birth for the foreign-born population - Congo (%)
Place of birth for the foreign-born population - Democratic Republic of Congo (Zaire) (%)
Place of birth for the foreign-born population - Other Middle Africa (%)
Place of birth for the foreign-born population - Egypt (%)
Place of birth for the foreign-born population - Morocco (%)
Place of birth for the foreign-born population - Sudan (%)
Place of birth for the foreign-born population - Other Northern Africa (%)
Place of birth for the foreign-born population - South Africa (%)
Place of birth for the foreign-born population - Other Southern Africa (%)
Place of birth for the foreign-born population - Cabo Verde (%)
Place of birth for the foreign-born population - Ghana (%)
Place of birth for the foreign-born population - Liberia (%)
Place of birth for the foreign-born population - Nigeria (%)
Place of birth for the foreign-born population - Senegal (%)
Place of birth for the foreign-born population - Sierra Leone (%)
Place of birth for the foreign-born population - Other Western Africa (%)
Place of birth for the foreign-born population - Australia (%)
Place of birth for the foreign-born population - New Zealand (%)
Place of birth for the foreign-born population - Fiji (%)
Place of birth for the foreign-born population - Micronesia (%)
Place of birth for the foreign-born population - Bahamas (%)
Place of birth for the foreign-born population - Barbados (%)
Place of birth for the foreign-born population - Cuba (%)
Place of birth for the foreign-born population - Dominica (%)
Place of birth for the foreign-born population - Dominican Republic (%)
Place of birth for the foreign-born population - Grenada (%)
Place of birth for the foreign-born population - Haiti (%)
Place of birth for the foreign-born population - Jamaica (%)
Place of birth for the foreign-born population - St. Vincent and the Grenadines (%)
Place of birth for the foreign-born population - Trinidad and Tobago (%)
Place of birth for the foreign-born population - West Indies (%)
Place of birth for the foreign-born population - Other Caribbean (%)
Place of birth for the foreign-born population - Belize (%)
Place of birth for the foreign-born population - Costa Rica (%)
Place of birth for the foreign-born population - El Salvador (%)
Place of birth for the foreign-born population - Guatemala (%)
Place of birth for the foreign-born population - Honduras (%)
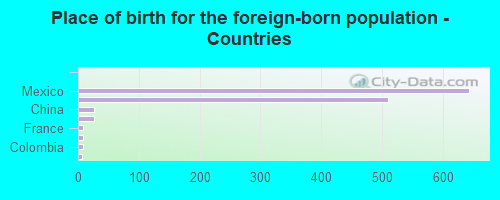
Place of birth for the foreign-born population - Mexico (%)
Place of birth for the foreign-born population - Nicaragua (%)
Place of birth for the foreign-born population - Panama (%)
Place of birth for the foreign-born population - Other Central America (%)
Place of birth for the foreign-born population - Argentina (%)
Place of birth for the foreign-born population - Bolivia (%)
Place of birth for the foreign-born population - Brazil (%)
Place of birth for the foreign-born population - Chile (%)
Place of birth for the foreign-born population - Colombia (%)
Place of birth for the foreign-born population - Ecuador (%)
Place of birth for the foreign-born population - Guyana (%)
Place of birth for the foreign-born population - Peru (%)
Place of birth for the foreign-born population - Uruguay (%)
Place of birth for the foreign-born population - Venezuela (%)
Place of birth for the foreign-born population - Other South America (%)
Place of birth for the foreign-born population - Canada (%)
Place of birth for the foreign-born population - Other Northern America (%)
Place of birth for the foreign-born population - Other (%)
Latest news about races in Fowler, CA collected exclusively by city-data.com from local newspapers, TV, and radio stations
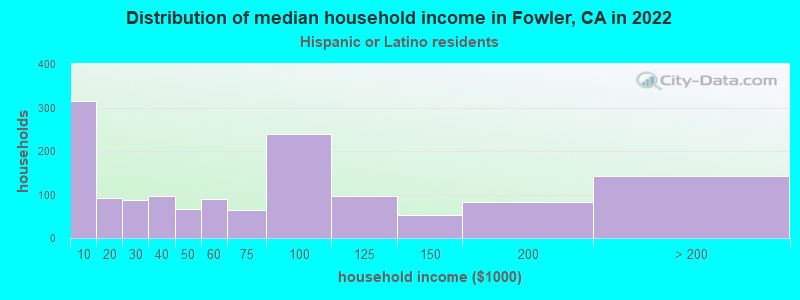
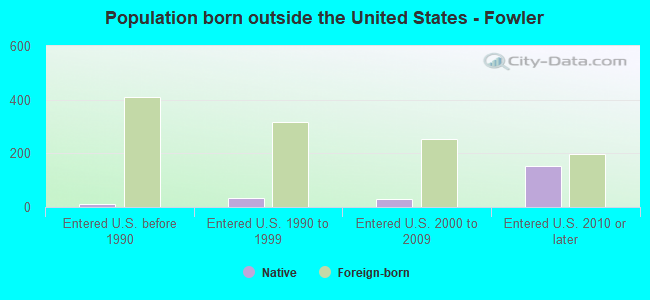
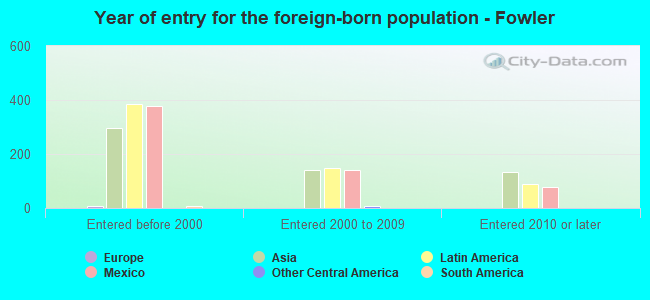
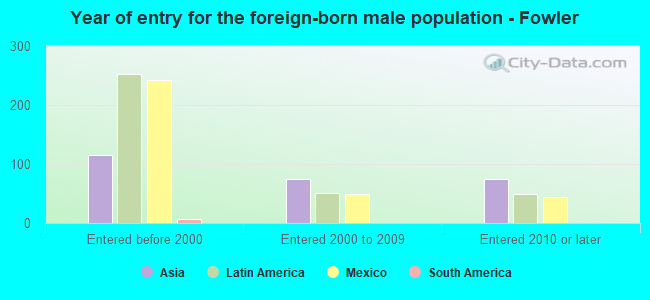
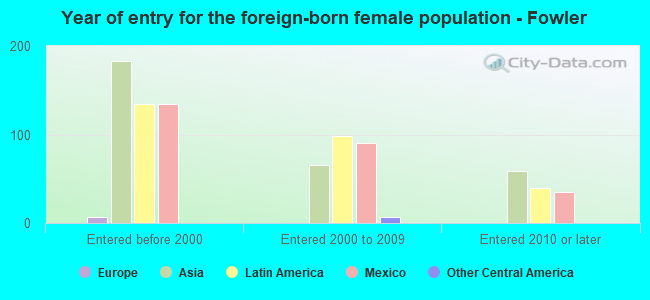
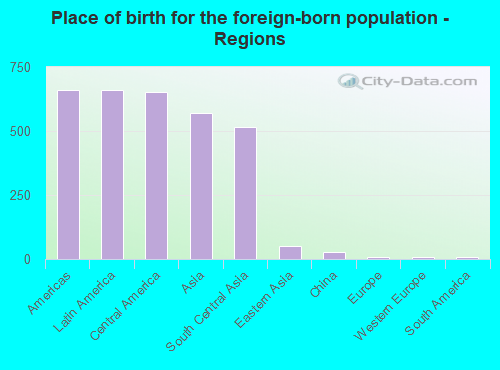
According to 2022 data, the most numerous races in Fowler, CA are Hispanic (4,391 residents), White alone (1,138 residents), and Asian alone (893 residents). 57.1% of Fowler residents speak English at home. 18.7% of Fowler, CA residents are foreign-born (10.0% born in Latin America, 8.6% born in Asia), which is 39.4% less than the foreign-born rate of 26.0% across the entire state of California.
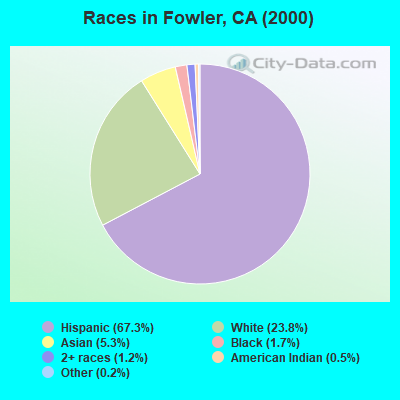
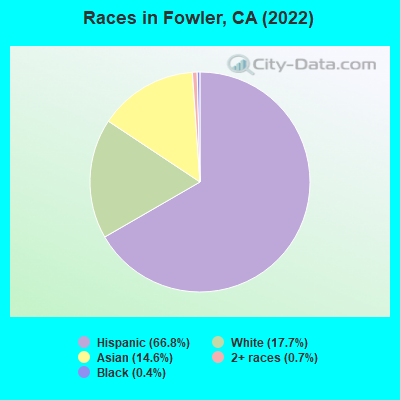
Race distribution in Fowler
2000 2022
15,816,790 46.7% White alone 10,966,556 32.4% Hispanic 3,648,860 10.8% Asian alone 2,181,926 6.4% Black alone 903,115 2.7% Two or more races 178,984 0.5% American Indian alone 103,736 0.3% Native Hawaiian and Other 71,681 0.2% Other race alone
15,732,184 40.3% Hispanic 13,160,426 33.7% White alone 5,957,867 15.3% Asian alone 2,025,218 5.2% Black alone 1,663,222 4.3% Two or more races 251,618 0.6% Other race alone 135,777 0.3% Native Hawaiian and Other 103,030 0.3% American Indian alone
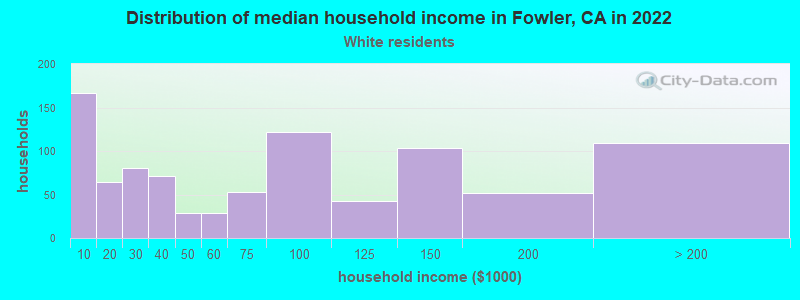
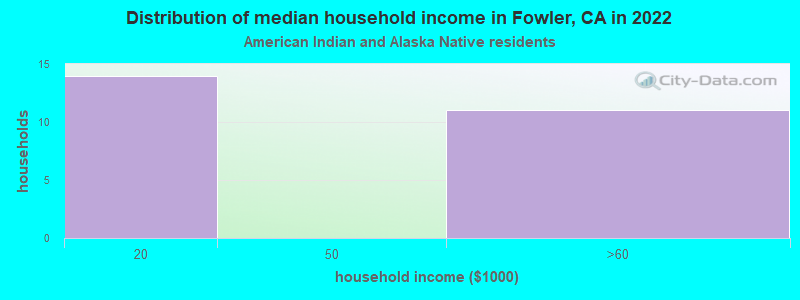
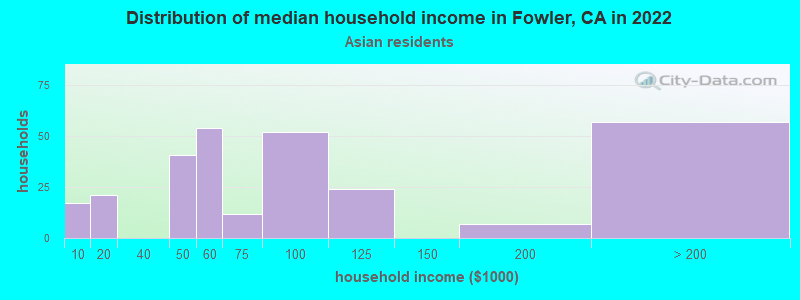
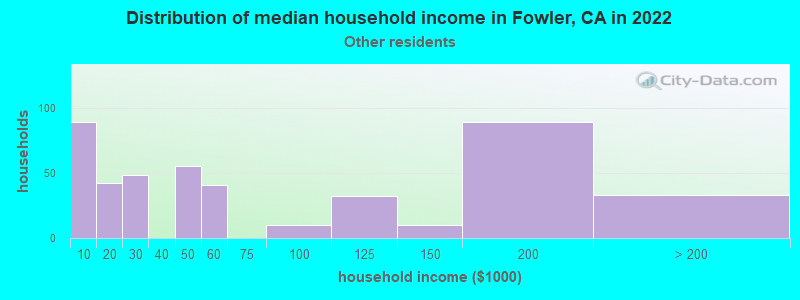
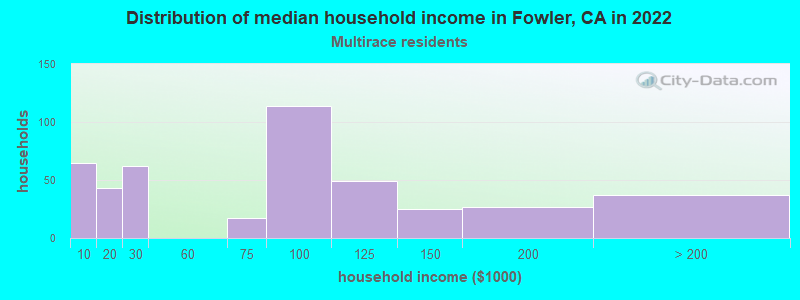
Income and house value in Fowler Median household income in 2022 $71,327 White non-Hispanic householders$30,713 Black householders$61,447 American Indian and Alaska Native householders$60,574 Asian householders$44,815 Some other race householders$69,657 Two or more races householders$85,171 Hispanic or Latino race householdersMedian 2022 house value $398,802 White Non-Hispanic householders$281,824 Black or African American householders$310,619 American Indian or Alaska Native householders $497,782 Asian householders$294,422 Some other race householders$284,344 Two or more races householders$310,979 Hispanic or Latino householders
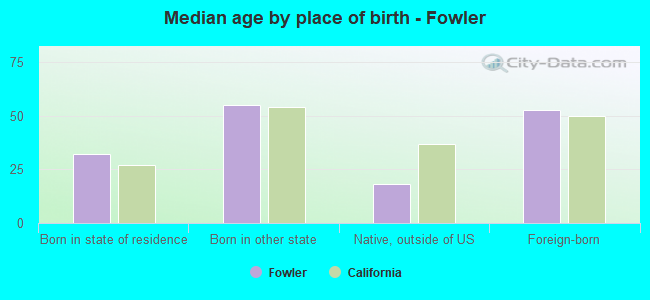
Median age by race in Fowler
34.8 Median age for White residents40.2 32.0 25.3 Median age for Black or African American residents61.8 Median age for American Indian / Alaska Native residents45.8 Median age for Asian residents39.5 50.4 37.8 Median age for Other race residents35.4 37.4 21.8 Median age for Two or more races residents7.5 75.0 44.6 Median age for White alone residents47.1 42.4 32.6 Median age for Hispanic or Latino residents34.6 31.0
Owner/renter occupied households by race in Fowler
House owners and renters - White residents 697 53.6% Owner occupied603 46.4% Renter occupiedHouse owners and renters - American Indian / Alaska Native residents 43 74.7% Owner occupied15 25.3% Renter occupiedHouse owners and renters - Asian residents 233 90.8% Owner occupied24 9.2% Renter occupiedHouse owners and renters - Other race residents 82 31.5% Owner occupied179 68.5% Renter occupiedHouse owners and renters - Two or more races residents 129 39.4% Owner occupied198 60.6% Renter occupiedHouse owners and renters - White alone residents 284 55.4% Owner occupied228 44.6% Renter occupiedHouse owners and renters - Hispanic or Latino residents 665 49.3% Owner occupied685 50.7% Renter occupied
Language usage in Fowler
English speakers - Total 57.1% of residents of Fowler speak English at home.
32.2% of residents speak Spanish at home 1,425 72.5% Speak English very well540 27.5% Speak English less than very well10.8% of residents speak other language at home 376 57.1% Speak English very well282 42.9% Speak English less than very well
English speakers - Born in the United States 68.0% of residents of Fowler speak English at home.
25.3% of residents speak Spanish at home 83 57.6% Speak English very well61 42.4% Speak English less than very well6.2% of residents speak other language at home 28 80.0% Speak English very well7 20.0% Speak English less than very well
English speakers - Native, born elsewhere 79.6% of residents of Fowler speak English at home.
20.9% of residents speak Spanish at home 22 55.0% Speak English very well18 45.0% Speak English less than very well
English speakers - Foreign-born 11.2% of residents of Fowler speak English at home.
41.7% of residents speak Spanish at home 171 34.1% Speak English very well330 65.9% Speak English less than very well47.1% of residents speak other language at home 301 53.2% Speak English very well265 46.8% Speak English less than very well
White (Caucasian) - Speak only English Native:
71.5% (2,348)Foreign-born:
26.3% (75)
White (Caucasian) - Speak another language Native:
24.9% (817)Foreign-born:
72.4% (207)
Asian - Speak another language Native:
23.6% (59)Foreign-born:
99.1% (590)
Other race - Speak only English Native:
53.9% (331)Foreign-born:
4.6% (10)
Other race - Speak another language Native:
48.5% (298)Foreign-born:
94.2% (208)
White alone - Speak another language Native:
5.3% (60)Foreign-born:
100.0% (7)
Hispanic or Latino - Speak only English Native:
58.3% (2,124)Foreign-born:
18.2% (110)
Hispanic or Latino - Speak another language Native:
42.7% (1,554)Foreign-born:
80.5% (485)
Foreign-born residents in Fowler 1,238 residents are foreign born (10.0% Latin America , 8.6% Asia ).
This city:
18.7%California:
100.0%
Marital status for residents in Fowler Marital status - White (Caucasian) population 15 years and over
Males 37.9% Never married41.6% Now married6.7% Separated3.2% Widowed10.6% DivorcedFemales 33.7% Never married42.8% Now married5.9% Separated6.3% Widowed11.3% DivorcedWomen who gave birth in the past 12 months Now married:
0.0% (0)Unmarried:
100.0% (5)
Women who did not give birth in the past 12 months Now married:
44.5% (380)Unmarried:
55.5% (474)
Marital status - Black or African American population 15 years and over
Males 100.0% Never married0.0% Now married0.0% Separated0.0% Widowed0.0% DivorcedFemales 0.0% Never married0.0% Now married0.0% Separated0.0% Widowed100.0% DivorcedWomen who did not give birth in the past 12 months Now married:
0.0% (0)Unmarried:
100.0% (15)
Marital status - American Indian / Alaska Native population 15 years and over
Males 0.0% Never married100.0% Now married0.0% Separated0.0% Widowed0.0% DivorcedFemales 0.0% Never married100.0% Now married0.0% Separated0.0% Widowed0.0% DivorcedMarital status - Asian population 15 years and over
Males 34.9% Never married60.3% Now married0.0% Separated0.6% Widowed4.2% DivorcedFemales 21.7% Never married50.6% Now married2.3% Separated19.4% Widowed6.0% DivorcedWomen who gave birth in the past 12 months Now married:
100.0% (9)Unmarried:
0.0% (0)
Women who did not give birth in the past 12 months Now married:
52.6% (82)Unmarried:
47.4% (74)
Marital status - Other race population 15 years and over
Males 47.3% Never married40.5% Now married0.0% Separated3.6% Widowed8.6% DivorcedFemales 25.7% Never married37.1% Now married6.9% Separated11.0% Widowed19.2% DivorcedWomen who did not give birth in the past 12 months Now married:
31.7% (46)Unmarried:
68.3% (99)
Marital status - Two or more races population 15 years and over
Males 64.2% Never married35.8% Now married0.0% Separated0.0% Widowed0.0% DivorcedFemales 5.8% Never married13.3% Now married0.0% Separated51.7% Widowed29.2% DivorcedWomen who did not give birth in the past 12 months Now married:
69.6% (44)Unmarried:
30.4% (19)
Marital status - White alone, not Hispanic / Latino population 15 years and over
Males 19.8% Never married63.2% Now married0.0% Separated2.5% Widowed14.5% DivorcedFemales 22.7% Never married38.8% Now married6.0% Separated16.7% Widowed15.7% DivorcedWomen who did not give birth in the past 12 months Now married:
49.5% (163)Unmarried:
50.5% (167)
Marital status - Hispanic or Latino population 15 years and over
Males 45.1% Never married35.5% Now married7.3% Separated3.2% Widowed8.8% DivorcedFemales 36.3% Never married43.2% Now married6.5% Separated2.3% Widowed11.6% DivorcedWomen who gave birth in the past 12 months Now married:
0.0% (0)Unmarried:
100.0% (7)
Women who did not give birth in the past 12 months Now married:
40.3% (367)Unmarried:
59.7% (543)
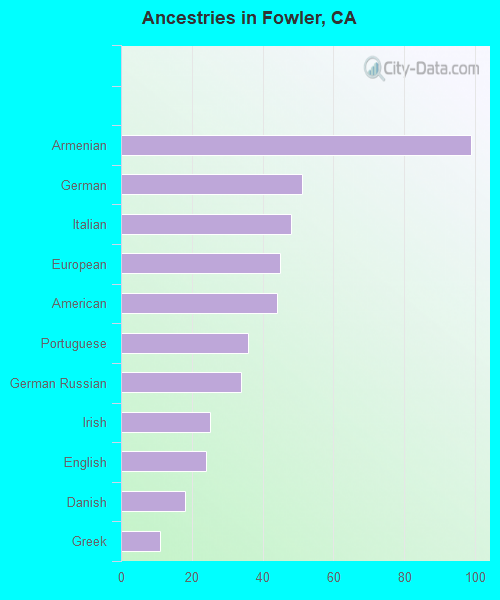
Ancestries in Fowler
127 3.1% European113 2.8% German46 1.1% Portuguese45 1.1% English39 1.0% American29 0.7% Armenian13 0.3% Dutch9 0.2% British7 0.2% Danish6 0.1% French5 0.1% Swedish2 0.05% Irish
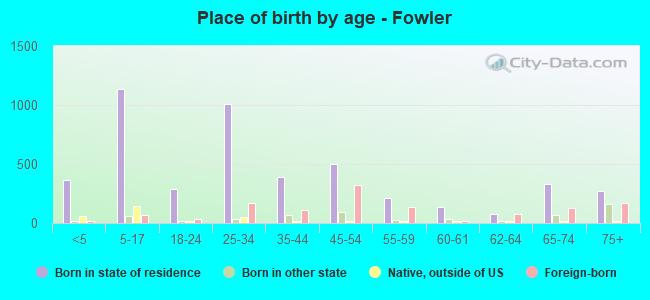
Children Nativity (place of birth) in Fowler
Children under 6 years - Living with two parents Both parents native 180 100.0% NativeBoth parents foreign-born 42 84.3% Native8 15.7% Foreign-bornChildren under 6 years - Living with one parent Native parent 202 100.0% Native0 0.0% Foreign-bornForeign-born parent 28 74.6% Native10 25.4% Foreign-bornChildren 6 to 17 years - Living with two parents Both parents native 505 100.0% Native0 0.0% Foreign-bornBoth parents foreign-born 41 45.8% Native48 54.2% Foreign-bornChildren 6 to 17 years - Living with one parent Native parent 552 100.0% NativeForeign-born parent 226 48.8% Native237 51.2% Foreign-born
Grandparents responsible for own grandchildren in Fowler
Grandparents (30 to 59 years) White / Caucasian 49 100.0% Not responsible for grandchildrenAsian 30 100.0% Not responsible for grandchildrenOther race 17 100.0% Not responsible for grandchildrenHispanic or Latino 103 100.0% Not responsible for grandchildrenGrandparents (60 years and over) White / Caucasian 12 18.2% Responsible for grandchildren54 81.8% Not responsible for grandchildrenAsian 73 100.0% Not responsible for grandchildrenOther race 18 100.0% Not responsible for grandchildrenHispanic or Latino 25 26.3% Responsible for grandchildren69 73.7% Not responsible for grandchildren