Races in Franklin, Maine (ME) Detailed Stats
Ancestries, Foreign-born residents, place of birth

Recent posts about races in Franklin, Maine on our local forum with over 2,400,000 registered users:
 | Affordable small house in Franklin; $179K; colors ugh! (22 replies) |
| Small houses Part 2 (86 replies) |
| Winterizing house questions (26 replies) |
| If Oil Boiler Goes - Replace it or Choose Something Else? (66 replies) |
| Purchased a Franklin, Maine property (43 replies) |
| Pellet woodstoves- big problem question (55 replies) |
Latest news about races in Franklin, ME collected exclusively by city-data.com from local newspapers, TV, and radio stations
3.0% of Franklin, ME residents are foreign-born (2.0% born in Europe, 0.6% born in Asia), which is about the same as the foreign-born rate of 3.0% across the entire state of Maine.
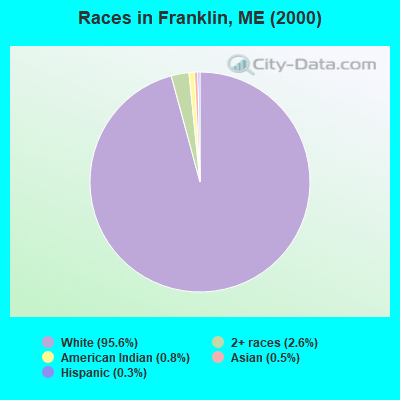
Race distribution in Franklin

- 1,31095.6%White alone
- 362.6%Two or more races
- 110.8%American Indian alone
- 70.5%Asian alone
- 40.3%Hispanic
- 10.07%Black alone
- 10.07%Other race alone
2000
2022
-
- 1,230,29796.5%White alone
- 11,7310.9%Two or more races
- 9,3600.7%Hispanic
- 9,0140.7%Asian alone
- 6,4400.5%Black alone
- 6,9110.5%American Indian alone
- 8360.07%Other race alone
- 3340.03%Native Hawaiian and Other
Pacific Islander alone

-
- 1,249,23390.2%White alone
- 58,3574.2%Two or more races
- 28,7172.1%Hispanic
- 21,5831.6%Black alone
- 16,1511.2%Asian alone
- 5,8730.4%Other race alone
- 5,2050.4%American Indian alone
- 2210.02%Native Hawaiian and Other
Pacific Islander alone

Income and house value in Franklin
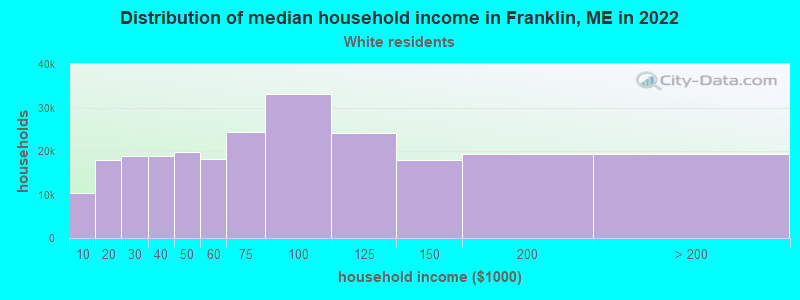
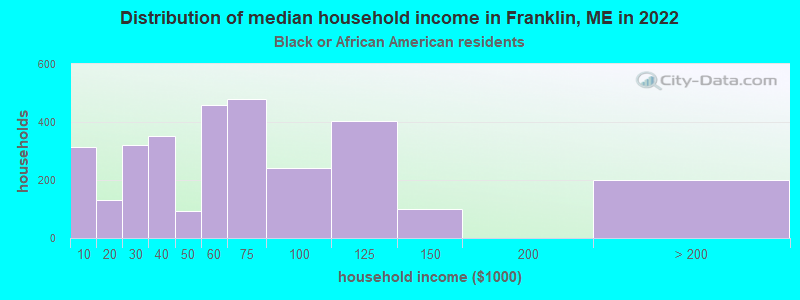
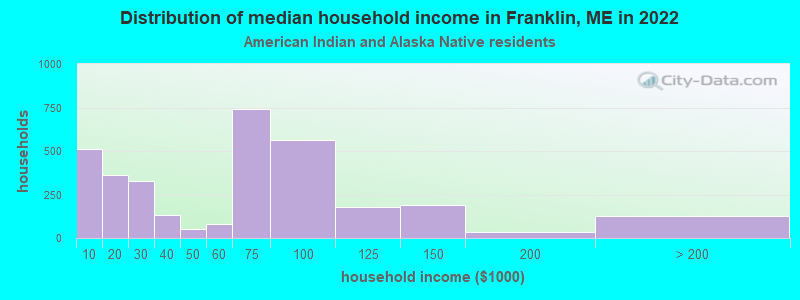
- Median household income in 2022
- $60,298White non-Hispanic householders
- $18,892Black householders
- $57,590American Indian and Alaska Native householders
- $56,591Asian householders
- $13,697Some other race householders
- $101,638Two or more races householders
- $65,142Hispanic or Latino race householders
- Median 2022 house value
- $244,000White Non-Hispanic householders
- $214,789American Indian or Alaska Native householders
- $536,973Some other race householders
- $214,789Two or more races householders
- $393,780Hispanic or Latino householders
Household income for White non-Hispanic householders
Household income for Black householders
Household income for American Indian and Alaska Native householders
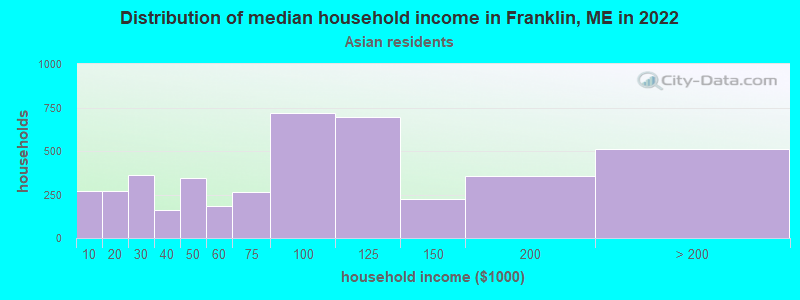
Household income for Asian householders
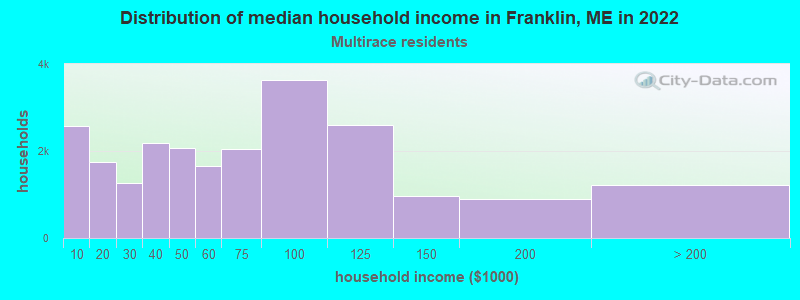
Household income for Two or more races householders
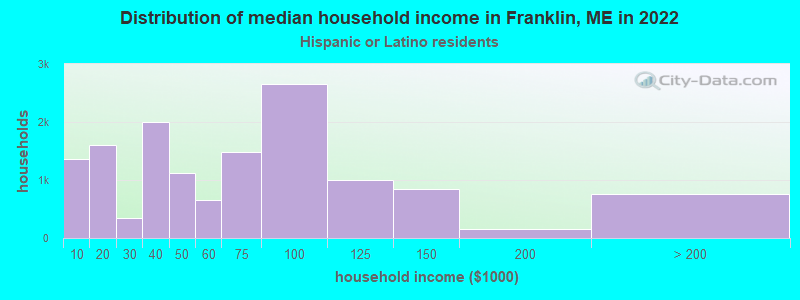
Household income for Hispanic or Latino race householders
Foreign-born residents in Franklin
41 residents are foreign born (2.0% Europe, 0.6% Asia).
| This city: | 3.0% |
| Maine: | 2.9% |
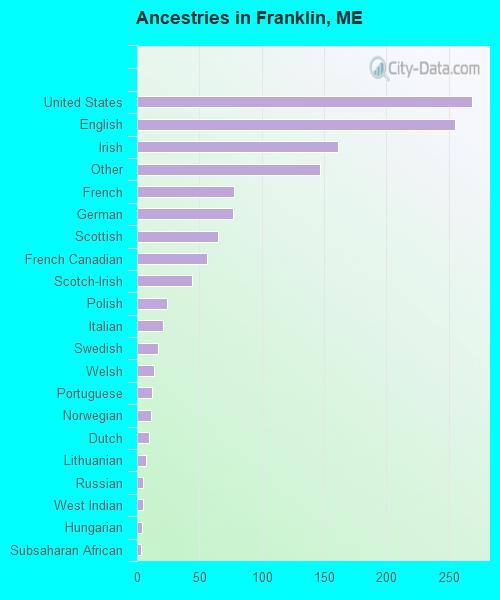
Ancestries in Franklin

- 26920.9%United States
- 25519.8%English
- 16112.5%Irish
- 14711.4%Other
- 786.1%French
- 776.0%German
- 655.1%Scottish
- 564.4%French Canadian
- 443.4%Scotch-Irish
- 241.9%Polish
- 211.6%Italian
- 171.3%Swedish
- 141.1%Welsh
- 120.9%Portuguese
- 110.9%Norwegian
- 100.8%Dutch
- 70.5%Lithuanian
- 50.4%Russian
- 50.4%West Indian
- 40.3%Hungarian
- 30.2%Subsaharan African
- 20.2%Greek
Zip codes: 04634.