Races in Frederick, Maryland (MD) Detailed Stats
Data:
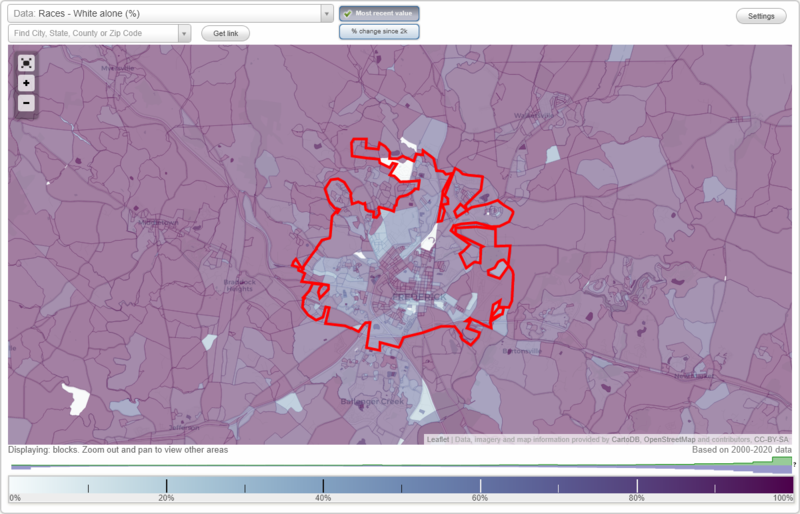
Races - White alone (%)
Races - White alone (% change since 2000)
Races - Black alone (%)
Races - Black alone (% change since 2000)
Races - American Indian alone (%)
Races - American Indian alone (% change since 2000)
Races - Asian alone (%)
Races - Asian alone (% change since 2000)
Races - Hispanic (%)
Races - Hispanic (% change since 2000)
Races - Native Hawaiian and Other Pacific Islander alone (%)
Races - Native Hawaiian and Other Pacific Islander alone (% change since 2000)
Races - Two or more races(%)
Races - Two or more races(% change since 2000)
Races - Other race alone (%)
Races - Other race alone (% change since 2000)
Racial diversity
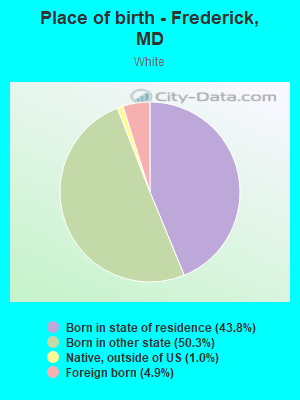
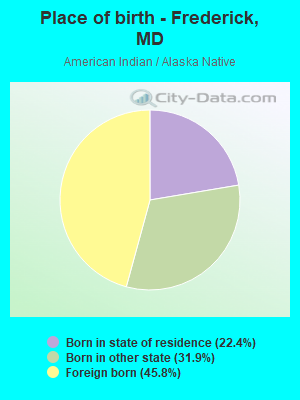
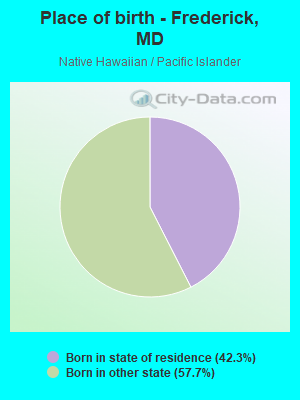
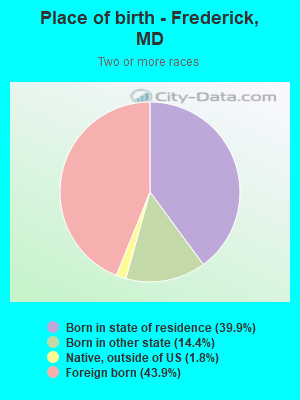
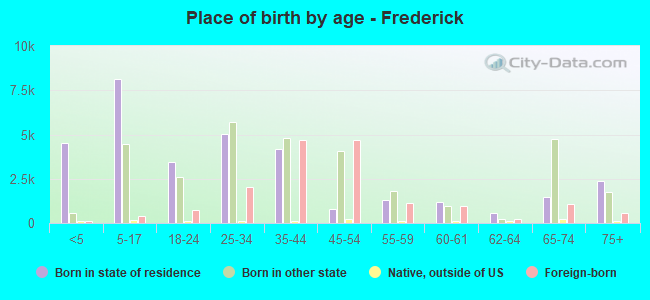
Place of birth - Born in state of residence (%)
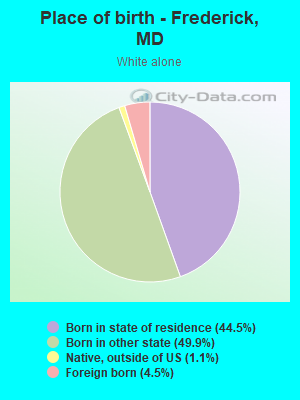
Place of birth - Born in state of residence (%) - White
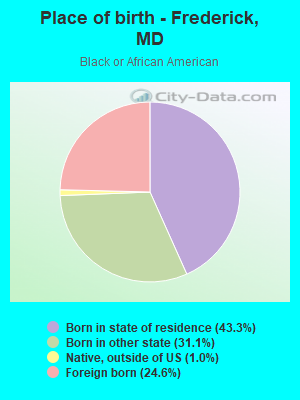
Place of birth - Born in state of residence (%) - Black or African American
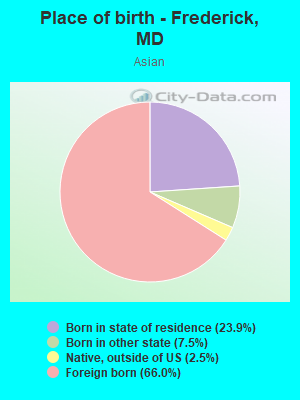
Place of birth - Born in state of residence (%) - Asian
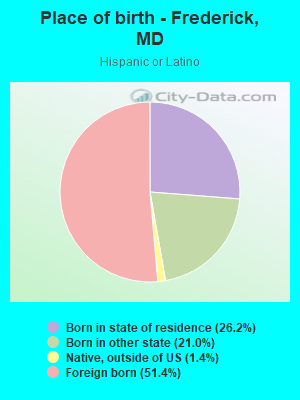
Place of birth - Born in state of residence (%) - Hispanic or Latino
Place of birth - Born in state of residence (%) - American Indian and Alaska Native
Place of birth - Born in state of residence (%) - Multirace
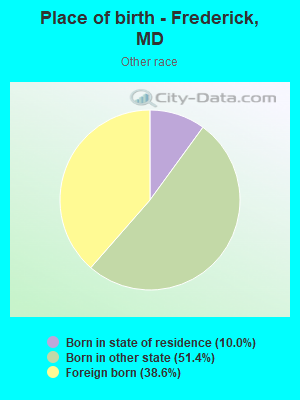
Place of birth - Born in state of residence (%) - Other Race
Place of birth - Born in other state (%)
Place of birth - Born in other state (%) - White
Place of birth - Born in other state (%) - Black or African American
Place of birth - Born in other state (%) - Asian
Place of birth - Born in other state (%) - Hispanic or Latino
Place of birth - Born in other state (%) - American Indian and Alaska Native
Place of birth - Born in other state (%) - Multirace
Place of birth - Born in other state (%) - Other Race
Place of birth - Native, outside of US (%)
Place of birth - Native, outside of US (%) - White
Place of birth - Native, outside of US (%) - Black or African American
Place of birth - Native, outside of US (%) - Asian
Place of birth - Native, outside of US (%) - Hispanic or Latino
Place of birth - Native, outside of US (%) - American Indian and Alaska Native
Place of birth - Native, outside of US (%) - Multirace
Place of birth - Native, outside of US (%) - Other Race
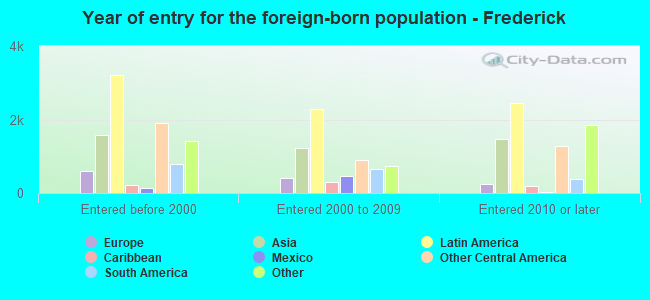
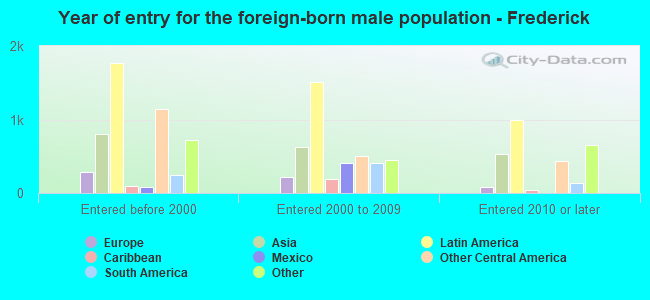
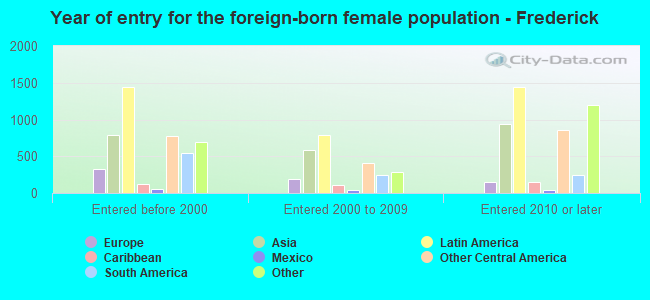
Place of birth - Foreign born (%)
Place of birth - Foreign born (%) - White
Place of birth - Foreign born (%) - Black or African American
Place of birth - Foreign born (%) - Asian
Place of birth - Foreign born (%) - Hispanic or Latino
Place of birth - Foreign born (%) - American Indian and Alaska Native
Place of birth - Foreign born (%) - Multirace
Place of birth - Foreign born (%) - Other Race
Residents speaking English at home (%)
Residents speaking English at home - Born in the United States (%)
Residents speaking English at home - Native, born elsewhere (%)
Residents speaking English at home - Foreign born (%)
Residents speaking Spanish at home (%)
Residents speaking Spanish at home - Born in the United States (%)
Residents speaking Spanish at home - Native, born elsewhere (%)
Residents speaking Spanish at home - Foreign born (%)
Residents speaking other language at home (%)
Residents speaking other language at home - Born in the United States (%)
Residents speaking other language at home - Native, born elsewhere (%)
Residents speaking other language at home - Foreign born (%)
Marital status - Never married (%)
Marital status - Now married (%)
Marital status - Separated (%)
Marital status - Widowed (%)
Marital status - Divorced (%)
Ancestries Reported - Arab (%)
Ancestries Reported - Czech (%)
Ancestries Reported - Danish (%)
Ancestries Reported - Dutch (%)
Ancestries Reported - English (%)
Ancestries Reported - French (%)
Ancestries Reported - French Canadian (%)
Ancestries Reported - German (%)
Ancestries Reported - Greek (%)
Ancestries Reported - Hungarian (%)
Ancestries Reported - Irish (%)
Ancestries Reported - Italian (%)
Ancestries Reported - Lithuanian (%)
Ancestries Reported - Norwegian (%)
Ancestries Reported - Polish (%)
Ancestries Reported - Portuguese (%)
Ancestries Reported - Russian (%)
Ancestries Reported - Scotch-Irish (%)
Ancestries Reported - Scottish (%)
Ancestries Reported - Slovak (%)
Ancestries Reported - Subsaharan African (%)
Ancestries Reported - Swedish (%)
Ancestries Reported - Swiss (%)
Ancestries Reported - Ukrainian (%)
Ancestries Reported - United States (%)
Ancestries Reported - Welsh (%)
Ancestries Reported - West Indian (%)
Ancestries Reported - Other (%)
Geographical mobility - Same house 1 year ago (%)
Geographical mobility - Same house 1 year ago (%) - White
Geographical mobility - Same house 1 year ago (%) - Black or African American
Geographical mobility - Same house 1 year ago (%) - Asian
Geographical mobility - Same house 1 year ago (%) - Hispanic or Latino
Geographical mobility - Same house 1 year ago (%) - American Indian and Alaska Native
Geographical mobility - Same house 1 year ago (%) - Multirace
Geographical mobility - Same house 1 year ago (%) - Other Race
Geographical mobility - Moved within same county (%)
Geographical mobility - Moved within same county (%) - White
Geographical mobility - Moved within same county (%) - Black or African American
Geographical mobility - Moved within same county (%) - Asian
Geographical mobility - Moved within same county (%) - Hispanic or Latino
Geographical mobility - Moved within same county (%) - American Indian and Alaska Native
Geographical mobility - Moved within same county (%) - Multirace
Geographical mobility - Moved within same county (%) - Other Race
Geographical mobility - Moved from different county within same state (%)
Geographical mobility - Moved from different county within same state (%) - White
Geographical mobility - Moved from different county within same state (%) - Black or African American
Geographical mobility - Moved from different county within same state (%) - Asian
Geographical mobility - Moved from different county within same state (%) - Hispanic or Latino
Geographical mobility - Moved from different county within same state (%) - American Indian and Alaska Native
Geographical mobility - Moved from different county within same state (%) - Multirace
Geographical mobility - Moved from different county within same state (%) - Other Race
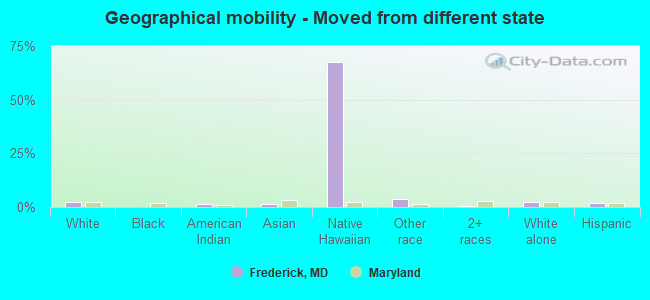
Geographical mobility - Moved from different state (%)
Geographical mobility - Moved from different state (%) - White
Geographical mobility - Moved from different state (%) - Black or African American
Geographical mobility - Moved from different state (%) - Asian
Geographical mobility - Moved from different state (%) - Hispanic or Latino
Geographical mobility - Moved from different state (%) - American Indian and Alaska Native
Geographical mobility - Moved from different state (%) - Multirace
Geographical mobility - Moved from different state (%) - Other Race
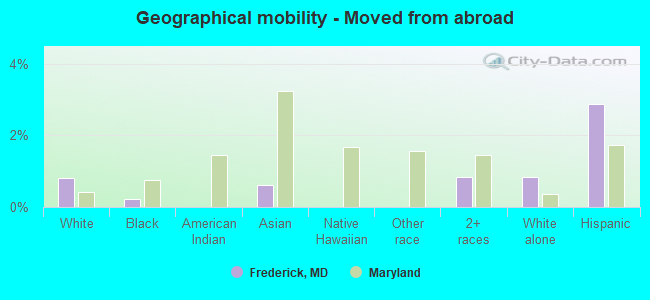
Geographical mobility - Moved from abroad (%)
Geographical mobility - Moved from abroad (%) - White
Geographical mobility - Moved from abroad (%) - Black or African American
Geographical mobility - Moved from abroad (%) - Asian
Geographical mobility - Moved from abroad (%) - Hispanic or Latino
Geographical mobility - Moved from abroad (%) - American Indian and Alaska Native
Geographical mobility - Moved from abroad (%) - Multirace
Geographical mobility - Moved from abroad (%) - Other Race
Place of birth for the foreign-born population - Ireland (%)
Place of birth for the foreign-born population - Denmark (%)
Place of birth for the foreign-born population - Norway (%)
Place of birth for the foreign-born population - Sweden (%)
Place of birth for the foreign-born population - United Kingdom (%)
Place of birth for the foreign-born population - England (%)
Place of birth for the foreign-born population - Scotland (%)
Place of birth for the foreign-born population - Other Northern Europe (%)
Place of birth for the foreign-born population - Austria (%)
Place of birth for the foreign-born population - Belgium (%)
Place of birth for the foreign-born population - France (%)
Place of birth for the foreign-born population - Germany (%)
Place of birth for the foreign-born population - Netherlands (%)
Place of birth for the foreign-born population - Switzerland (%)
Place of birth for the foreign-born population - Other Western Europe (%)
Place of birth for the foreign-born population - Greece (%)
Place of birth for the foreign-born population - Italy (%)
Place of birth for the foreign-born population - Portugal (%)
Place of birth for the foreign-born population - Spain (%)
Place of birth for the foreign-born population - Other Southern Europe (%)
Place of birth for the foreign-born population - Albania (%)
Place of birth for the foreign-born population - Belarus (%)
Place of birth for the foreign-born population - Bosnia and Herzegovina (%)
Place of birth for the foreign-born population - Bulgaria (%)
Place of birth for the foreign-born population - Croatia (%)
Place of birth for the foreign-born population - Czechoslovakia (%)
Place of birth for the foreign-born population - Hungary (%)
Place of birth for the foreign-born population - Latvia (%)
Place of birth for the foreign-born population - Lithuania (%)
Place of birth for the foreign-born population - North Macedonia (Macedonia) (%)
Place of birth for the foreign-born population - Moldova (%)
Place of birth for the foreign-born population - Poland (%)
Place of birth for the foreign-born population - Romania (%)
Place of birth for the foreign-born population - Russia (%)
Place of birth for the foreign-born population - Serbia (%)
Place of birth for the foreign-born population - Ukraine (%)
Place of birth for the foreign-born population - Other Eastern Europe (%)
Place of birth for the foreign-born population - China (%)
Place of birth for the foreign-born population - Hong Kong (%)
Place of birth for the foreign-born population - Taiwan (%)
Place of birth for the foreign-born population - Japan (%)
Place of birth for the foreign-born population - Korea (%)
Place of birth for the foreign-born population - Other Eastern Asia (%)
Place of birth for the foreign-born population - Afghanistan (%)
Place of birth for the foreign-born population - Bangladesh (%)
Place of birth for the foreign-born population - India (%)
Place of birth for the foreign-born population - Iran (%)
Place of birth for the foreign-born population - Kazakhstan (%)
Place of birth for the foreign-born population - Nepal (%)
Place of birth for the foreign-born population - Pakistan (%)
Place of birth for the foreign-born population - Sri Lanka (%)
Place of birth for the foreign-born population - Uzbekistan (%)
Place of birth for the foreign-born population - Other South Central Asia (%)
Place of birth for the foreign-born population - Burma (%)
Place of birth for the foreign-born population - Cambodia (%)
Place of birth for the foreign-born population - Indonesia (%)
Place of birth for the foreign-born population - Laos (%)
Place of birth for the foreign-born population - Malaysia (%)
Place of birth for the foreign-born population - Philippines (%)
Place of birth for the foreign-born population - Singapore (%)
Place of birth for the foreign-born population - Thailand (%)
Place of birth for the foreign-born population - Vietnam (%)
Place of birth for the foreign-born population - Other South Eastern Asia (%)
Place of birth for the foreign-born population - Armenia (%)
Place of birth for the foreign-born population - Iraq (%)
Place of birth for the foreign-born population - Israel (%)
Place of birth for the foreign-born population - Jordan (%)
Place of birth for the foreign-born population - Kuwait (%)
Place of birth for the foreign-born population - Lebanon (%)
Place of birth for the foreign-born population - Saudi Arabia (%)
Place of birth for the foreign-born population - Syria (%)
Place of birth for the foreign-born population - Turkey (%)
Place of birth for the foreign-born population - Yemen (%)
Place of birth for the foreign-born population - Other Western Asia (%)
Place of birth for the foreign-born population - Eritrea (%)
Place of birth for the foreign-born population - Ethiopia (%)
Place of birth for the foreign-born population - Kenya (%)
Place of birth for the foreign-born population - Somalia (%)
Place of birth for the foreign-born population - Uganda (%)
Place of birth for the foreign-born population - Zimbabwe (%)
Place of birth for the foreign-born population - Other Eastern Africa (%)
Place of birth for the foreign-born population - Cameroon (%)
Place of birth for the foreign-born population - Congo (%)
Place of birth for the foreign-born population - Democratic Republic of Congo (Zaire) (%)
Place of birth for the foreign-born population - Other Middle Africa (%)
Place of birth for the foreign-born population - Egypt (%)
Place of birth for the foreign-born population - Morocco (%)
Place of birth for the foreign-born population - Sudan (%)
Place of birth for the foreign-born population - Other Northern Africa (%)
Place of birth for the foreign-born population - South Africa (%)
Place of birth for the foreign-born population - Other Southern Africa (%)
Place of birth for the foreign-born population - Cabo Verde (%)
Place of birth for the foreign-born population - Ghana (%)
Place of birth for the foreign-born population - Liberia (%)
Place of birth for the foreign-born population - Nigeria (%)
Place of birth for the foreign-born population - Senegal (%)
Place of birth for the foreign-born population - Sierra Leone (%)
Place of birth for the foreign-born population - Other Western Africa (%)
Place of birth for the foreign-born population - Australia (%)
Place of birth for the foreign-born population - New Zealand (%)
Place of birth for the foreign-born population - Fiji (%)
Place of birth for the foreign-born population - Micronesia (%)
Place of birth for the foreign-born population - Bahamas (%)
Place of birth for the foreign-born population - Barbados (%)
Place of birth for the foreign-born population - Cuba (%)
Place of birth for the foreign-born population - Dominica (%)
Place of birth for the foreign-born population - Dominican Republic (%)
Place of birth for the foreign-born population - Grenada (%)
Place of birth for the foreign-born population - Haiti (%)
Place of birth for the foreign-born population - Jamaica (%)
Place of birth for the foreign-born population - St. Vincent and the Grenadines (%)
Place of birth for the foreign-born population - Trinidad and Tobago (%)
Place of birth for the foreign-born population - West Indies (%)
Place of birth for the foreign-born population - Other Caribbean (%)
Place of birth for the foreign-born population - Belize (%)
Place of birth for the foreign-born population - Costa Rica (%)
Place of birth for the foreign-born population - El Salvador (%)
Place of birth for the foreign-born population - Guatemala (%)
Place of birth for the foreign-born population - Honduras (%)
Place of birth for the foreign-born population - Mexico (%)
Place of birth for the foreign-born population - Nicaragua (%)
Place of birth for the foreign-born population - Panama (%)
Place of birth for the foreign-born population - Other Central America (%)
Place of birth for the foreign-born population - Argentina (%)
Place of birth for the foreign-born population - Bolivia (%)
Place of birth for the foreign-born population - Brazil (%)
Place of birth for the foreign-born population - Chile (%)
Place of birth for the foreign-born population - Colombia (%)
Place of birth for the foreign-born population - Ecuador (%)
Place of birth for the foreign-born population - Guyana (%)
Place of birth for the foreign-born population - Peru (%)
Place of birth for the foreign-born population - Uruguay (%)
Place of birth for the foreign-born population - Venezuela (%)
Place of birth for the foreign-born population - Other South America (%)
Place of birth for the foreign-born population - Canada (%)
Place of birth for the foreign-born population - Other Northern America (%)
Place of birth for the foreign-born population - Other (%)
Latest news about races in Frederick, MD collected exclusively by city-data.com from local newspapers, TV, and radio stations
According to 2022 data, the most numerous races in Frederick, MD are White alone (42,376 residents), Black alone (13,798 residents), and Hispanic (15,798 residents). 74.7% of Frederick residents speak English at home. 19.4% of Frederick, MD residents are foreign-born (10.3% born in Latin America, 4.0% born in Asia, 2.9% born in Africa), which is 17.4% greater than the foreign-born rate of 16.0% across the entire state of Maryland.
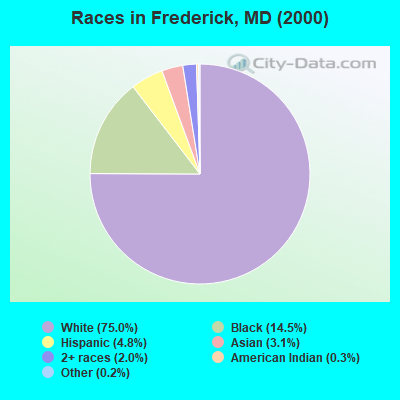
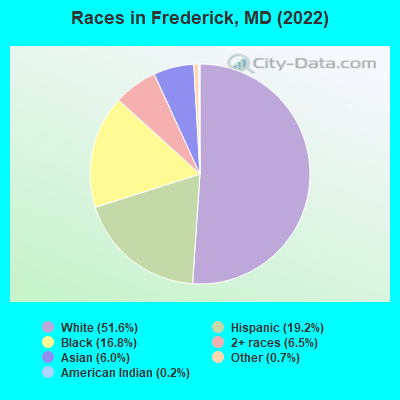
Race distribution in Frederick
2000 2022
39,568 75.0% White alone 7,641 14.5% Black alone 2,533 4.8% Hispanic 1,651 3.1% Asian alone 1,080 2.0% Two or more races 142 0.3% American Indian alone 123 0.2% Other race alone 29 0.05% Native Hawaiian and Other
42,376 51.6% White alone 15,798 19.2% Hispanic 13,798 16.8% Black alone 5,333 6.5% Two or more races 4,929 6.0% Asian alone 601 0.7% Other race alone 157 0.2% American Indian alone 11 0.01% Native Hawaiian and Other
2000 2022
3,286,547 62.1% White alone 1,464,735 27.7% Black alone 227,916 4.3% Hispanic 209,738 4.0% Asian alone 82,946 1.6% Two or more races 13,312 0.3% American Indian alone 9,379 0.2% Other race alone 1,913 0.04% Native Hawaiian and Other
2,906,492 47.1% White alone 1,800,914 29.2% Black alone 705,842 11.4% Hispanic 401,818 6.5% Asian alone 291,317 4.7% Two or more races 46,930 0.8% Other race alone 8,930 0.1% American Indian alone 2,417 0.04% Native Hawaiian and Other
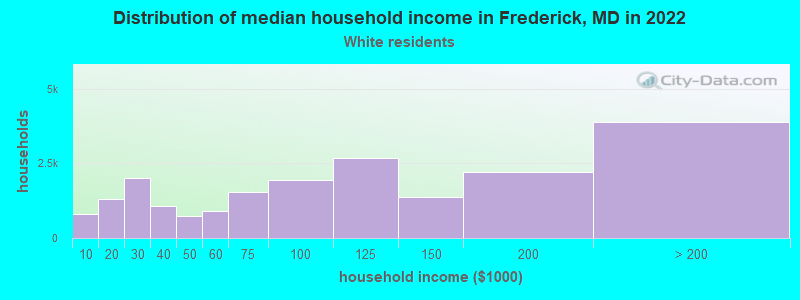
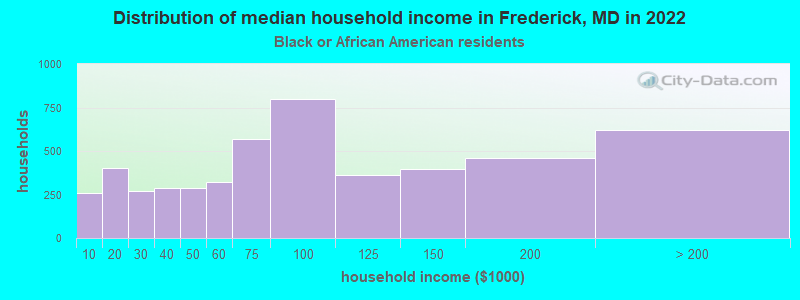
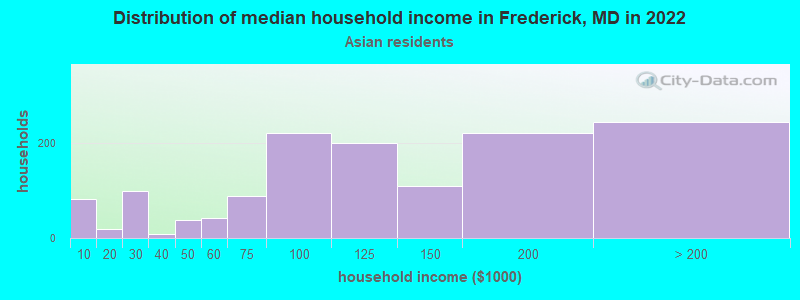
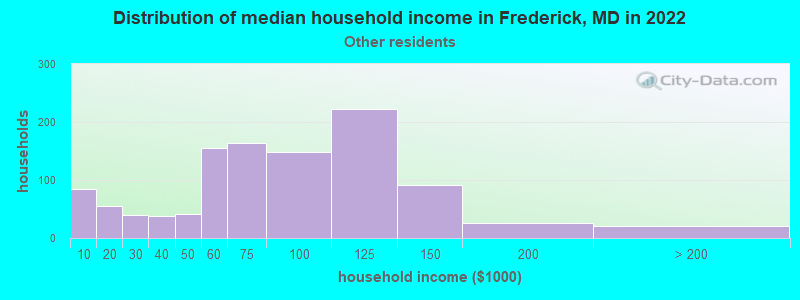
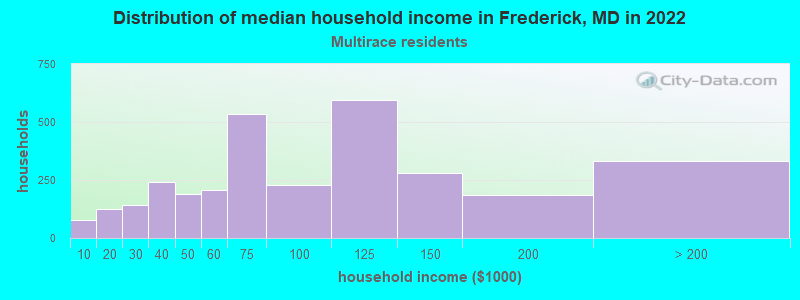
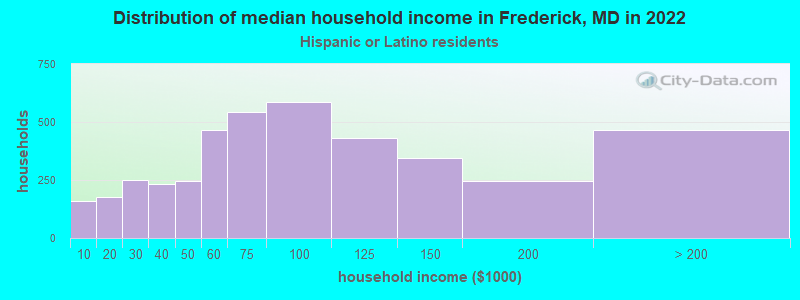
Income and house value in Frederick Median household income in 2022 $96,045 White non-Hispanic householders$93,543 Black householders$101,534 Asian householders$79,449 Some other race householders$79,275 Two or more races householders$93,153 Hispanic or Latino race householdersMedian 2022 house value $416,366 White Non-Hispanic householders$350,890 Black or African American householders$291,962 American Indian or Alaska Native householders $427,973 Asian householders$395,235 Some other race householders$430,354 Two or more races householders$414,878 Hispanic or Latino householders
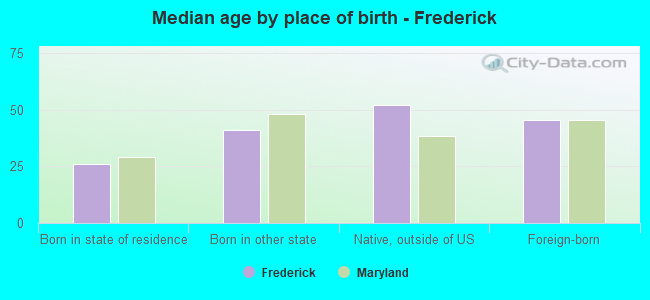
Median age by race in Frederick
41.2 Median age for White residents39.5 42.5 33.2 Median age for Black or African American residents35.6 29.9 24.4 Median age for American Indian / Alaska Native residents-666,666,666.0 24.5 39.9 Median age for Asian residents47.2 35.2 -666,666,666.0 Median age for Native Hawaiian / Pacific Islander residents-666,666,666.0 -666,666,666.0 29.6 Median age for Other race residents33.6 27.9 32.9 Median age for Two or more races residents32.3 37.0 41.4 Median age for White alone residents39.4 43.1 39.1 Median age for Hispanic or Latino residents39.6 34.2
Owner/renter occupied households by race in Frederick
House owners and renters - White residents 12,051 58.9% Owner occupied8,412 41.1% Renter occupiedHouse owners and renters - Black or African American residents 2,871 54.8% Owner occupied2,366 45.2% Renter occupiedHouse owners and renters - American Indian / Alaska Native residents 18 100.0% Renter occupiedHouse owners and renters - Asian residents 1,326 68.3% Owner occupied615 31.7% Renter occupiedHouse owners and renters - Native Hawaiian / Pacific Islander residents 7 100.0% Owner occupiedHouse owners and renters - Other race residents 694 54.9% Owner occupied570 45.1% Renter occupiedHouse owners and renters - Two or more races residents 1,761 54.9% Owner occupied1,445 45.1% Renter occupiedHouse owners and renters - White alone residents 11,983 59.4% Owner occupied8,191 40.6% Renter occupiedHouse owners and renters - Hispanic or Latino residents 1,998 56.1% Owner occupied1,562 43.9% Renter occupied
Language usage in Frederick
English speakers - Total 74.7% of residents of Frederick speak English at home.
11.2% of residents speak Spanish at home 4,659 53.9% Speak English very well3,984 46.1% Speak English less than very well14.0% of residents speak other language at home 7,789 72.0% Speak English very well3,031 28.0% Speak English less than very well
English speakers - Born in the United States 88.9% of residents of Frederick speak English at home.
5.6% of residents speak Spanish at home 1,633 94.4% Speak English very well97 5.6% Speak English less than very well5.5% of residents speak other language at home 1,716 100.0% Speak English very well
English speakers - Native, born elsewhere 93.8% of residents of Frederick speak English at home.
6.2% of residents speak other language at home 59 100.0% Speak English very well
English speakers - Foreign-born 20.9% of residents of Frederick speak English at home.
31.2% of residents speak Spanish at home 1,809 35.2% Speak English very well3,336 64.8% Speak English less than very well47.9% of residents speak other language at home 4,889 62.0% Speak English very well2,998 38.0% Speak English less than very well
White (Caucasian) - Speak only English Native:
96.6% (39,907)Foreign-born:
45.9% (974)
White (Caucasian) - Speak another language Native:
3.4% (1,394)Foreign-born:
54.1% (1,147)
Black or African American - Speak only English Native:
85.8% (8,535)Foreign-born:
36.1% (1,397)
Black or African American - Speak another language Native:
14.2% (1,415)Foreign-born:
63.9% (2,473)
American Indian / Alaska Native - Speak only English Native:
72.5% (112)Foreign-born:
11.4% (15)
American Indian / Alaska Native - Speak another language Native:
14.6% (23)Foreign-born:
78.4% (103)
Asian - Speak only English Native:
39.5% (585)Foreign-born:
15.7% (530)
Asian - Speak another language Native:
60.5% (896)Foreign-born:
84.3% (2,855)
Other race - Speak only English Native:
37.3% (890)Foreign-born:
8.1% (176)
Other race - Speak another language Native:
61.7% (1,470)Foreign-born:
91.8% (1,980)
Two or more races - Speak only English Native:
74.2% (3,742)Foreign-born:
10.0% (494)
Two or more races - Speak another language Native:
25.8% (1,304)Foreign-born:
90.0% (4,428)
White alone - Speak only English Native:
97.8% (39,585)Foreign-born:
48.2% (931)
White alone - Speak another language Native:
2.2% (886)Foreign-born:
51.8% (999)
Hispanic or Latino - Speak only English Native:
36.4% (1,657)Foreign-born:
11.0% (639)
Hispanic or Latino - Speak another language Native:
63.6% (2,895)Foreign-born:
89.0% (5,145)
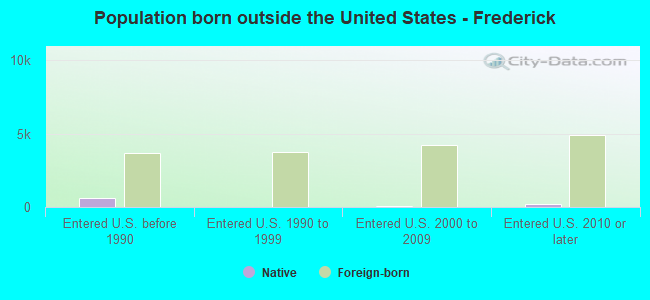
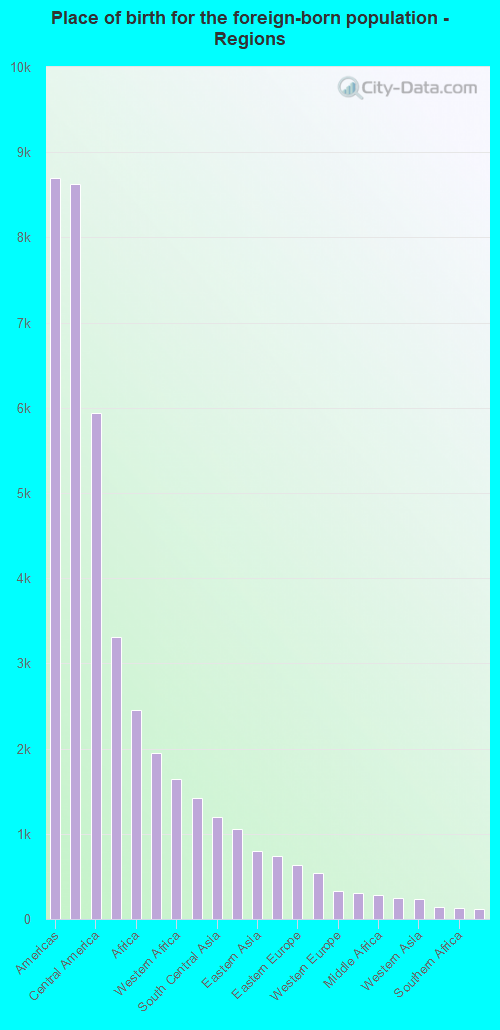
Foreign-born residents in Frederick 15,921 residents are foreign born (10.3% Latin America , 4.0% Asia , 2.9% Africa ).
This city:
19.4%Maryland:
15.7%
Marital status for residents in Frederick Marital status - White (Caucasian) population 15 years and over
Males 35.3% Never married53.5% Now married0.5% Separated2.9% Widowed7.8% DivorcedFemales 28.8% Never married41.6% Now married1.0% Separated12.4% Widowed16.1% DivorcedWomen who gave birth in the past 12 months Now married:
80.0% (423)Unmarried:
20.0% (106)
Women who did not give birth in the past 12 months Now married:
40.3% (4,336)Unmarried:
59.7% (6,433)
Marital status - Black or African American population 15 years and over
Males 34.8% Never married60.7% Now married1.0% Separated1.0% Widowed2.5% DivorcedFemales 43.5% Never married41.6% Now married7.7% Separated1.8% Widowed5.3% DivorcedWomen who gave birth in the past 12 months Now married:
31.6% (149)Unmarried:
68.4% (322)
Women who did not give birth in the past 12 months Now married:
47.7% (1,856)Unmarried:
52.3% (2,038)
Marital status - American Indian / Alaska Native population 15 years and over
Males 64.4% Never married35.6% Now married0.0% Separated0.0% Widowed0.0% DivorcedFemales 31.8% Never married68.2% Now married0.0% Separated0.0% Widowed0.0% DivorcedWomen who did not give birth in the past 12 months Now married:
28.6% (21)Unmarried:
71.4% (52)
Marital status - Asian population 15 years and over
Males 35.8% Never married58.8% Now married2.1% Separated0.9% Widowed2.3% DivorcedFemales 28.7% Never married58.4% Now married0.6% Separated7.7% Widowed4.6% DivorcedWomen who gave birth in the past 12 months Now married:
100.0% (44)Unmarried:
0.0% (0)
Women who did not give birth in the past 12 months Now married:
48.7% (681)Unmarried:
51.3% (717)
Marital status - Native Hawaiian / Pacific Islander population 15 years and over
Males 0.0% Never married100.0% Now married0.0% Separated0.0% Widowed0.0% DivorcedFemales 0.0% Never married100.0% Now married0.0% Separated0.0% Widowed0.0% DivorcedWomen who did not give birth in the past 12 months Now married:
100.0% (7)Unmarried:
0.0% (0)
Marital status - Other race population 15 years and over
Males 33.9% Never married54.7% Now married0.8% Separated1.0% Widowed9.6% DivorcedFemales 42.9% Never married39.0% Now married4.1% Separated3.6% Widowed10.4% DivorcedWomen who gave birth in the past 12 months Now married:
100.0% (39)Unmarried:
0.0% (0)
Women who did not give birth in the past 12 months Now married:
41.4% (718)Unmarried:
58.6% (1,017)
Marital status - Two or more races population 15 years and over
Males 50.3% Never married42.9% Now married0.0% Separated0.7% Widowed6.1% DivorcedFemales 41.2% Never married41.6% Now married1.6% Separated2.8% Widowed12.8% DivorcedWomen who gave birth in the past 12 months Now married:
72.7% (57)Unmarried:
27.3% (21)
Women who did not give birth in the past 12 months Now married:
39.9% (1,232)Unmarried:
60.1% (1,853)
Marital status - White alone, not Hispanic / Latino population 15 years and over
Males 34.5% Never married54.2% Now married0.5% Separated3.0% Widowed7.9% DivorcedFemales 28.8% Never married41.7% Now married0.8% Separated12.6% Widowed16.0% DivorcedWomen who gave birth in the past 12 months Now married:
80.0% (423)Unmarried:
20.0% (106)
Women who did not give birth in the past 12 months Now married:
40.6% (4,289)Unmarried:
59.4% (6,275)
Marital status - Hispanic or Latino population 15 years and over
Males 45.0% Never married50.4% Now married0.0% Separated1.1% Widowed3.4% DivorcedFemales 32.8% Never married51.3% Now married1.9% Separated3.1% Widowed10.8% DivorcedWomen who gave birth in the past 12 months Now married:
100.0% (164)Unmarried:
0.0% (0)
Women who did not give birth in the past 12 months Now married:
46.7% (1,324)Unmarried:
53.3% (1,513)
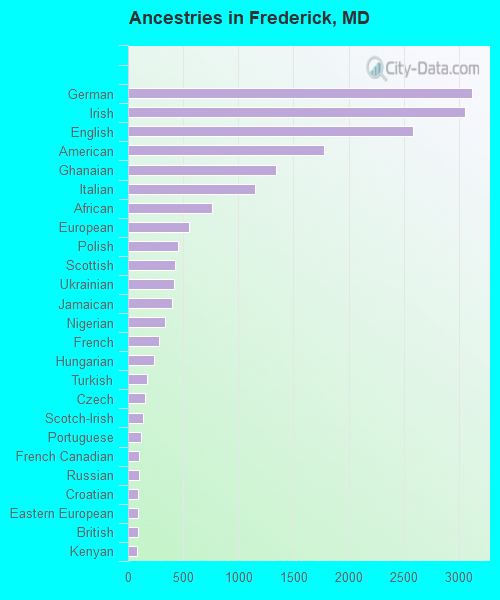
Ancestries in Frederick
3,118 7.8% German3,052 7.6% Irish2,589 6.4% English1,781 4.4% American1,344 3.3% Ghanaian1,154 2.9% Italian760 1.9% African553 1.4% European457 1.1% Polish426 1.1% Scottish421 1.0% Ukrainian402 1.0% Jamaican333 0.8% Nigerian285 0.7% French235 0.6% Hungarian175 0.4% Turkish151 0.4% Czech139 0.3% Scotch-Irish121 0.3% Portuguese97 0.2% French Canadian96 0.2% Russian90 0.2% Croatian88 0.2% Eastern European87 0.2% British85 0.2% Kenyan84 0.2% Arab82 0.2% Romanian69 0.2% Albanian68 0.2% Yugoslavian68 0.2% Norwegian65 0.2% Dutch58 0.1% South African58 0.1% Haitian56 0.1% Swiss50 0.1% Scandinavian50 0.1% Greek50 0.1% Zimbabwean49 0.1% Estonian43 0.1% Danish41 0.1% Canadian40 0.10% Northern European38 0.09% Ugandan38 0.09% Welsh36 0.09% Egyptian33 0.08% Finnish32 0.08% Serbian32 0.08% Swedish31 0.08% Slavic30 0.07% Jordanian30 0.07% Sudanese29 0.07% Lithuanian29 0.07% Bulgarian25 0.06% Liberian22 0.05% Latvian21 0.05% Brazilian19 0.05% Czechoslovakian17 0.04% Syrian15 0.04% Australian13 0.03% Slovene12 0.03% Lebanese11 0.03% Austrian8 0.02% Carpatho Rusyn7 0.02% Pennsylvania German5 0.01% Afghan4 0.01% Celtic
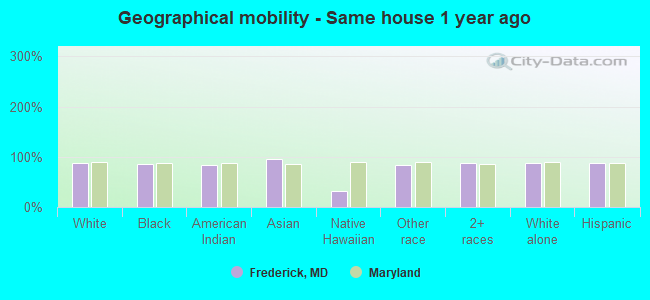
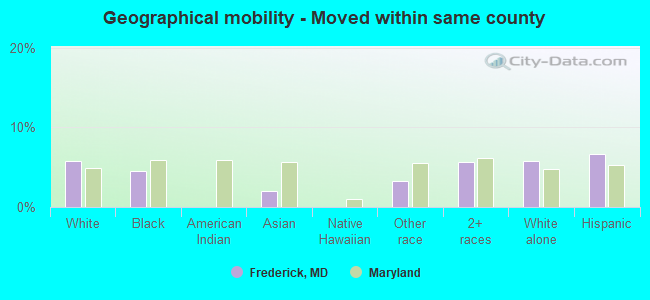
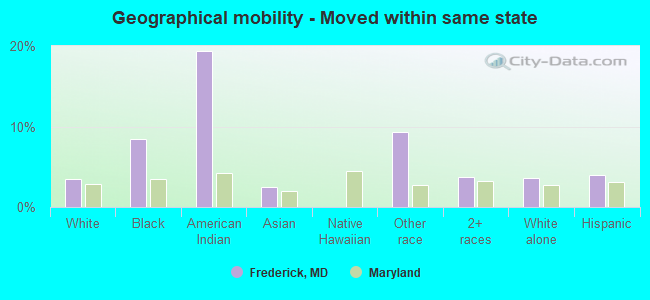
Geographical mobility in Frederick Same house 1 year ago 39,179 87.7% White (Caucasian)13,631 86.6% Black or African American238 82.9% American Indian / Alaska Native4,717 95.4% Asian8 32.2% Native Hawaiian / Pacific Islander3,125 84.6% Other race11,208 87.3% Two or more races38,259 87.7% White alone, not Hispanic / Latino13,811 87.7% Hispanic or LatinoMoved within same county 2,551 5.7% White / Caucasian710 4.5% Black or African American98 2.0% Asian123 3.3% Other race720 5.6% Two or more races2,497 5.7% White alone, not Hispanic / Latino1,047 6.7% Hispanic or LatinoMoved within same state 1,559 3.5% White / Caucasian1,330 8.5% Black or African American55 19.3% American Indian / Alaska Native124 2.5% Asian342 9.3% Other race477 3.7% Two or more races1,559 3.6% White alone, not Hispanic / Latino631 4.0% Hispanic or LatinoMoved from different state 1,014 2.3% White / Caucasian32 0.2% Black or African American4 1.4% American Indian / Alaska Native68 1.4% Asian16 67.7% Native Hawaiian / Pacific Islander130 3.5% Other race55 0.4% Two or more races967 2.2% White alone, not Hispanic / Latino317 2.0% Hispanic or LatinoMoved from abroad 362 0.8% White34 0.2% Black or African American30 0.6% Asian107 0.8% Two or more races362 0.8% White alone, not Hispanic / Latino455 2.9% Hispanic or Latino
Children Nativity (place of birth) in Frederick
Children under 6 years - Living with two parents Both parents native 2,263 100.0% NativeBoth parents foreign-born 1,507 96.0% Native63 4.0% Foreign-bornOne native, one foreign-born parent 506 100.0% NativeChildren under 6 years - Living with one parent Native parent 1,321 100.0% NativeForeign-born parent 397 100.0% NativeChildren 6 to 17 years - Living with two parents Both parents native 4,777 100.0% NativeBoth parents foreign-born 2,068 94.8% Native114 5.2% Foreign-bornOne native, one foreign-born parent 863 87.4% Native124 12.6% Foreign-bornChildren 6 to 17 years - Living with one parent Native parent 2,811 100.0% NativeForeign-born parent 1,057 50.0% Native1,057 50.0% Foreign-born
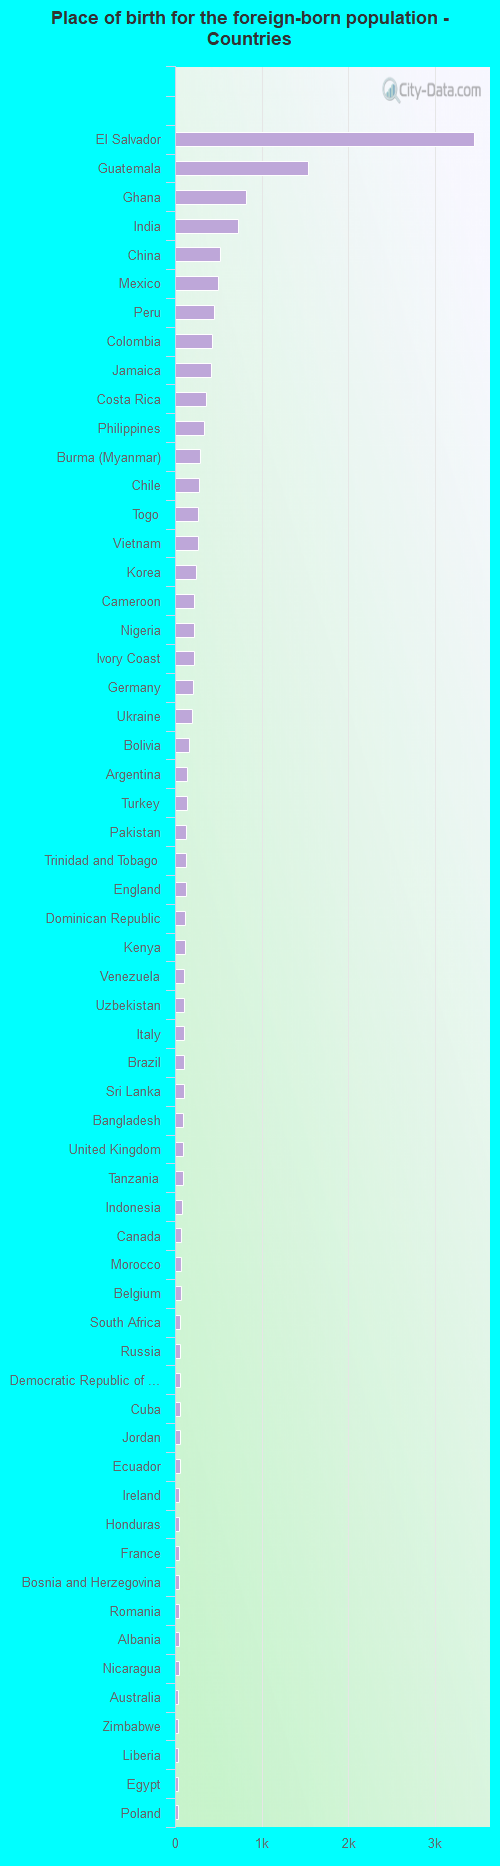
Place of birth for residents in Frederick 8,697 Americas8,622 Latin America5,944 Central America3,306 Asia2,449 Africa1,943 South America1,649 Western Africa1,426 Europe1,202 South Central Asia1,061 South Eastern Asia803 Eastern Asia734 Caribbean637 Eastern Europe543 China329 Western Europe303 Northern Europe278 Middle Africa248 Eastern Africa239 Western Asia142 Southern Europe132 Southern Africa121 Northern Africa75 Northern America40 Oceania40 Australia and New Zealand Subregion3,453 El Salvador1,540 Guatemala819 Ghana726 India523 China492 Mexico454 Peru425 Colombia411 Jamaica356 Costa Rica336 Philippines291 Burma (Myanmar)275 Chile268 Togo260 Vietnam246 Korea223 Cameroon222 Nigeria217 Ivory Coast206 Germany196 Ukraine167 Bolivia141 Argentina139 Turkey131 Pakistan130 Trinidad and Tobago124 England121 Dominican Republic110 Kenya108 Venezuela103 Uzbekistan103 Italy102 Brazil101 Sri Lanka98 Bangladesh95 United Kingdom94 Tanzania81 Indonesia70 Canada68 Morocco66 Belgium61 South Africa58 Russia54 Democratic Republic of Congo (Zaire)53 Cuba52 Jordan52 Ecuador45 Ireland45 Honduras43 France43 Bosnia and Herzegovina43 Romania42 Albania42 Nicaragua40 Australia37 Zimbabwe35 Liberia35 Egypt33 Poland31 Uruguay27 Bulgaria26 Singapore24 Greece23 Thailand22 Czechoslovakia22 Nepal21 Cambodia21 Croatia20 Malaysia20 Taiwan19 Sierra Leone19 Scotland18 Haiti18 Moldova18 Sudan17 Syria14 Spain13 Azerbaijan13 Iran12 Sweden12 Japan12 Netherlands12 Panama8 Guyana6 Hungary6 Afghanistan5 Ethiopia5 Norway
Grandparents responsible for own grandchildren in Frederick
Grandparents (30 to 59 years) White / Caucasian 57 35.5% Responsible for grandchildren103 64.5% Not responsible for grandchildrenBlack or African American 102 82.6% Responsible for grandchildren22 17.4% Not responsible for grandchildrenAsian 9 33.4% Responsible for grandchildren18 66.6% Not responsible for grandchildrenTwo or more races 86 100.0% Not responsible for grandchildrenWhite alone, not Hispanic / Latino 57 46.7% Responsible for grandchildren65 53.3% Not responsible for grandchildrenHispanic or Latino 109 100.0% Not responsible for grandchildrenGrandparents (60 years and over) White / Caucasian 230 48.0% Responsible for grandchildren250 52.0% Not responsible for grandchildrenBlack or African American 26 47.7% Responsible for grandchildren29 52.3% Not responsible for grandchildrenAsian 148 100.0% Not responsible for grandchildrenTwo or more races 2 5.0% Responsible for grandchildren29 95.0% Not responsible for grandchildrenWhite alone, not Hispanic / Latino 230 50.0% Responsible for grandchildren230 50.0% Not responsible for grandchildrenHispanic or Latino 73 100.0% Not responsible for grandchildren