Races in Freedom, Maine (ME) Detailed Stats
Ancestries, Foreign-born residents, place of birth

Recent posts about races in Freedom, Maine on our local forum with over 2,400,000 registered users:
 | Bill submitted to allow Maine gun owners to carry concealed without permit (296 replies) |
| My experience in Maine (99 replies) |
| Camps, "temporary" structures and permits? (84 replies) |
| Major differences between in ME vs MA (62 replies) |
| Which part/cities of Maine should we explore first as potential transplants? (38 replies) |
| Southern Maine Coast (7 replies) |
Latest news about races in Freedom, ME collected exclusively by city-data.com from local newspapers, TV, and radio stations
1.4% of Freedom, ME residents are foreign-born , which is 115.0% less than the foreign-born rate of 3.0% across the entire state of Maine.
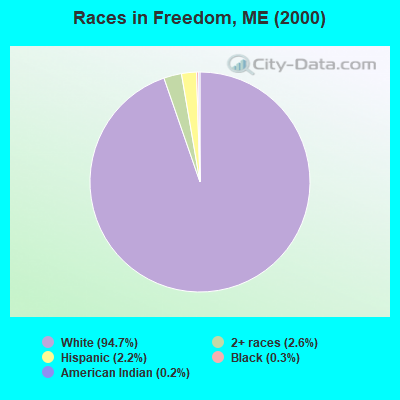
Race distribution in Freedom

- 61194.7%White alone
- 172.6%Two or more races
- 142.2%Hispanic
- 20.3%Black alone
- 10.2%American Indian alone
2000
2022
-
- 1,230,29796.5%White alone
- 11,7310.9%Two or more races
- 9,3600.7%Hispanic
- 9,0140.7%Asian alone
- 6,4400.5%Black alone
- 6,9110.5%American Indian alone
- 8360.07%Other race alone
- 3340.03%Native Hawaiian and Other
Pacific Islander alone

-
- 1,249,23390.2%White alone
- 58,3574.2%Two or more races
- 28,7172.1%Hispanic
- 21,5831.6%Black alone
- 16,1511.2%Asian alone
- 5,8730.4%Other race alone
- 5,2050.4%American Indian alone
- 2210.02%Native Hawaiian and Other
Pacific Islander alone

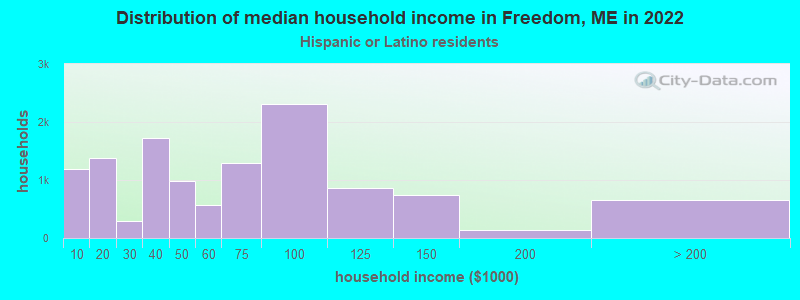
Income and house value in Freedom
- Median household income in 2022
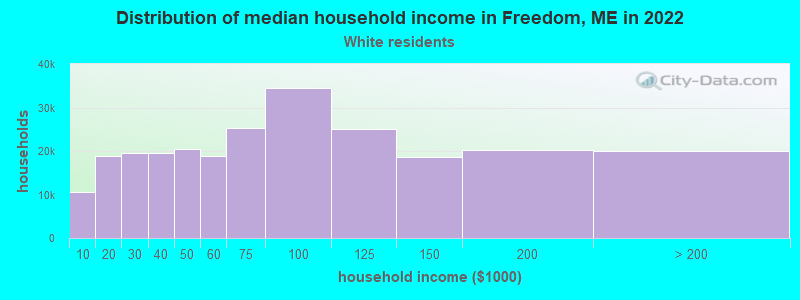
- $62,312White non-Hispanic householders
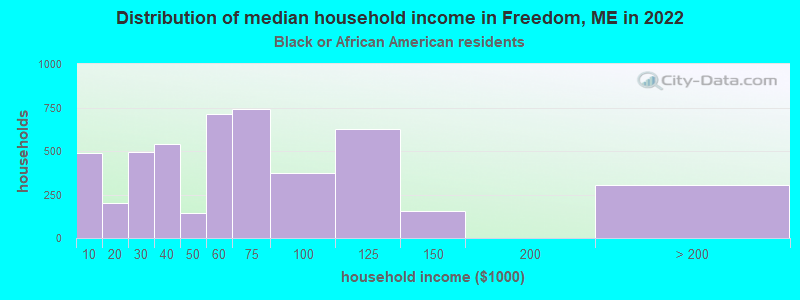
- $29,197Black householders
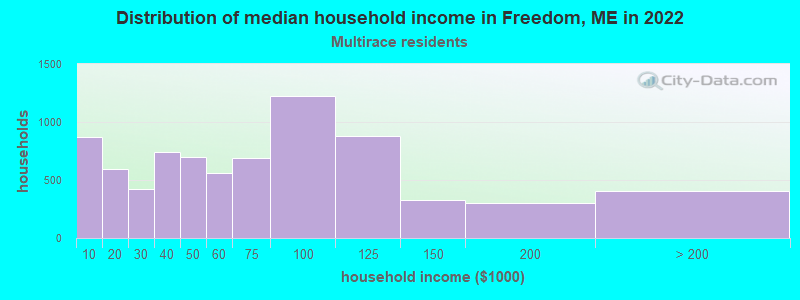
- $34,319Two or more races householders
- $56,457Hispanic or Latino race householders
- Median 2022 house value
- $199,475White Non-Hispanic householders
- $131,426Two or more races householders
Household income for White non-Hispanic householders
Household income for Black householders
Household income for Two or more races householders
Household income for Hispanic or Latino race householders
Foreign-born residents in Freedom
9 residents are foreign born
| This city: | 1.4% |
| Maine: | 2.9% |
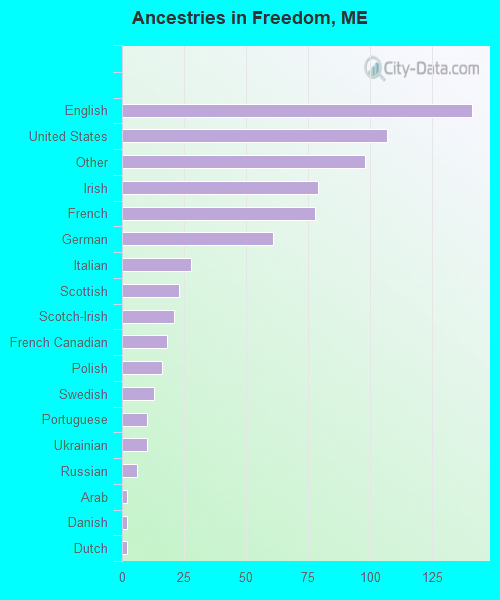
Ancestries in Freedom

- 14119.7%English
- 10715.0%United States
- 9813.7%Other
- 7911.0%Irish
- 7810.9%French
- 618.5%German
- 283.9%Italian
- 233.2%Scottish
- 212.9%Scotch-Irish
- 182.5%French Canadian
- 162.2%Polish
- 131.8%Swedish
- 101.4%Portuguese
- 101.4%Ukrainian
- 60.8%Russian
- 20.3%Arab
- 20.3%Danish
- 20.3%Dutch
Zip codes: 04941.