Races in Freeport, Texas (TX) Detailed Stats
Data:
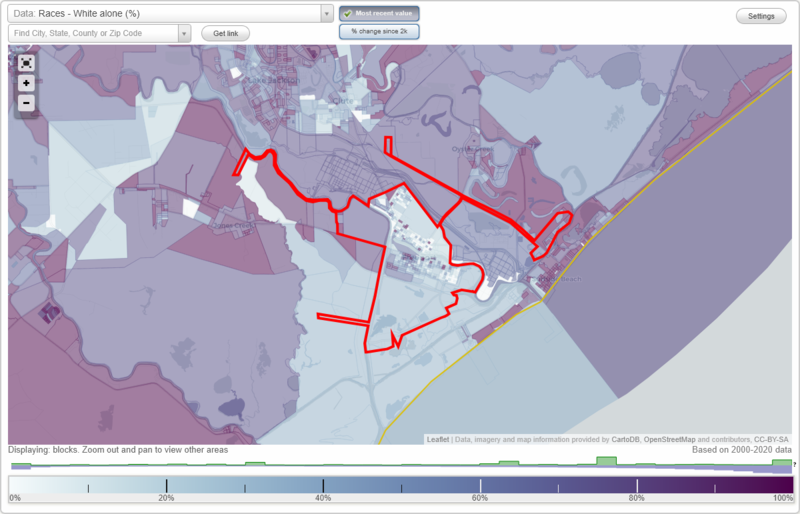
Races - White alone (%)
Races - White alone (% change since 2000)
Races - Black alone (%)
Races - Black alone (% change since 2000)
Races - American Indian alone (%)
Races - American Indian alone (% change since 2000)
Races - Asian alone (%)
Races - Asian alone (% change since 2000)
Races - Hispanic (%)
Races - Hispanic (% change since 2000)
Races - Native Hawaiian and Other Pacific Islander alone (%)
Races - Native Hawaiian and Other Pacific Islander alone (% change since 2000)
Races - Two or more races(%)
Races - Two or more races(% change since 2000)
Races - Other race alone (%)
Races - Other race alone (% change since 2000)
Racial diversity
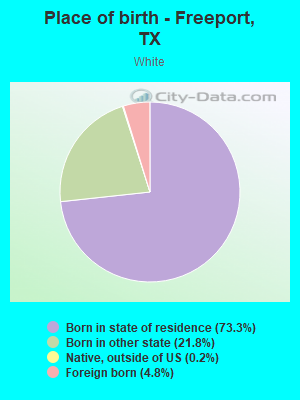
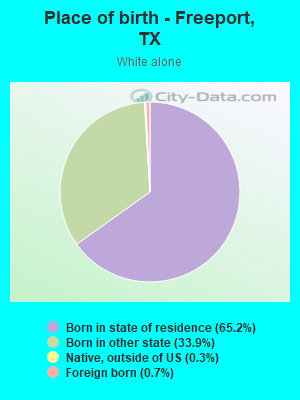
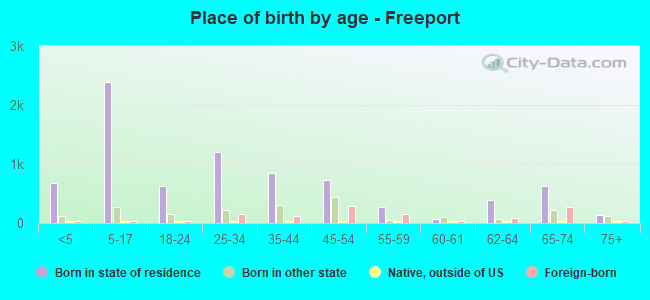
Place of birth - Born in state of residence (%)
Place of birth - Born in state of residence (%) - White
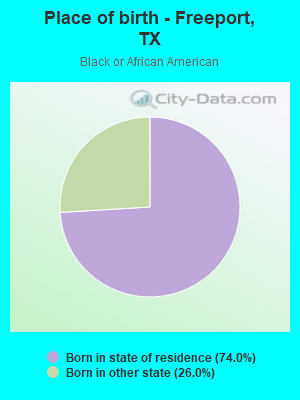
Place of birth - Born in state of residence (%) - Black or African American
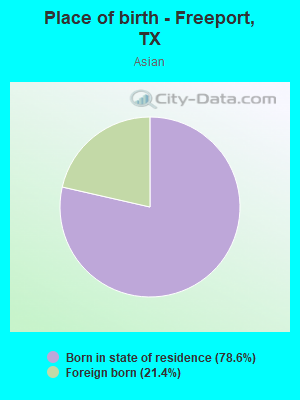
Place of birth - Born in state of residence (%) - Asian
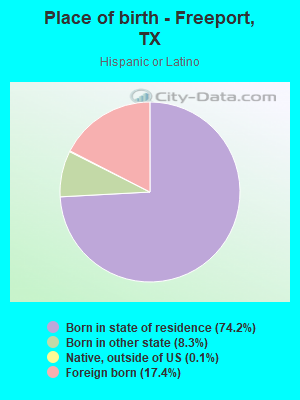
Place of birth - Born in state of residence (%) - Hispanic or Latino
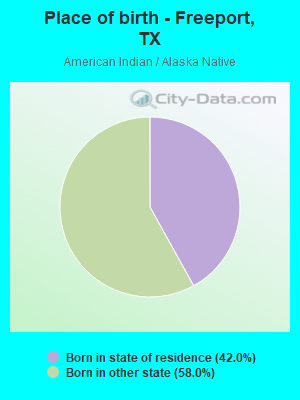
Place of birth - Born in state of residence (%) - American Indian and Alaska Native
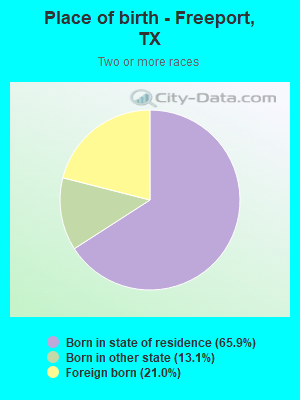
Place of birth - Born in state of residence (%) - Multirace
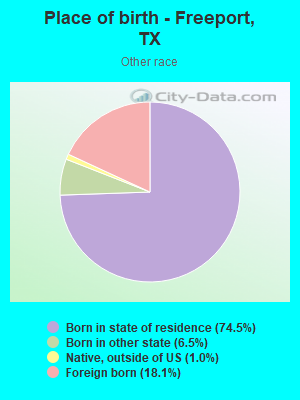
Place of birth - Born in state of residence (%) - Other Race
Place of birth - Born in other state (%)
Place of birth - Born in other state (%) - White
Place of birth - Born in other state (%) - Black or African American
Place of birth - Born in other state (%) - Asian
Place of birth - Born in other state (%) - Hispanic or Latino
Place of birth - Born in other state (%) - American Indian and Alaska Native
Place of birth - Born in other state (%) - Multirace
Place of birth - Born in other state (%) - Other Race
Place of birth - Native, outside of US (%)
Place of birth - Native, outside of US (%) - White
Place of birth - Native, outside of US (%) - Black or African American
Place of birth - Native, outside of US (%) - Asian
Place of birth - Native, outside of US (%) - Hispanic or Latino
Place of birth - Native, outside of US (%) - American Indian and Alaska Native
Place of birth - Native, outside of US (%) - Multirace
Place of birth - Native, outside of US (%) - Other Race
Place of birth - Foreign born (%)
Place of birth - Foreign born (%) - White
Place of birth - Foreign born (%) - Black or African American
Place of birth - Foreign born (%) - Asian
Place of birth - Foreign born (%) - Hispanic or Latino
Place of birth - Foreign born (%) - American Indian and Alaska Native
Place of birth - Foreign born (%) - Multirace
Place of birth - Foreign born (%) - Other Race
Residents speaking English at home (%)
Residents speaking English at home - Born in the United States (%)
Residents speaking English at home - Native, born elsewhere (%)
Residents speaking English at home - Foreign born (%)
Residents speaking Spanish at home (%)
Residents speaking Spanish at home - Born in the United States (%)
Residents speaking Spanish at home - Native, born elsewhere (%)
Residents speaking Spanish at home - Foreign born (%)
Residents speaking other language at home (%)
Residents speaking other language at home - Born in the United States (%)
Residents speaking other language at home - Native, born elsewhere (%)
Residents speaking other language at home - Foreign born (%)
Marital status - Never married (%)
Marital status - Now married (%)
Marital status - Separated (%)
Marital status - Widowed (%)
Marital status - Divorced (%)
Ancestries Reported - Arab (%)
Ancestries Reported - Czech (%)
Ancestries Reported - Danish (%)
Ancestries Reported - Dutch (%)
Ancestries Reported - English (%)
Ancestries Reported - French (%)
Ancestries Reported - French Canadian (%)
Ancestries Reported - German (%)
Ancestries Reported - Greek (%)
Ancestries Reported - Hungarian (%)
Ancestries Reported - Irish (%)
Ancestries Reported - Italian (%)
Ancestries Reported - Lithuanian (%)
Ancestries Reported - Norwegian (%)
Ancestries Reported - Polish (%)
Ancestries Reported - Portuguese (%)
Ancestries Reported - Russian (%)
Ancestries Reported - Scotch-Irish (%)
Ancestries Reported - Scottish (%)
Ancestries Reported - Slovak (%)
Ancestries Reported - Subsaharan African (%)
Ancestries Reported - Swedish (%)
Ancestries Reported - Swiss (%)
Ancestries Reported - Ukrainian (%)
Ancestries Reported - United States (%)
Ancestries Reported - Welsh (%)
Ancestries Reported - West Indian (%)
Ancestries Reported - Other (%)
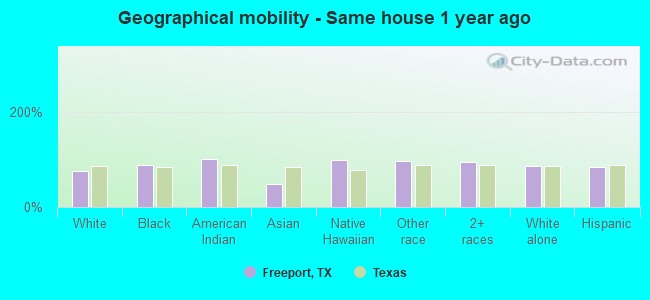
Geographical mobility - Same house 1 year ago (%)
Geographical mobility - Same house 1 year ago (%) - White
Geographical mobility - Same house 1 year ago (%) - Black or African American
Geographical mobility - Same house 1 year ago (%) - Asian
Geographical mobility - Same house 1 year ago (%) - Hispanic or Latino
Geographical mobility - Same house 1 year ago (%) - American Indian and Alaska Native
Geographical mobility - Same house 1 year ago (%) - Multirace
Geographical mobility - Same house 1 year ago (%) - Other Race
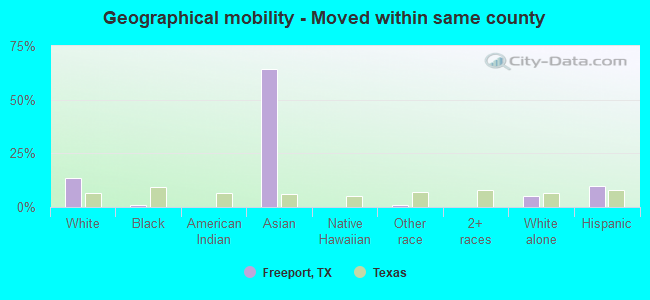
Geographical mobility - Moved within same county (%)
Geographical mobility - Moved within same county (%) - White
Geographical mobility - Moved within same county (%) - Black or African American
Geographical mobility - Moved within same county (%) - Asian
Geographical mobility - Moved within same county (%) - Hispanic or Latino
Geographical mobility - Moved within same county (%) - American Indian and Alaska Native
Geographical mobility - Moved within same county (%) - Multirace
Geographical mobility - Moved within same county (%) - Other Race
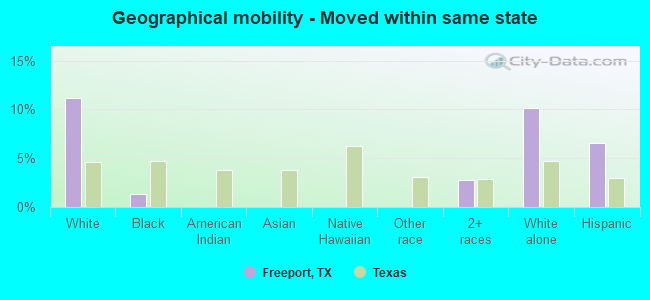
Geographical mobility - Moved from different county within same state (%)
Geographical mobility - Moved from different county within same state (%) - White
Geographical mobility - Moved from different county within same state (%) - Black or African American
Geographical mobility - Moved from different county within same state (%) - Asian
Geographical mobility - Moved from different county within same state (%) - Hispanic or Latino
Geographical mobility - Moved from different county within same state (%) - American Indian and Alaska Native
Geographical mobility - Moved from different county within same state (%) - Multirace
Geographical mobility - Moved from different county within same state (%) - Other Race
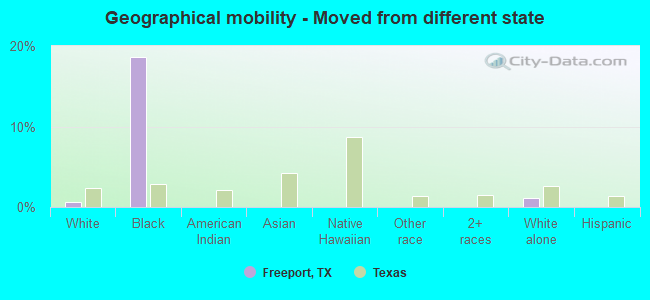
Geographical mobility - Moved from different state (%)
Geographical mobility - Moved from different state (%) - White
Geographical mobility - Moved from different state (%) - Black or African American
Geographical mobility - Moved from different state (%) - Asian
Geographical mobility - Moved from different state (%) - Hispanic or Latino
Geographical mobility - Moved from different state (%) - American Indian and Alaska Native
Geographical mobility - Moved from different state (%) - Multirace
Geographical mobility - Moved from different state (%) - Other Race
Geographical mobility - Moved from abroad (%)
Geographical mobility - Moved from abroad (%) - White
Geographical mobility - Moved from abroad (%) - Black or African American
Geographical mobility - Moved from abroad (%) - Asian
Geographical mobility - Moved from abroad (%) - Hispanic or Latino
Geographical mobility - Moved from abroad (%) - American Indian and Alaska Native
Geographical mobility - Moved from abroad (%) - Multirace
Geographical mobility - Moved from abroad (%) - Other Race
Place of birth for the foreign-born population - Ireland (%)
Place of birth for the foreign-born population - Denmark (%)
Place of birth for the foreign-born population - Norway (%)
Place of birth for the foreign-born population - Sweden (%)
Place of birth for the foreign-born population - United Kingdom (%)
Place of birth for the foreign-born population - England (%)
Place of birth for the foreign-born population - Scotland (%)
Place of birth for the foreign-born population - Other Northern Europe (%)
Place of birth for the foreign-born population - Austria (%)
Place of birth for the foreign-born population - Belgium (%)
Place of birth for the foreign-born population - France (%)
Place of birth for the foreign-born population - Germany (%)
Place of birth for the foreign-born population - Netherlands (%)
Place of birth for the foreign-born population - Switzerland (%)
Place of birth for the foreign-born population - Other Western Europe (%)
Place of birth for the foreign-born population - Greece (%)
Place of birth for the foreign-born population - Italy (%)
Place of birth for the foreign-born population - Portugal (%)
Place of birth for the foreign-born population - Spain (%)
Place of birth for the foreign-born population - Other Southern Europe (%)
Place of birth for the foreign-born population - Albania (%)
Place of birth for the foreign-born population - Belarus (%)
Place of birth for the foreign-born population - Bosnia and Herzegovina (%)
Place of birth for the foreign-born population - Bulgaria (%)
Place of birth for the foreign-born population - Croatia (%)
Place of birth for the foreign-born population - Czechoslovakia (%)
Place of birth for the foreign-born population - Hungary (%)
Place of birth for the foreign-born population - Latvia (%)
Place of birth for the foreign-born population - Lithuania (%)
Place of birth for the foreign-born population - North Macedonia (Macedonia) (%)
Place of birth for the foreign-born population - Moldova (%)
Place of birth for the foreign-born population - Poland (%)
Place of birth for the foreign-born population - Romania (%)
Place of birth for the foreign-born population - Russia (%)
Place of birth for the foreign-born population - Serbia (%)
Place of birth for the foreign-born population - Ukraine (%)
Place of birth for the foreign-born population - Other Eastern Europe (%)
Place of birth for the foreign-born population - China (%)
Place of birth for the foreign-born population - Hong Kong (%)
Place of birth for the foreign-born population - Taiwan (%)
Place of birth for the foreign-born population - Japan (%)
Place of birth for the foreign-born population - Korea (%)
Place of birth for the foreign-born population - Other Eastern Asia (%)
Place of birth for the foreign-born population - Afghanistan (%)
Place of birth for the foreign-born population - Bangladesh (%)
Place of birth for the foreign-born population - India (%)
Place of birth for the foreign-born population - Iran (%)
Place of birth for the foreign-born population - Kazakhstan (%)
Place of birth for the foreign-born population - Nepal (%)
Place of birth for the foreign-born population - Pakistan (%)
Place of birth for the foreign-born population - Sri Lanka (%)
Place of birth for the foreign-born population - Uzbekistan (%)
Place of birth for the foreign-born population - Other South Central Asia (%)
Place of birth for the foreign-born population - Burma (%)
Place of birth for the foreign-born population - Cambodia (%)
Place of birth for the foreign-born population - Indonesia (%)
Place of birth for the foreign-born population - Laos (%)
Place of birth for the foreign-born population - Malaysia (%)
Place of birth for the foreign-born population - Philippines (%)
Place of birth for the foreign-born population - Singapore (%)
Place of birth for the foreign-born population - Thailand (%)
Place of birth for the foreign-born population - Vietnam (%)
Place of birth for the foreign-born population - Other South Eastern Asia (%)
Place of birth for the foreign-born population - Armenia (%)
Place of birth for the foreign-born population - Iraq (%)
Place of birth for the foreign-born population - Israel (%)
Place of birth for the foreign-born population - Jordan (%)
Place of birth for the foreign-born population - Kuwait (%)
Place of birth for the foreign-born population - Lebanon (%)
Place of birth for the foreign-born population - Saudi Arabia (%)
Place of birth for the foreign-born population - Syria (%)
Place of birth for the foreign-born population - Turkey (%)
Place of birth for the foreign-born population - Yemen (%)
Place of birth for the foreign-born population - Other Western Asia (%)
Place of birth for the foreign-born population - Eritrea (%)
Place of birth for the foreign-born population - Ethiopia (%)
Place of birth for the foreign-born population - Kenya (%)
Place of birth for the foreign-born population - Somalia (%)
Place of birth for the foreign-born population - Uganda (%)
Place of birth for the foreign-born population - Zimbabwe (%)
Place of birth for the foreign-born population - Other Eastern Africa (%)
Place of birth for the foreign-born population - Cameroon (%)
Place of birth for the foreign-born population - Congo (%)
Place of birth for the foreign-born population - Democratic Republic of Congo (Zaire) (%)
Place of birth for the foreign-born population - Other Middle Africa (%)
Place of birth for the foreign-born population - Egypt (%)
Place of birth for the foreign-born population - Morocco (%)
Place of birth for the foreign-born population - Sudan (%)
Place of birth for the foreign-born population - Other Northern Africa (%)
Place of birth for the foreign-born population - South Africa (%)
Place of birth for the foreign-born population - Other Southern Africa (%)
Place of birth for the foreign-born population - Cabo Verde (%)
Place of birth for the foreign-born population - Ghana (%)
Place of birth for the foreign-born population - Liberia (%)
Place of birth for the foreign-born population - Nigeria (%)
Place of birth for the foreign-born population - Senegal (%)
Place of birth for the foreign-born population - Sierra Leone (%)
Place of birth for the foreign-born population - Other Western Africa (%)
Place of birth for the foreign-born population - Australia (%)
Place of birth for the foreign-born population - New Zealand (%)
Place of birth for the foreign-born population - Fiji (%)
Place of birth for the foreign-born population - Micronesia (%)
Place of birth for the foreign-born population - Bahamas (%)
Place of birth for the foreign-born population - Barbados (%)
Place of birth for the foreign-born population - Cuba (%)
Place of birth for the foreign-born population - Dominica (%)
Place of birth for the foreign-born population - Dominican Republic (%)
Place of birth for the foreign-born population - Grenada (%)
Place of birth for the foreign-born population - Haiti (%)
Place of birth for the foreign-born population - Jamaica (%)
Place of birth for the foreign-born population - St. Vincent and the Grenadines (%)
Place of birth for the foreign-born population - Trinidad and Tobago (%)
Place of birth for the foreign-born population - West Indies (%)
Place of birth for the foreign-born population - Other Caribbean (%)
Place of birth for the foreign-born population - Belize (%)
Place of birth for the foreign-born population - Costa Rica (%)
Place of birth for the foreign-born population - El Salvador (%)
Place of birth for the foreign-born population - Guatemala (%)
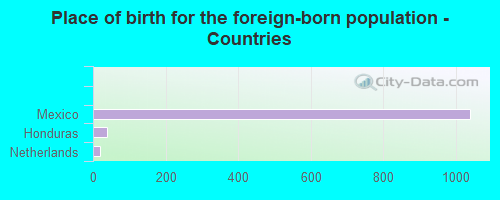
Place of birth for the foreign-born population - Honduras (%)
Place of birth for the foreign-born population - Mexico (%)
Place of birth for the foreign-born population - Nicaragua (%)
Place of birth for the foreign-born population - Panama (%)
Place of birth for the foreign-born population - Other Central America (%)
Place of birth for the foreign-born population - Argentina (%)
Place of birth for the foreign-born population - Bolivia (%)
Place of birth for the foreign-born population - Brazil (%)
Place of birth for the foreign-born population - Chile (%)
Place of birth for the foreign-born population - Colombia (%)
Place of birth for the foreign-born population - Ecuador (%)
Place of birth for the foreign-born population - Guyana (%)
Place of birth for the foreign-born population - Peru (%)
Place of birth for the foreign-born population - Uruguay (%)
Place of birth for the foreign-born population - Venezuela (%)
Place of birth for the foreign-born population - Other South America (%)
Place of birth for the foreign-born population - Canada (%)
Place of birth for the foreign-born population - Other Northern America (%)
Place of birth for the foreign-born population - Other (%)
Latest news about races in Freeport, TX collected exclusively by city-data.com from local newspapers, TV, and radio stations
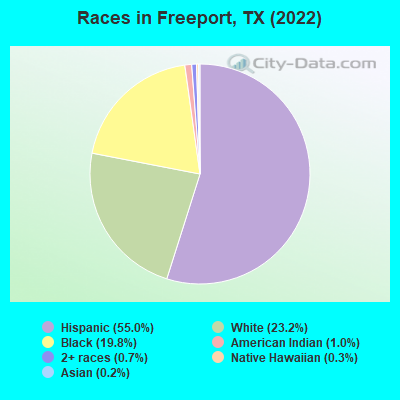
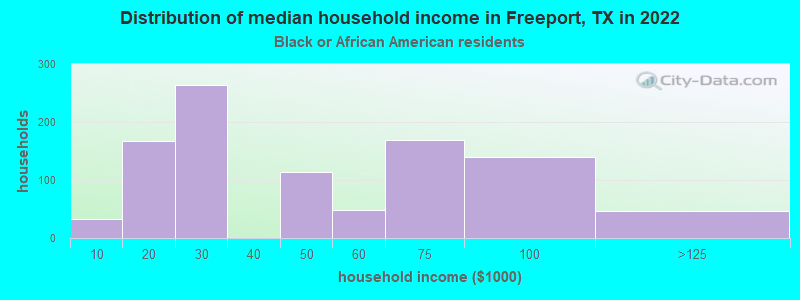
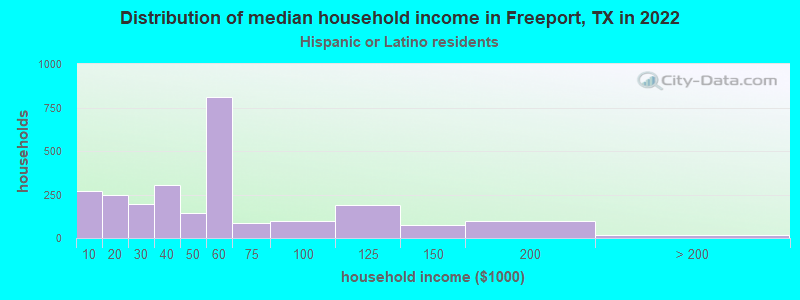
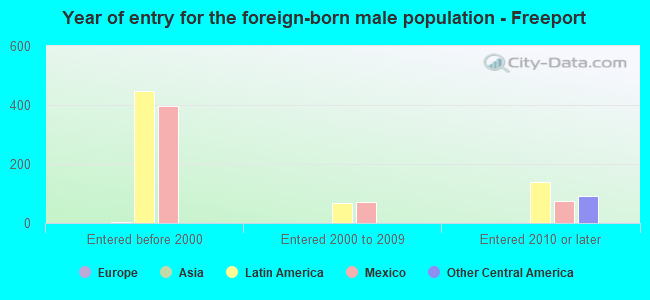
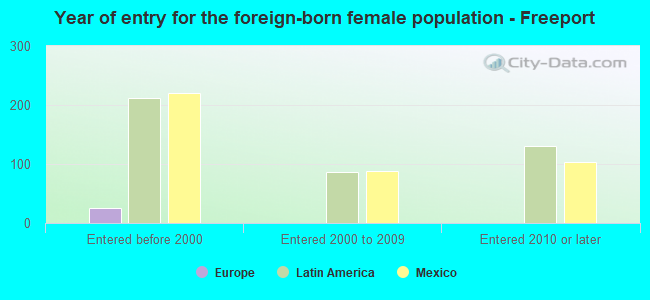
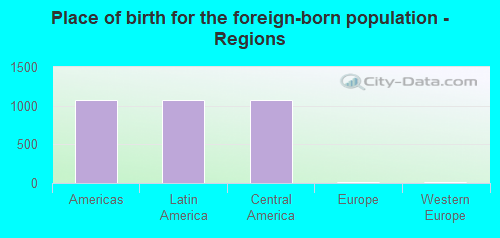
According to 2022 data, the most numerous races in Freeport, TX are Hispanic (6,121 residents), White alone (2,579 residents), and Black alone (2,203 residents). 67.7% of Freeport residents speak English at home. 9.9% of Freeport, TX residents are foreign-born (9.7% born in Latin America), which is 71.7% less than the foreign-born rate of 17.0% across the entire state of Texas.
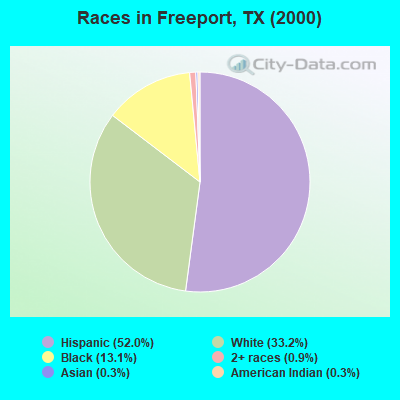
Race distribution in Freeport
2000 2022
10,933,313 52.4% White alone 6,669,666 32.0% Hispanic 2,364,255 11.3% Black alone 554,445 2.7% Asian alone 230,567 1.1% Two or more races 68,859 0.3% American Indian alone 19,958 0.10% Other race alone 10,757 0.05% Native Hawaiian and Other
12,070,642 40.2% Hispanic 11,683,430 38.9% White alone 3,508,706 11.7% Black alone 1,608,173 5.4% Asian alone 956,560 3.2% Two or more races 125,763 0.4% Other race alone 47,023 0.2% American Indian alone 29,275 0.10% Native Hawaiian and Other
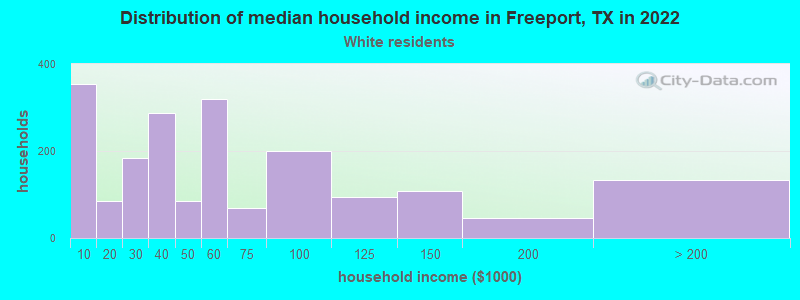
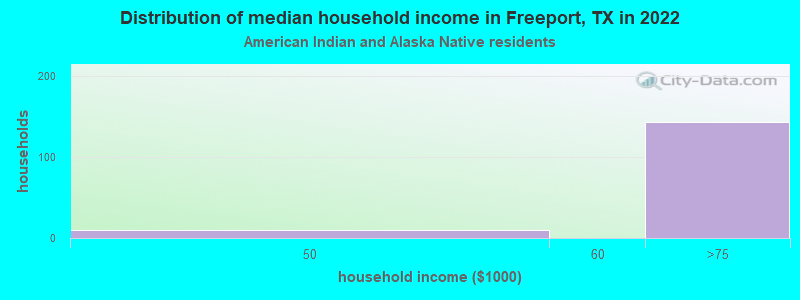
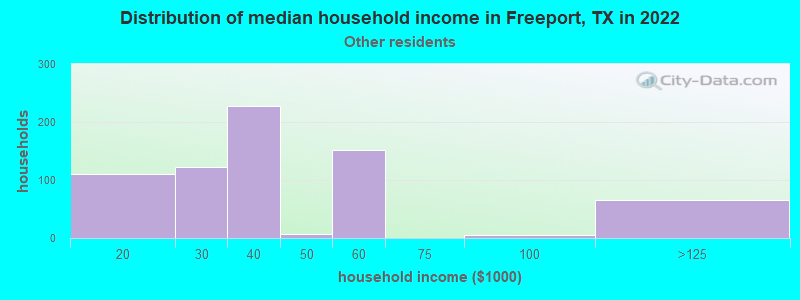
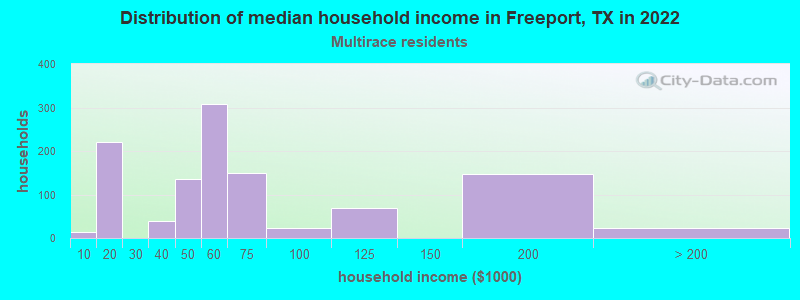
Income and house value in Freeport Median household income in 2022 $43,347 White non-Hispanic householders$35,939 Black householders$32,699 Some other race householders$47,988 Two or more races householders$44,702 Hispanic or Latino race householdersMedian 2022 house value $139,393 White Non-Hispanic householders$144,027 Black or African American householders$362,208 American Indian or Alaska Native householders $115,864 Asian householders$108,020 Some other race householders$147,236 Two or more races householders$113,368 Hispanic or Latino householders
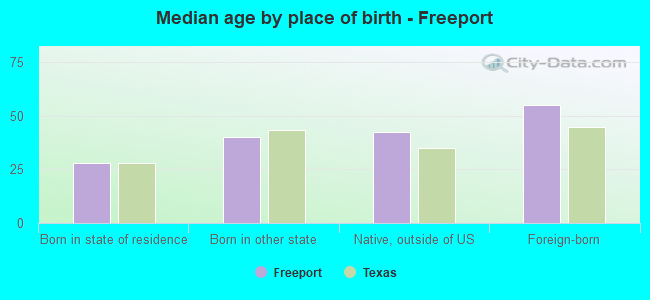
Median age by race in Freeport
35.3 Median age for White residents35.1 36.0 32.0 Median age for Black or African American residents29.0 32.7 75.1 Median age for American Indian / Alaska Native residents57.4 -726,368,158.5 30.4 Median age for Asian residents-637,457,044.0 -701,119,723.7 -1,307,359,306.1 Median age for Native Hawaiian / Pacific Islander residents-688,430,698.1 -577,777,777.2 31.6 Median age for Other race residents27.1 32.2 34.0 Median age for Two or more races residents31.6 34.5 46.8 Median age for White alone residents40.5 47.5 30.5 Median age for Hispanic or Latino residents30.5 30.8
Owner/renter occupied households by race in Freeport
House owners and renters - White residents 1,259 70.5% Owner occupied526 29.5% Renter occupiedHouse owners and renters - Black or African American residents 204 24.8% Owner occupied621 75.2% Renter occupiedHouse owners and renters - American Indian / Alaska Native residents 59 100.0% Owner occupiedHouse owners and renters - Asian residents 5 100.0% Owner occupiedHouse owners and renters - Other race residents 278 53.2% Owner occupied244 46.8% Renter occupiedHouse owners and renters - Two or more races residents 843 67.6% Owner occupied404 32.4% Renter occupiedHouse owners and renters - White alone residents 656 65.0% Owner occupied352 35.0% Renter occupiedHouse owners and renters - Hispanic or Latino residents 1,520 65.8% Owner occupied790 34.2% Renter occupied
Language usage in Freeport
English speakers - Total 67.7% of residents of Freeport speak English at home.
32.3% of residents speak Spanish at home 2,192 65.8% Speak English very well1,139 34.2% Speak English less than very well
English speakers - Born in the United States 82.4% of residents of Freeport speak English at home.
18.4% of residents speak Spanish at home 235 65.3% Speak English very well125 34.7% Speak English less than very well
English speakers - Native, born elsewhere 88.2% of residents of Freeport speak English at home.
23.5% of residents speak Spanish at home 4 100.0% Speak English very well
English speakers - Foreign-born 5.9% of residents of Freeport speak English at home.
98.3% of residents speak Spanish at home 233 22.4% Speak English very well808 77.6% Speak English less than very well0.5% of residents speak other language at home 5 100.0% Speak English very well
White (Caucasian) - Speak only English Native:
81.3% (3,111)Foreign-born:
24.0% (48)
White (Caucasian) - Speak another language Native:
13.8% (529)Foreign-born:
75.3% (150)
Other race - Speak another language Native:
44.1% (477)Foreign-born:
98.9% (232)
Two or more races - Speak another language Native:
61.8% (1,469)Foreign-born:
100.0% (811)
White alone - Speak only English Native:
100.0% (2,350)Foreign-born:
80.8% (15)
White alone - Speak another language Native:
0.4% (10)Foreign-born:
5.8% (1)
Hispanic or Latino - Speak only English Native:
49.0% (2,228)Foreign-born:
4.5% (49)
Hispanic or Latino - Speak another language Native:
50.9% (2,318)Foreign-born:
95.6% (1,023)
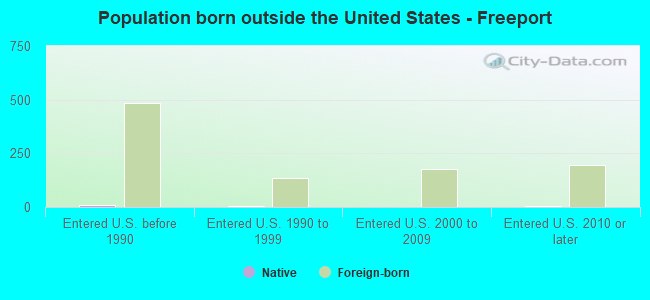
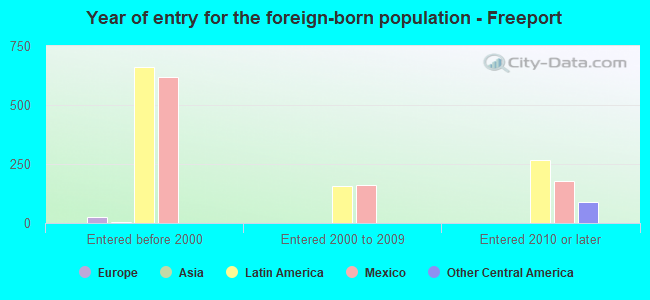
Foreign-born residents in Freeport 1,102 residents are foreign born (9.7% Latin America ).
This city:
9.9%Texas:
17.1%
Marital status for residents in Freeport Marital status - White (Caucasian) population 15 years and over
Males 34.5% Never married46.3% Now married0.0% Separated1.5% Widowed17.6% DivorcedFemales 33.4% Never married43.0% Now married7.7% Separated6.2% Widowed9.7% DivorcedWomen who gave birth in the past 12 months Now married:
39.3% (67)Unmarried:
60.7% (103)
Women who did not give birth in the past 12 months Now married:
42.5% (459)Unmarried:
57.5% (621)
Marital status - Black or African American population 15 years and over
Males 49.7% Never married35.2% Now married3.9% Separated9.1% Widowed2.0% DivorcedFemales 47.6% Never married15.1% Now married0.0% Separated29.2% Widowed8.2% DivorcedWomen who did not give birth in the past 12 months Now married:
21.0% (102)Unmarried:
79.0% (384)
Marital status - American Indian / Alaska Native population 15 years and over
Males 0.0% Never married87.6% Now married0.0% Separated0.0% Widowed12.4% DivorcedFemales 77.3% Never married0.0% Now married0.0% Separated0.0% Widowed22.7% DivorcedWomen who did not give birth in the past 12 months Now married:
0.0% (0)Unmarried:
100.0% (24)
Marital status - Asian population 15 years and over
Males 70.6% Never married0.0% Now married0.0% Separated0.0% Widowed29.4% DivorcedFemales 100.0% Never married0.0% Now married0.0% Separated0.0% Widowed0.0% DivorcedWomen who did not give birth in the past 12 months Now married:
0.0% (0)Unmarried:
100.0% (6)
Marital status - Other race population 15 years and over
Males 39.7% Never married52.2% Now married0.0% Separated2.9% Widowed5.2% DivorcedFemales 32.2% Never married40.2% Now married5.7% Separated6.1% Widowed15.7% DivorcedWomen who gave birth in the past 12 months Now married:
100.0% (88)Unmarried:
0.0% (0)
Women who did not give birth in the past 12 months Now married:
23.7% (93)Unmarried:
76.3% (301)
Marital status - Two or more races population 15 years and over
Males 21.3% Never married68.2% Now married0.0% Separated1.5% Widowed9.0% DivorcedFemales 11.8% Never married69.6% Now married6.5% Separated7.4% Widowed4.7% DivorcedWomen who did not give birth in the past 12 months Now married:
71.3% (320)Unmarried:
28.7% (129)
Marital status - White alone, not Hispanic / Latino population 15 years and over
Males 30.6% Never married50.3% Now married0.0% Separated3.3% Widowed15.7% DivorcedFemales 28.8% Never married43.3% Now married11.8% Separated10.8% Widowed5.3% DivorcedWomen who gave birth in the past 12 months Now married:
100.0% (80)Unmarried:
0.0% (0)
Women who did not give birth in the past 12 months Now married:
38.3% (253)Unmarried:
61.7% (408)
Marital status - Hispanic or Latino population 15 years and over
Males 32.5% Never married53.1% Now married0.0% Separated1.0% Widowed13.5% DivorcedFemales 29.8% Never married50.0% Now married4.3% Separated3.6% Widowed12.3% DivorcedWomen who gave birth in the past 12 months Now married:
33.9% (67)Unmarried:
66.1% (131)
Women who did not give birth in the past 12 months Now married:
47.2% (582)Unmarried:
52.8% (650)
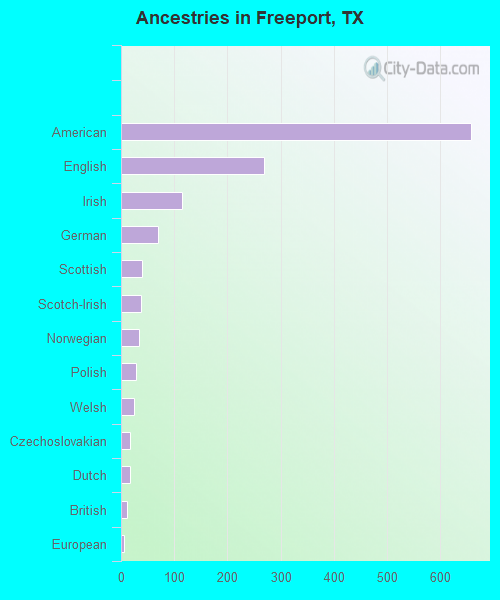
Ancestries in Freeport
659 8.6% American268 3.5% English114 1.5% Irish69 0.9% German40 0.5% Scottish38 0.5% Scotch-Irish33 0.4% Norwegian29 0.4% Polish24 0.3% Welsh17 0.2% Czechoslovakian16 0.2% Dutch11 0.1% British6 0.08% European
Geographical mobility in Freeport Same house 1 year ago 3,278 76.2% White (Caucasian)1,959 86.6% Black or African American224 100.0% American Indian / Alaska Native11 48.1% Asian30 98.2% Native Hawaiian / Pacific Islander1,205 96.2% Other race3,512 94.9% Two or more races2,138 84.6% White alone, not Hispanic / Latino4,985 82.6% Hispanic or LatinoMoved within same county 578 13.4% White / Caucasian18 0.8% Black or African American15 64.1% Asian12 0.9% Other race132 5.2% White alone, not Hispanic / Latino596 9.9% Hispanic or LatinoMoved within same state 482 11.2% White / Caucasian30 1.3% Black or African American104 2.8% Two or more races257 10.2% White alone, not Hispanic / Latino396 6.6% Hispanic or LatinoMoved from different state 27 0.6% White / Caucasian423 18.7% Black or African American27 1.1% White alone, not Hispanic / Latino
Children Nativity (place of birth) in Freeport
Children under 6 years - Living with two parents Both parents native 650 100.0% NativeOne native, one foreign-born parent 72 100.0% NativeChildren under 6 years - Living with one parent Native parent 289 100.0% NativeForeign-born parent 12 100.0% NativeChildren 6 to 17 years - Living with two parents Both parents native 502 100.0% NativeBoth parents foreign-born 59 100.0% NativeOne native, one foreign-born parent 9 100.0% NativeChildren 6 to 17 years - Living with one parent Native parent 1,521 100.0% NativeForeign-born parent 401 48.9% Native419 51.1% Foreign-born
Grandparents responsible for own grandchildren in Freeport
Grandparents (30 to 59 years) White / Caucasian 9 29.8% Responsible for grandchildren21 70.2% Not responsible for grandchildrenBlack or African American 29 100.0% Responsible for grandchildrenTwo or more races 29 50.4% Responsible for grandchildren29 49.6% Not responsible for grandchildrenWhite alone, not Hispanic / Latino 33 100.0% Not responsible for grandchildrenHispanic or Latino 44 72.3% Responsible for grandchildren17 27.7% Not responsible for grandchildrenGrandparents (60 years and over) White / Caucasian 101 77.9% Responsible for grandchildren29 22.1% Not responsible for grandchildrenBlack or African American 23 100.0% Not responsible for grandchildrenWhite alone, not Hispanic / Latino 131 75.8% Responsible for grandchildren42 24.2% Not responsible for grandchildrenHispanic or Latino 32 100.0% Not responsible for grandchildren