Races in Fresno, Texas (TX) Detailed Stats
Data:
Races - White alone (%)
Races - White alone (% change since 2000)
Races - Black alone (%)
Races - Black alone (% change since 2000)
Races - American Indian alone (%)
Races - American Indian alone (% change since 2000)
Races - Asian alone (%)
Races - Asian alone (% change since 2000)
Races - Hispanic (%)
Races - Hispanic (% change since 2000)
Races - Native Hawaiian and Other Pacific Islander alone (%)
Races - Native Hawaiian and Other Pacific Islander alone (% change since 2000)
Races - Two or more races(%)
Races - Two or more races(% change since 2000)
Races - Other race alone (%)
Races - Other race alone (% change since 2000)
Racial diversity
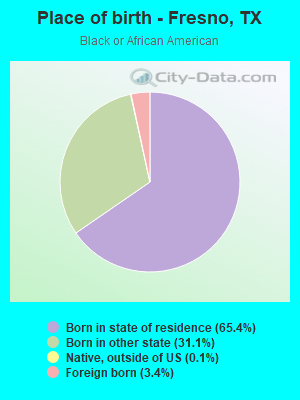
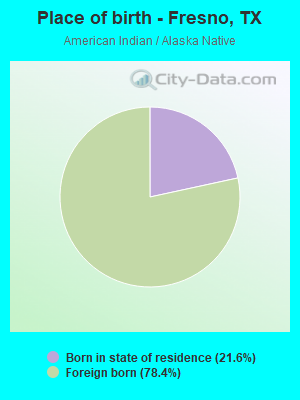
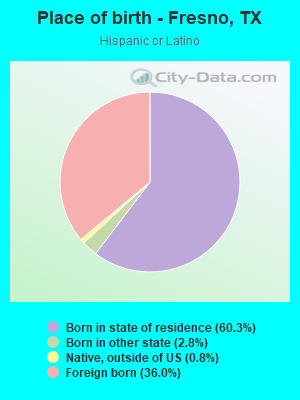
Place of birth - Born in state of residence (%)
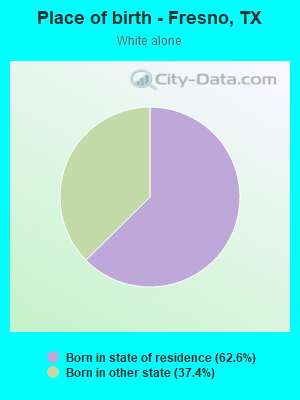
Place of birth - Born in state of residence (%) - White
Place of birth - Born in state of residence (%) - Black or African American
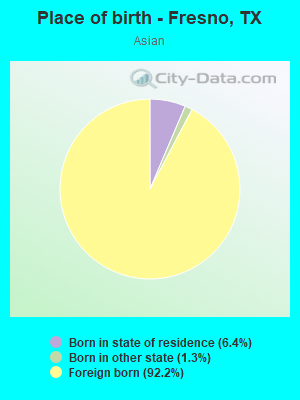
Place of birth - Born in state of residence (%) - Asian
Place of birth - Born in state of residence (%) - Hispanic or Latino
Place of birth - Born in state of residence (%) - American Indian and Alaska Native
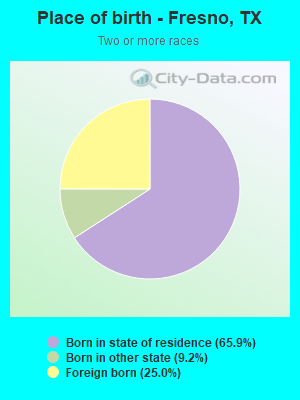
Place of birth - Born in state of residence (%) - Multirace
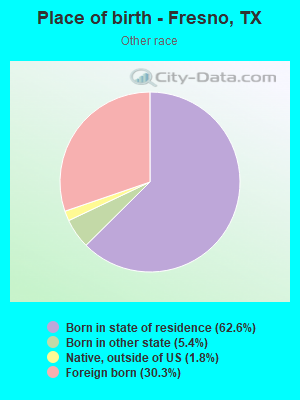
Place of birth - Born in state of residence (%) - Other Race
Place of birth - Born in other state (%)
Place of birth - Born in other state (%) - White
Place of birth - Born in other state (%) - Black or African American
Place of birth - Born in other state (%) - Asian
Place of birth - Born in other state (%) - Hispanic or Latino
Place of birth - Born in other state (%) - American Indian and Alaska Native
Place of birth - Born in other state (%) - Multirace
Place of birth - Born in other state (%) - Other Race
Place of birth - Native, outside of US (%)
Place of birth - Native, outside of US (%) - White
Place of birth - Native, outside of US (%) - Black or African American
Place of birth - Native, outside of US (%) - Asian
Place of birth - Native, outside of US (%) - Hispanic or Latino
Place of birth - Native, outside of US (%) - American Indian and Alaska Native
Place of birth - Native, outside of US (%) - Multirace
Place of birth - Native, outside of US (%) - Other Race
Place of birth - Foreign born (%)
Place of birth - Foreign born (%) - White
Place of birth - Foreign born (%) - Black or African American
Place of birth - Foreign born (%) - Asian
Place of birth - Foreign born (%) - Hispanic or Latino
Place of birth - Foreign born (%) - American Indian and Alaska Native
Place of birth - Foreign born (%) - Multirace
Place of birth - Foreign born (%) - Other Race
Residents speaking English at home (%)
Residents speaking English at home - Born in the United States (%)
Residents speaking English at home - Native, born elsewhere (%)
Residents speaking English at home - Foreign born (%)
Residents speaking Spanish at home (%)
Residents speaking Spanish at home - Born in the United States (%)
Residents speaking Spanish at home - Native, born elsewhere (%)
Residents speaking Spanish at home - Foreign born (%)
Residents speaking other language at home (%)
Residents speaking other language at home - Born in the United States (%)
Residents speaking other language at home - Native, born elsewhere (%)
Residents speaking other language at home - Foreign born (%)
Marital status - Never married (%)
Marital status - Now married (%)
Marital status - Separated (%)
Marital status - Widowed (%)
Marital status - Divorced (%)
Ancestries Reported - Arab (%)
Ancestries Reported - Czech (%)
Ancestries Reported - Danish (%)
Ancestries Reported - Dutch (%)
Ancestries Reported - English (%)
Ancestries Reported - French (%)
Ancestries Reported - French Canadian (%)
Ancestries Reported - German (%)
Ancestries Reported - Greek (%)
Ancestries Reported - Hungarian (%)
Ancestries Reported - Irish (%)
Ancestries Reported - Italian (%)
Ancestries Reported - Lithuanian (%)
Ancestries Reported - Norwegian (%)
Ancestries Reported - Polish (%)
Ancestries Reported - Portuguese (%)
Ancestries Reported - Russian (%)
Ancestries Reported - Scotch-Irish (%)
Ancestries Reported - Scottish (%)
Ancestries Reported - Slovak (%)
Ancestries Reported - Subsaharan African (%)
Ancestries Reported - Swedish (%)
Ancestries Reported - Swiss (%)
Ancestries Reported - Ukrainian (%)
Ancestries Reported - United States (%)
Ancestries Reported - Welsh (%)
Ancestries Reported - West Indian (%)
Ancestries Reported - Other (%)
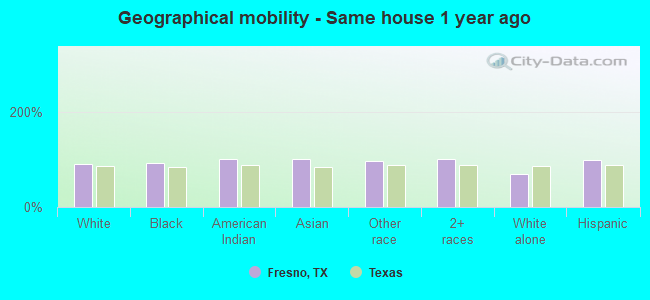
Geographical mobility - Same house 1 year ago (%)
Geographical mobility - Same house 1 year ago (%) - White
Geographical mobility - Same house 1 year ago (%) - Black or African American
Geographical mobility - Same house 1 year ago (%) - Asian
Geographical mobility - Same house 1 year ago (%) - Hispanic or Latino
Geographical mobility - Same house 1 year ago (%) - American Indian and Alaska Native
Geographical mobility - Same house 1 year ago (%) - Multirace
Geographical mobility - Same house 1 year ago (%) - Other Race
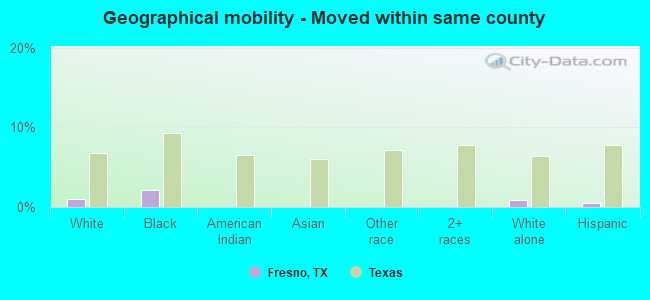
Geographical mobility - Moved within same county (%)
Geographical mobility - Moved within same county (%) - White
Geographical mobility - Moved within same county (%) - Black or African American
Geographical mobility - Moved within same county (%) - Asian
Geographical mobility - Moved within same county (%) - Hispanic or Latino
Geographical mobility - Moved within same county (%) - American Indian and Alaska Native
Geographical mobility - Moved within same county (%) - Multirace
Geographical mobility - Moved within same county (%) - Other Race
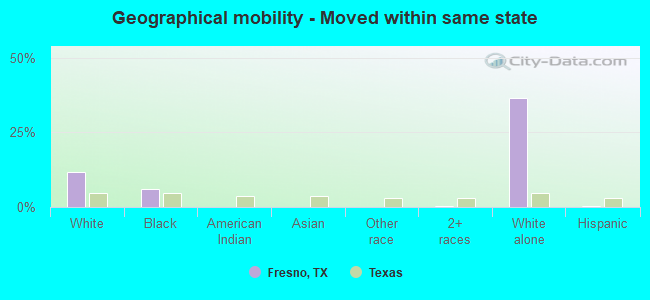
Geographical mobility - Moved from different county within same state (%)
Geographical mobility - Moved from different county within same state (%) - White
Geographical mobility - Moved from different county within same state (%) - Black or African American
Geographical mobility - Moved from different county within same state (%) - Asian
Geographical mobility - Moved from different county within same state (%) - Hispanic or Latino
Geographical mobility - Moved from different county within same state (%) - American Indian and Alaska Native
Geographical mobility - Moved from different county within same state (%) - Multirace
Geographical mobility - Moved from different county within same state (%) - Other Race
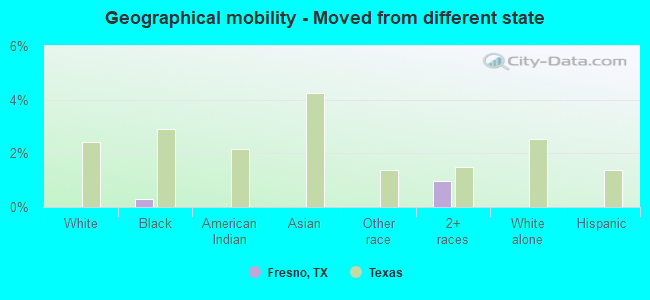
Geographical mobility - Moved from different state (%)
Geographical mobility - Moved from different state (%) - White
Geographical mobility - Moved from different state (%) - Black or African American
Geographical mobility - Moved from different state (%) - Asian
Geographical mobility - Moved from different state (%) - Hispanic or Latino
Geographical mobility - Moved from different state (%) - American Indian and Alaska Native
Geographical mobility - Moved from different state (%) - Multirace
Geographical mobility - Moved from different state (%) - Other Race
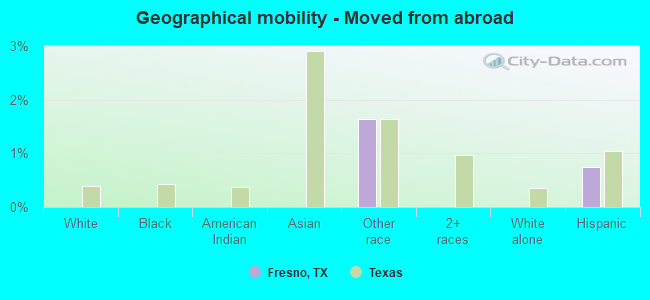
Geographical mobility - Moved from abroad (%)
Geographical mobility - Moved from abroad (%) - White
Geographical mobility - Moved from abroad (%) - Black or African American
Geographical mobility - Moved from abroad (%) - Asian
Geographical mobility - Moved from abroad (%) - Hispanic or Latino
Geographical mobility - Moved from abroad (%) - American Indian and Alaska Native
Geographical mobility - Moved from abroad (%) - Multirace
Geographical mobility - Moved from abroad (%) - Other Race
Place of birth for the foreign-born population - Ireland (%)
Place of birth for the foreign-born population - Denmark (%)
Place of birth for the foreign-born population - Norway (%)
Place of birth for the foreign-born population - Sweden (%)
Place of birth for the foreign-born population - United Kingdom (%)
Place of birth for the foreign-born population - England (%)
Place of birth for the foreign-born population - Scotland (%)
Place of birth for the foreign-born population - Other Northern Europe (%)
Place of birth for the foreign-born population - Austria (%)
Place of birth for the foreign-born population - Belgium (%)
Place of birth for the foreign-born population - France (%)
Place of birth for the foreign-born population - Germany (%)
Place of birth for the foreign-born population - Netherlands (%)
Place of birth for the foreign-born population - Switzerland (%)
Place of birth for the foreign-born population - Other Western Europe (%)
Place of birth for the foreign-born population - Greece (%)
Place of birth for the foreign-born population - Italy (%)
Place of birth for the foreign-born population - Portugal (%)
Place of birth for the foreign-born population - Spain (%)
Place of birth for the foreign-born population - Other Southern Europe (%)
Place of birth for the foreign-born population - Albania (%)
Place of birth for the foreign-born population - Belarus (%)
Place of birth for the foreign-born population - Bosnia and Herzegovina (%)
Place of birth for the foreign-born population - Bulgaria (%)
Place of birth for the foreign-born population - Croatia (%)
Place of birth for the foreign-born population - Czechoslovakia (%)
Place of birth for the foreign-born population - Hungary (%)
Place of birth for the foreign-born population - Latvia (%)
Place of birth for the foreign-born population - Lithuania (%)
Place of birth for the foreign-born population - North Macedonia (Macedonia) (%)
Place of birth for the foreign-born population - Moldova (%)
Place of birth for the foreign-born population - Poland (%)
Place of birth for the foreign-born population - Romania (%)
Place of birth for the foreign-born population - Russia (%)
Place of birth for the foreign-born population - Serbia (%)
Place of birth for the foreign-born population - Ukraine (%)
Place of birth for the foreign-born population - Other Eastern Europe (%)
Place of birth for the foreign-born population - China (%)
Place of birth for the foreign-born population - Hong Kong (%)
Place of birth for the foreign-born population - Taiwan (%)
Place of birth for the foreign-born population - Japan (%)
Place of birth for the foreign-born population - Korea (%)
Place of birth for the foreign-born population - Other Eastern Asia (%)
Place of birth for the foreign-born population - Afghanistan (%)
Place of birth for the foreign-born population - Bangladesh (%)
Place of birth for the foreign-born population - India (%)
Place of birth for the foreign-born population - Iran (%)
Place of birth for the foreign-born population - Kazakhstan (%)
Place of birth for the foreign-born population - Nepal (%)
Place of birth for the foreign-born population - Pakistan (%)
Place of birth for the foreign-born population - Sri Lanka (%)
Place of birth for the foreign-born population - Uzbekistan (%)
Place of birth for the foreign-born population - Other South Central Asia (%)
Place of birth for the foreign-born population - Burma (%)
Place of birth for the foreign-born population - Cambodia (%)
Place of birth for the foreign-born population - Indonesia (%)
Place of birth for the foreign-born population - Laos (%)
Place of birth for the foreign-born population - Malaysia (%)
Place of birth for the foreign-born population - Philippines (%)
Place of birth for the foreign-born population - Singapore (%)
Place of birth for the foreign-born population - Thailand (%)
Place of birth for the foreign-born population - Vietnam (%)
Place of birth for the foreign-born population - Other South Eastern Asia (%)
Place of birth for the foreign-born population - Armenia (%)
Place of birth for the foreign-born population - Iraq (%)
Place of birth for the foreign-born population - Israel (%)
Place of birth for the foreign-born population - Jordan (%)
Place of birth for the foreign-born population - Kuwait (%)
Place of birth for the foreign-born population - Lebanon (%)
Place of birth for the foreign-born population - Saudi Arabia (%)
Place of birth for the foreign-born population - Syria (%)
Place of birth for the foreign-born population - Turkey (%)
Place of birth for the foreign-born population - Yemen (%)
Place of birth for the foreign-born population - Other Western Asia (%)
Place of birth for the foreign-born population - Eritrea (%)
Place of birth for the foreign-born population - Ethiopia (%)
Place of birth for the foreign-born population - Kenya (%)
Place of birth for the foreign-born population - Somalia (%)
Place of birth for the foreign-born population - Uganda (%)
Place of birth for the foreign-born population - Zimbabwe (%)
Place of birth for the foreign-born population - Other Eastern Africa (%)
Place of birth for the foreign-born population - Cameroon (%)
Place of birth for the foreign-born population - Congo (%)
Place of birth for the foreign-born population - Democratic Republic of Congo (Zaire) (%)
Place of birth for the foreign-born population - Other Middle Africa (%)
Place of birth for the foreign-born population - Egypt (%)
Place of birth for the foreign-born population - Morocco (%)
Place of birth for the foreign-born population - Sudan (%)
Place of birth for the foreign-born population - Other Northern Africa (%)
Place of birth for the foreign-born population - South Africa (%)
Place of birth for the foreign-born population - Other Southern Africa (%)
Place of birth for the foreign-born population - Cabo Verde (%)
Place of birth for the foreign-born population - Ghana (%)
Place of birth for the foreign-born population - Liberia (%)
Place of birth for the foreign-born population - Nigeria (%)
Place of birth for the foreign-born population - Senegal (%)
Place of birth for the foreign-born population - Sierra Leone (%)
Place of birth for the foreign-born population - Other Western Africa (%)
Place of birth for the foreign-born population - Australia (%)
Place of birth for the foreign-born population - New Zealand (%)
Place of birth for the foreign-born population - Fiji (%)
Place of birth for the foreign-born population - Micronesia (%)
Place of birth for the foreign-born population - Bahamas (%)
Place of birth for the foreign-born population - Barbados (%)
Place of birth for the foreign-born population - Cuba (%)
Place of birth for the foreign-born population - Dominica (%)
Place of birth for the foreign-born population - Dominican Republic (%)
Place of birth for the foreign-born population - Grenada (%)
Place of birth for the foreign-born population - Haiti (%)
Place of birth for the foreign-born population - Jamaica (%)
Place of birth for the foreign-born population - St. Vincent and the Grenadines (%)
Place of birth for the foreign-born population - Trinidad and Tobago (%)
Place of birth for the foreign-born population - West Indies (%)
Place of birth for the foreign-born population - Other Caribbean (%)
Place of birth for the foreign-born population - Belize (%)
Place of birth for the foreign-born population - Costa Rica (%)
Place of birth for the foreign-born population - El Salvador (%)
Place of birth for the foreign-born population - Guatemala (%)
Place of birth for the foreign-born population - Honduras (%)
Place of birth for the foreign-born population - Mexico (%)
Place of birth for the foreign-born population - Nicaragua (%)
Place of birth for the foreign-born population - Panama (%)
Place of birth for the foreign-born population - Other Central America (%)
Place of birth for the foreign-born population - Argentina (%)
Place of birth for the foreign-born population - Bolivia (%)
Place of birth for the foreign-born population - Brazil (%)
Place of birth for the foreign-born population - Chile (%)
Place of birth for the foreign-born population - Colombia (%)
Place of birth for the foreign-born population - Ecuador (%)
Place of birth for the foreign-born population - Guyana (%)
Place of birth for the foreign-born population - Peru (%)
Place of birth for the foreign-born population - Uruguay (%)
Place of birth for the foreign-born population - Venezuela (%)
Place of birth for the foreign-born population - Other South America (%)
Place of birth for the foreign-born population - Canada (%)
Place of birth for the foreign-born population - Other Northern America (%)
Place of birth for the foreign-born population - Other (%)
Latest news about races in Fresno, TX collected exclusively by city-data.com from local newspapers, TV, and radio stations
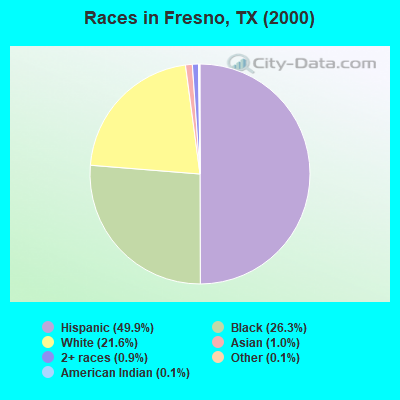
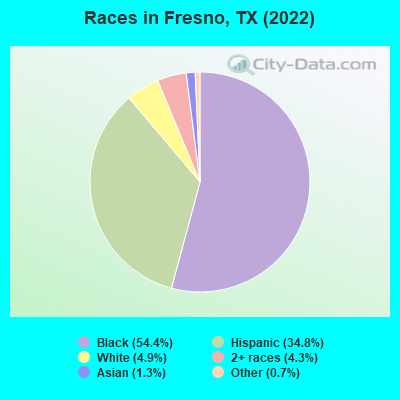
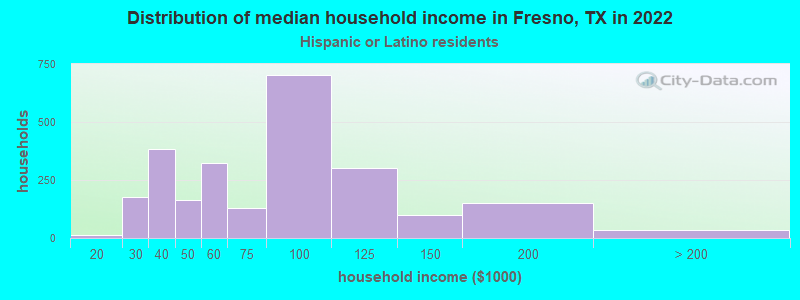
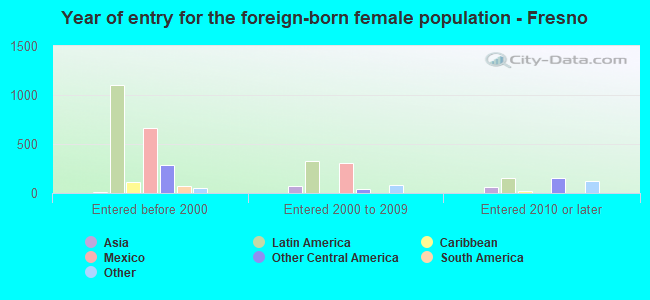
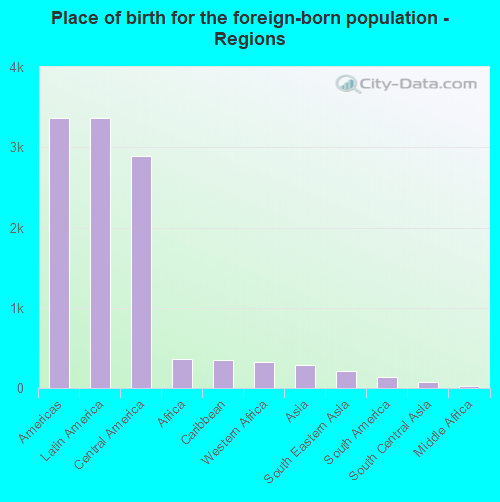
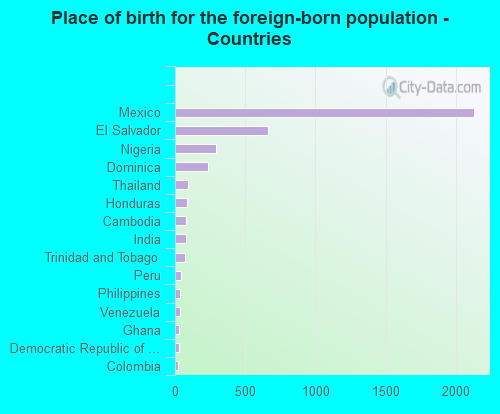
According to 2022 data, the most numerous races in Fresno, TX are Hispanic (8,770 residents), White alone (1,238 residents), and Black alone (13,717 residents). 66.8% of Fresno residents speak English at home. 16.0% of Fresno, TX residents are foreign-born (13.8% born in Latin America), which is 6.3% less than the foreign-born rate of 17.0% across the entire state of Texas.
Race distribution in Fresno
2000 2022
10,933,313 52.4% White alone 6,669,666 32.0% Hispanic 2,364,255 11.3% Black alone 554,445 2.7% Asian alone 230,567 1.1% Two or more races 68,859 0.3% American Indian alone 19,958 0.10% Other race alone 10,757 0.05% Native Hawaiian and Other
12,070,642 40.2% Hispanic 11,683,430 38.9% White alone 3,508,706 11.7% Black alone 1,608,173 5.4% Asian alone 956,560 3.2% Two or more races 125,763 0.4% Other race alone 47,023 0.2% American Indian alone 29,275 0.10% Native Hawaiian and Other
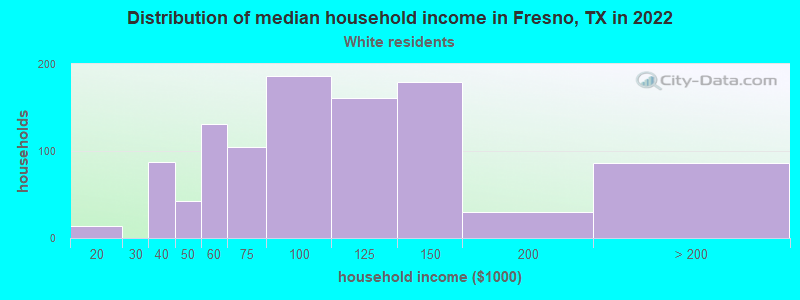
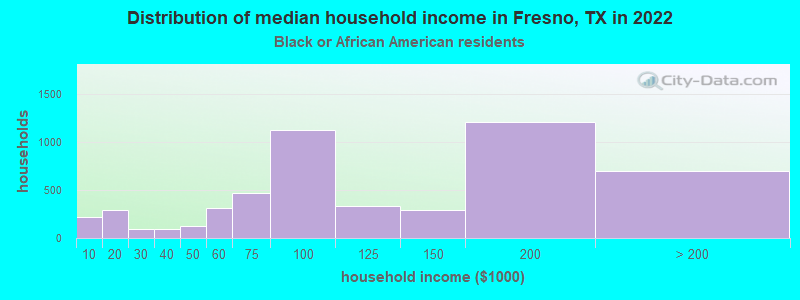
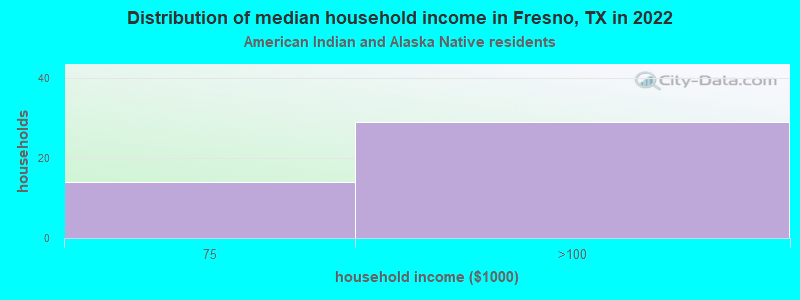
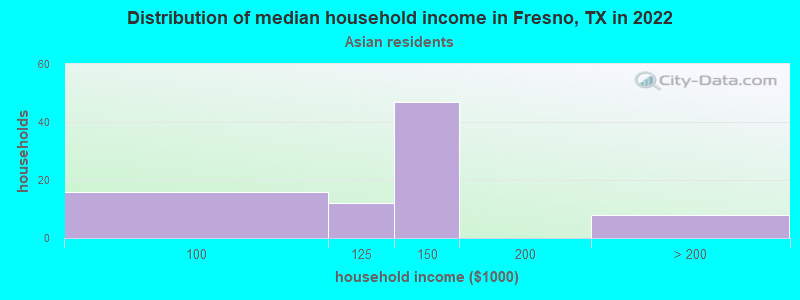
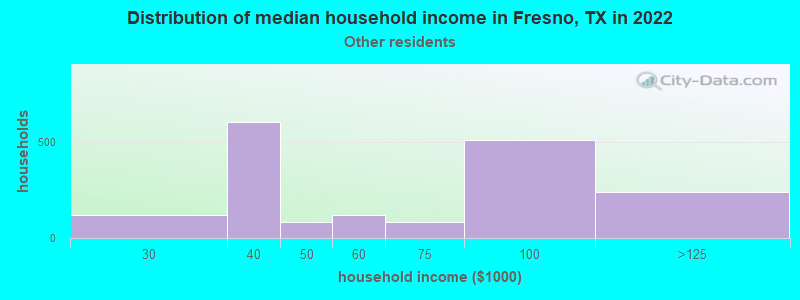
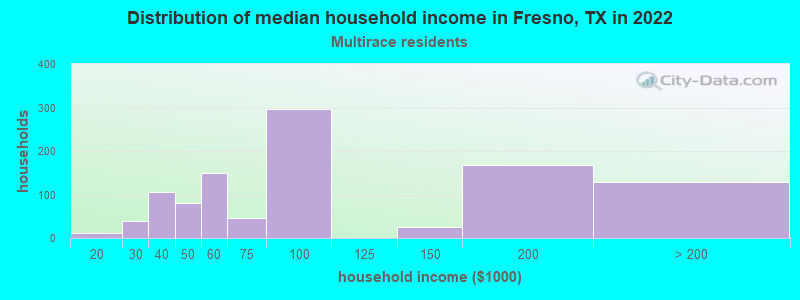
Income and house value in Fresno Median household income in 2022 $110,100 White non-Hispanic householders$92,199 Black householders$132,536 Asian householders$64,038 Some other race householders$81,106 Two or more races householders$75,832 Hispanic or Latino race householdersMedian 2022 house value $300,701 White Non-Hispanic householders$341,415 Black or African American householders$109,055 American Indian or Alaska Native householders $309,135 Asian householders$193,391 Some other race householders$327,165 Two or more races householders$190,774 Hispanic or Latino householders
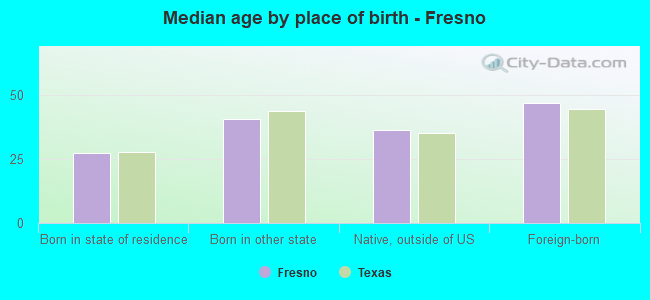
Median age by race in Fresno
35.2 Median age for White residents34.9 36.5 42.2 Median age for Black or African American residents41.4 42.9 47.5 Median age for American Indian / Alaska Native residents47.2 37.3 50.8 Median age for Asian residents44.0 57.7 -581,560,283.1 Median age for Native Hawaiian / Pacific Islander residents-612,729,233.5 -577,777,777.2 25.7 Median age for Other race residents22.4 33.1 25.1 Median age for Two or more races residents29.1 22.5 38.6 Median age for White alone residents33.4 42.8 29.0 Median age for Hispanic or Latino residents28.5 31.8
Owner/renter occupied households by race in Fresno
House owners and renters - White residents 883 86.8% Owner occupied134 13.2% Renter occupiedHouse owners and renters - Black or African American residents 4,518 85.8% Owner occupied750 14.2% Renter occupiedHouse owners and renters - American Indian / Alaska Native residents 35 100.0% Owner occupiedHouse owners and renters - Asian residents 91 100.0% Owner occupiedHouse owners and renters - Other race residents 956 61.0% Owner occupied613 39.0% Renter occupiedHouse owners and renters - Two or more races residents 994 94.7% Owner occupied56 5.3% Renter occupiedHouse owners and renters - White alone residents 369 74.3% Owner occupied128 25.7% Renter occupiedHouse owners and renters - Hispanic or Latino residents 1,925 78.9% Owner occupied516 21.1% Renter occupied
Language usage in Fresno
English speakers - Total 66.8% of residents of Fresno speak English at home.
30.4% of residents speak Spanish at home 4,187 57.1% Speak English very well3,141 42.9% Speak English less than very well3.2% of residents speak other language at home 475 61.8% Speak English very well294 38.2% Speak English less than very well
English speakers - Born in the United States 92.8% of residents of Fresno speak English at home.
4.7% of residents speak Spanish at home 189 74.4% Speak English very well65 25.6% Speak English less than very well2.4% of residents speak other language at home 119 91.5% Speak English very well11 8.5% Speak English less than very well
English speakers - Native, born elsewhere 52.2% of residents of Fresno speak English at home.
35.6% of residents speak Spanish at home 32 100.0% Speak English very well
English speakers - Foreign-born 15.8% of residents of Fresno speak English at home.
67.8% of residents speak Spanish at home 555 19.5% Speak English very well2,285 80.5% Speak English less than very well14.2% of residents speak other language at home 328 55.1% Speak English very well267 44.9% Speak English less than very well
White (Caucasian) - Speak only English Native:
53.6% (1,127)Foreign-born:
14.6% (109)
White (Caucasian) - Speak another language Native:
29.6% (624)Foreign-born:
79.4% (593)
Black or African American - Speak only English Native:
100.0% (13,157)Foreign-born:
57.9% (277)
Black or African American - Speak another language Native:
0.9% (113)Foreign-born:
42.4% (203)
American Indian / Alaska Native - Speak another language Native:
100.0% (30)Foreign-born:
77.9% (93)
Asian - Speak another language Native:
45.9% (13)Foreign-born:
99.0% (307)
Other race - Speak only English Native:
23.8% (881)Foreign-born:
1.4% (23)
Other race - Speak another language Native:
78.0% (2,894)Foreign-born:
92.0% (1,513)
Two or more races - Speak only English Native:
45.8% (1,316)Foreign-born:
17.6% (169)
Two or more races - Speak another language Native:
56.6% (1,623)Foreign-born:
75.2% (724)
Hispanic or Latino - Speak only English Native:
15.7% (815)Foreign-born:
11.4% (355)
Hispanic or Latino - Speak another language Native:
88.4% (4,581)Foreign-born:
89.5% (2,785)
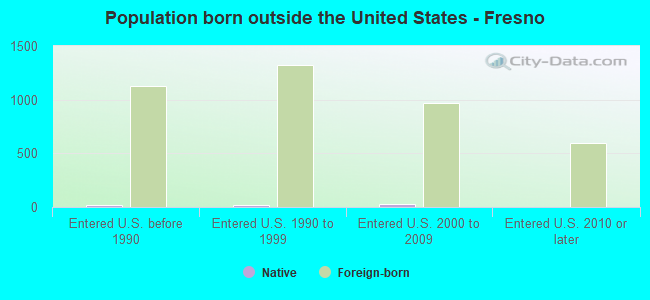
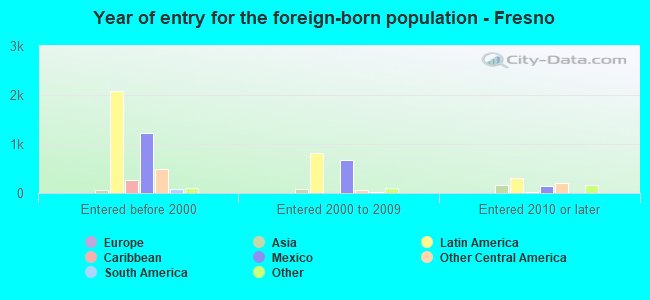
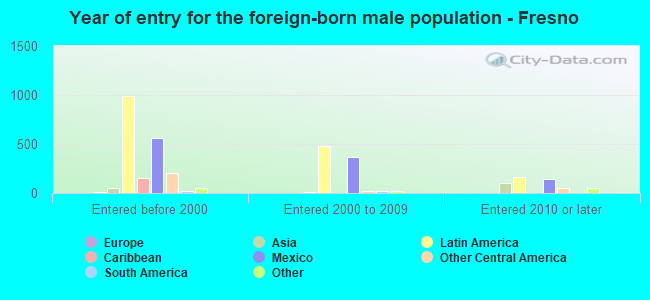
Foreign-born residents in Fresno 4,032 residents are foreign born (13.8% Latin America ).
This city:
16.0%Texas:
17.1%
Marital status for residents in Fresno Marital status - White (Caucasian) population 15 years and over
Males 26.4% Never married70.3% Now married0.0% Separated0.0% Widowed3.3% DivorcedFemales 20.7% Never married55.4% Now married3.8% Separated7.2% Widowed12.8% DivorcedWomen who gave birth in the past 12 months Now married:
100.0% (32)Unmarried:
0.0% (0)
Women who did not give birth in the past 12 months Now married:
60.7% (562)Unmarried:
39.3% (364)
Marital status - Black or African American population 15 years and over
Males 40.5% Never married40.6% Now married6.3% Separated6.1% Widowed6.5% DivorcedFemales 36.9% Never married37.0% Now married3.7% Separated5.7% Widowed16.7% DivorcedWomen who gave birth in the past 12 months Now married:
100.0% (83)Unmarried:
0.0% (0)
Women who did not give birth in the past 12 months Now married:
32.0% (1,122)Unmarried:
68.0% (2,382)
Marital status - American Indian / Alaska Native population 15 years and over
Males 0.0% Never married100.0% Now married0.0% Separated0.0% Widowed0.0% DivorcedFemales 17.1% Never married62.9% Now married0.0% Separated20.0% Widowed0.0% DivorcedWomen who did not give birth in the past 12 months Now married:
57.1% (11)Unmarried:
42.9% (9)
Marital status - Asian population 15 years and over
Males 24.2% Never married75.8% Now married0.0% Separated0.0% Widowed0.0% DivorcedFemales 8.1% Never married57.4% Now married0.0% Separated34.5% Widowed0.0% DivorcedWomen who did not give birth in the past 12 months Now married:
81.0% (56)Unmarried:
19.0% (13)
Marital status - Other race population 15 years and over
Males 45.8% Never married43.9% Now married0.0% Separated0.0% Widowed10.4% DivorcedFemales 38.5% Never married56.5% Now married1.6% Separated0.0% Widowed3.4% DivorcedWomen who gave birth in the past 12 months Now married:
100.0% (61)Unmarried:
0.0% (0)
Women who did not give birth in the past 12 months Now married:
45.9% (612)Unmarried:
54.1% (721)
Marital status - Two or more races population 15 years and over
Males 68.4% Never married25.9% Now married1.2% Separated0.0% Widowed4.5% DivorcedFemales 59.9% Never married25.6% Now married9.4% Separated0.0% Widowed5.2% DivorcedWomen who did not give birth in the past 12 months Now married:
30.3% (589)Unmarried:
69.7% (1,352)
Marital status - White alone, not Hispanic / Latino population 15 years and over
Males 6.7% Never married93.3% Now married0.0% Separated0.0% Widowed0.0% DivorcedFemales 9.2% Never married62.6% Now married0.0% Separated7.3% Widowed20.9% DivorcedWomen who gave birth in the past 12 months Now married:
100.0% (40)Unmarried:
0.0% (0)
Women who did not give birth in the past 12 months Now married:
55.4% (250)Unmarried:
44.6% (201)
Marital status - Hispanic or Latino population 15 years and over
Males 46.6% Never married44.6% Now married0.3% Separated0.0% Widowed8.5% DivorcedFemales 39.8% Never married46.8% Now married6.6% Separated2.4% Widowed4.3% DivorcedWomen who gave birth in the past 12 months Now married:
100.0% (44)Unmarried:
0.0% (0)
Women who did not give birth in the past 12 months Now married:
48.6% (1,236)Unmarried:
51.4% (1,307)
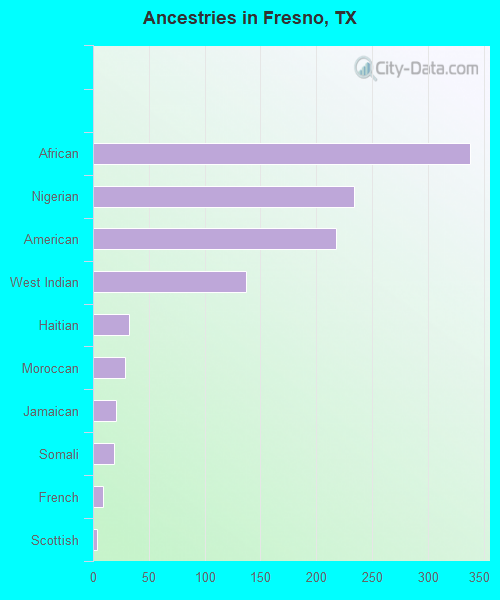
Ancestries in Fresno
338 2.0% African234 1.4% Nigerian218 1.3% American137 0.8% West Indian32 0.2% Haitian29 0.2% Moroccan21 0.1% Jamaican19 0.1% Somali9 0.05% French4 0.02% Scottish
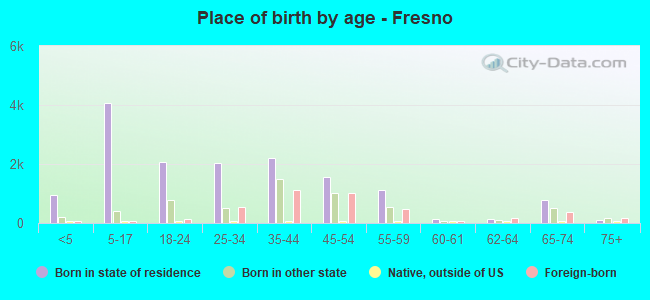
Children Nativity (place of birth) in Fresno
Children under 6 years - Living with two parents Both parents native 550 100.0% NativeBoth parents foreign-born 284 100.0% NativeOne native, one foreign-born parent 55 100.0% NativeChildren under 6 years - Living with one parent Native parent 225 100.0% NativeForeign-born parent 185 100.0% NativeChildren 6 to 17 years - Living with two parents Both parents native 1,105 100.0% NativeBoth parents foreign-born 871 100.0% NativeOne native, one foreign-born parent 156 100.0% NativeChildren 6 to 17 years - Living with one parent Native parent 709 100.0% NativeForeign-born parent 890 52.4% Native809 47.6% Foreign-born
Grandparents responsible for own grandchildren in Fresno
Grandparents (30 to 59 years) White / Caucasian 9 100.0% Not responsible for grandchildrenBlack or African American 18 21.8% Responsible for grandchildren66 78.2% Not responsible for grandchildrenWhite alone, not Hispanic / Latino 8 100.0% Not responsible for grandchildren
Grandparents (60 years and over) White / Caucasian 18 100.0% Not responsible for grandchildrenBlack or African American 104 100.0% Not responsible for grandchildrenWhite alone, not Hispanic / Latino 20 100.0% Not responsible for grandchildren