Races in Georgetown, Kentucky (KY) Detailed Stats
Data:
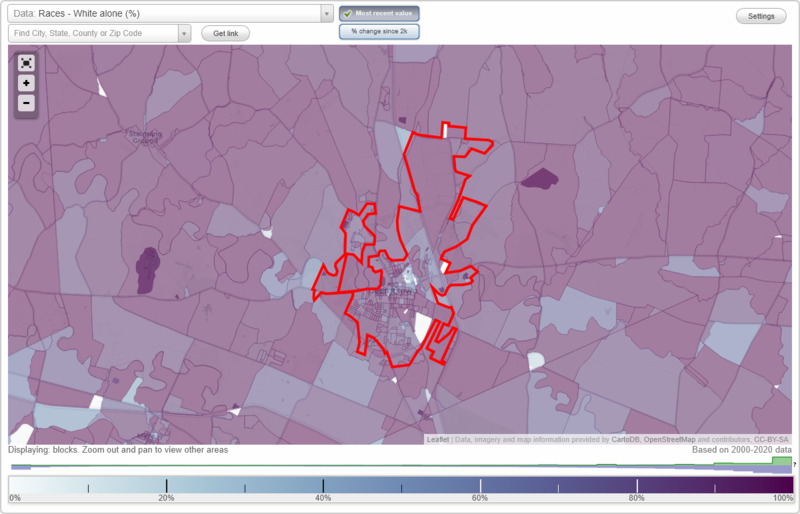
Races - White alone (%)
Races - White alone (% change since 2000)
Races - Black alone (%)
Races - Black alone (% change since 2000)
Races - American Indian alone (%)
Races - American Indian alone (% change since 2000)
Races - Asian alone (%)
Races - Asian alone (% change since 2000)
Races - Hispanic (%)
Races - Hispanic (% change since 2000)
Races - Native Hawaiian and Other Pacific Islander alone (%)
Races - Native Hawaiian and Other Pacific Islander alone (% change since 2000)
Races - Two or more races(%)
Races - Two or more races(% change since 2000)
Races - Other race alone (%)
Races - Other race alone (% change since 2000)
Racial diversity
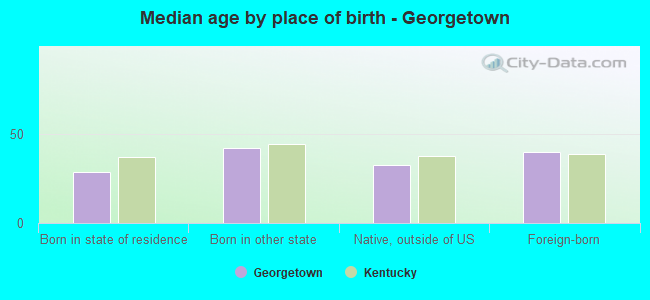
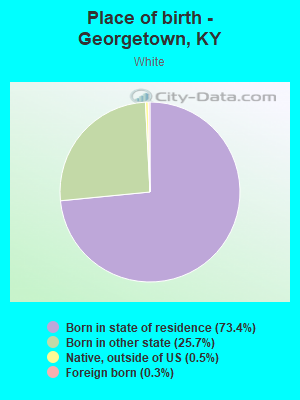
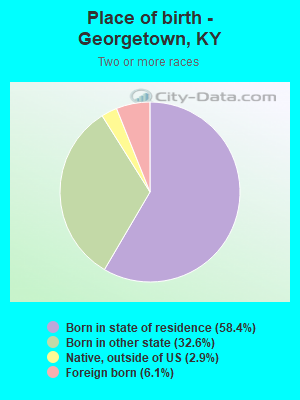
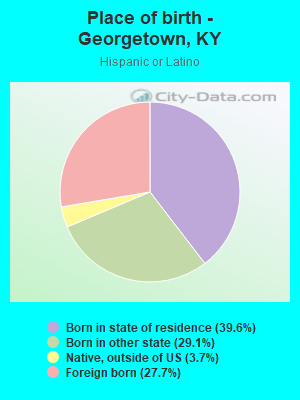
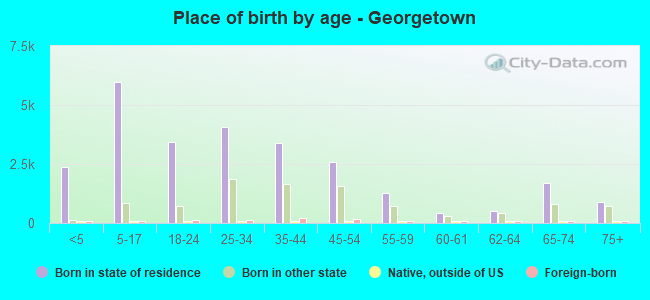
Place of birth - Born in state of residence (%)
Place of birth - Born in state of residence (%) - White
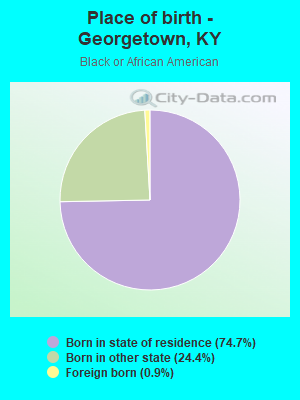
Place of birth - Born in state of residence (%) - Black or African American
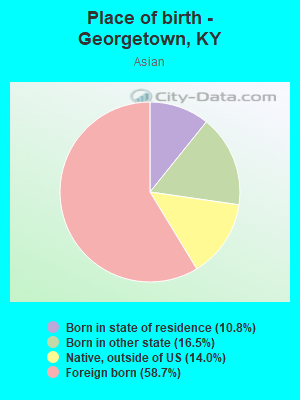
Place of birth - Born in state of residence (%) - Asian
Place of birth - Born in state of residence (%) - Hispanic or Latino
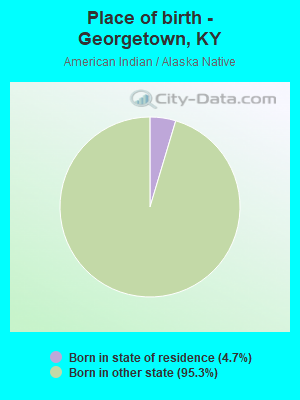
Place of birth - Born in state of residence (%) - American Indian and Alaska Native
Place of birth - Born in state of residence (%) - Multirace
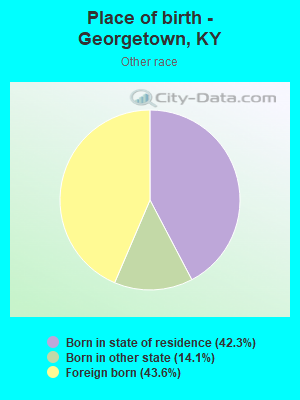
Place of birth - Born in state of residence (%) - Other Race
Place of birth - Born in other state (%)
Place of birth - Born in other state (%) - White
Place of birth - Born in other state (%) - Black or African American
Place of birth - Born in other state (%) - Asian
Place of birth - Born in other state (%) - Hispanic or Latino
Place of birth - Born in other state (%) - American Indian and Alaska Native
Place of birth - Born in other state (%) - Multirace
Place of birth - Born in other state (%) - Other Race
Place of birth - Native, outside of US (%)
Place of birth - Native, outside of US (%) - White
Place of birth - Native, outside of US (%) - Black or African American
Place of birth - Native, outside of US (%) - Asian
Place of birth - Native, outside of US (%) - Hispanic or Latino
Place of birth - Native, outside of US (%) - American Indian and Alaska Native
Place of birth - Native, outside of US (%) - Multirace
Place of birth - Native, outside of US (%) - Other Race
Place of birth - Foreign born (%)
Place of birth - Foreign born (%) - White
Place of birth - Foreign born (%) - Black or African American
Place of birth - Foreign born (%) - Asian
Place of birth - Foreign born (%) - Hispanic or Latino
Place of birth - Foreign born (%) - American Indian and Alaska Native
Place of birth - Foreign born (%) - Multirace
Place of birth - Foreign born (%) - Other Race
Residents speaking English at home (%)
Residents speaking English at home - Born in the United States (%)
Residents speaking English at home - Native, born elsewhere (%)
Residents speaking English at home - Foreign born (%)
Residents speaking Spanish at home (%)
Residents speaking Spanish at home - Born in the United States (%)
Residents speaking Spanish at home - Native, born elsewhere (%)
Residents speaking Spanish at home - Foreign born (%)
Residents speaking other language at home (%)
Residents speaking other language at home - Born in the United States (%)
Residents speaking other language at home - Native, born elsewhere (%)
Residents speaking other language at home - Foreign born (%)
Marital status - Never married (%)
Marital status - Now married (%)
Marital status - Separated (%)
Marital status - Widowed (%)
Marital status - Divorced (%)
Ancestries Reported - Arab (%)
Ancestries Reported - Czech (%)
Ancestries Reported - Danish (%)
Ancestries Reported - Dutch (%)
Ancestries Reported - English (%)
Ancestries Reported - French (%)
Ancestries Reported - French Canadian (%)
Ancestries Reported - German (%)
Ancestries Reported - Greek (%)
Ancestries Reported - Hungarian (%)
Ancestries Reported - Irish (%)
Ancestries Reported - Italian (%)
Ancestries Reported - Lithuanian (%)
Ancestries Reported - Norwegian (%)
Ancestries Reported - Polish (%)
Ancestries Reported - Portuguese (%)
Ancestries Reported - Russian (%)
Ancestries Reported - Scotch-Irish (%)
Ancestries Reported - Scottish (%)
Ancestries Reported - Slovak (%)
Ancestries Reported - Subsaharan African (%)
Ancestries Reported - Swedish (%)
Ancestries Reported - Swiss (%)
Ancestries Reported - Ukrainian (%)
Ancestries Reported - United States (%)
Ancestries Reported - Welsh (%)
Ancestries Reported - West Indian (%)
Ancestries Reported - Other (%)
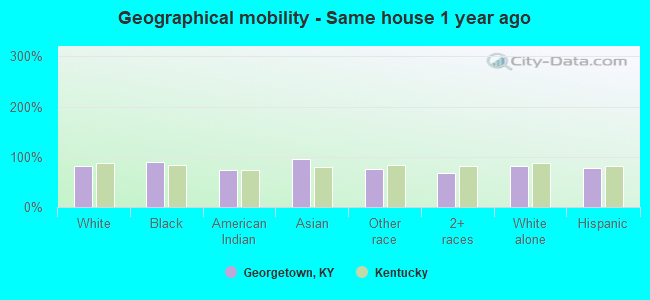
Geographical mobility - Same house 1 year ago (%)
Geographical mobility - Same house 1 year ago (%) - White
Geographical mobility - Same house 1 year ago (%) - Black or African American
Geographical mobility - Same house 1 year ago (%) - Asian
Geographical mobility - Same house 1 year ago (%) - Hispanic or Latino
Geographical mobility - Same house 1 year ago (%) - American Indian and Alaska Native
Geographical mobility - Same house 1 year ago (%) - Multirace
Geographical mobility - Same house 1 year ago (%) - Other Race
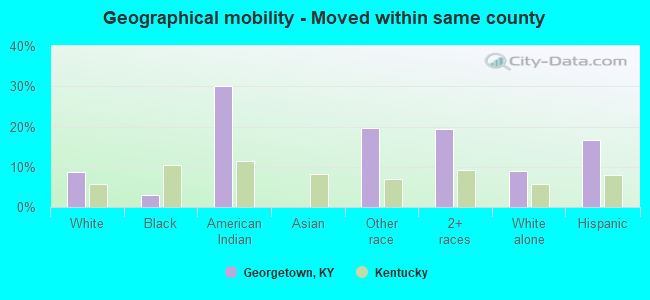
Geographical mobility - Moved within same county (%)
Geographical mobility - Moved within same county (%) - White
Geographical mobility - Moved within same county (%) - Black or African American
Geographical mobility - Moved within same county (%) - Asian
Geographical mobility - Moved within same county (%) - Hispanic or Latino
Geographical mobility - Moved within same county (%) - American Indian and Alaska Native
Geographical mobility - Moved within same county (%) - Multirace
Geographical mobility - Moved within same county (%) - Other Race
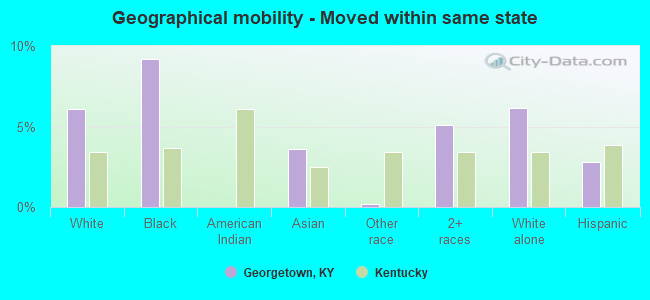
Geographical mobility - Moved from different county within same state (%)
Geographical mobility - Moved from different county within same state (%) - White
Geographical mobility - Moved from different county within same state (%) - Black or African American
Geographical mobility - Moved from different county within same state (%) - Asian
Geographical mobility - Moved from different county within same state (%) - Hispanic or Latino
Geographical mobility - Moved from different county within same state (%) - American Indian and Alaska Native
Geographical mobility - Moved from different county within same state (%) - Multirace
Geographical mobility - Moved from different county within same state (%) - Other Race
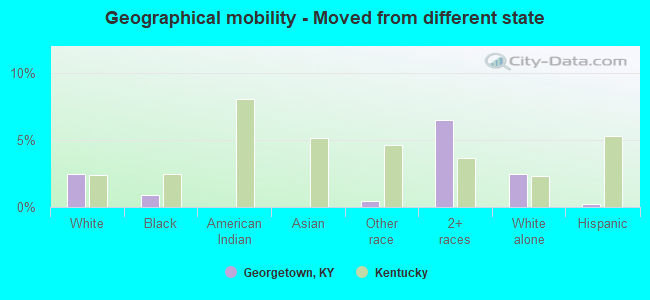
Geographical mobility - Moved from different state (%)
Geographical mobility - Moved from different state (%) - White
Geographical mobility - Moved from different state (%) - Black or African American
Geographical mobility - Moved from different state (%) - Asian
Geographical mobility - Moved from different state (%) - Hispanic or Latino
Geographical mobility - Moved from different state (%) - American Indian and Alaska Native
Geographical mobility - Moved from different state (%) - Multirace
Geographical mobility - Moved from different state (%) - Other Race
Geographical mobility - Moved from abroad (%)
Geographical mobility - Moved from abroad (%) - White
Geographical mobility - Moved from abroad (%) - Black or African American
Geographical mobility - Moved from abroad (%) - Asian
Geographical mobility - Moved from abroad (%) - Hispanic or Latino
Geographical mobility - Moved from abroad (%) - American Indian and Alaska Native
Geographical mobility - Moved from abroad (%) - Multirace
Geographical mobility - Moved from abroad (%) - Other Race
Place of birth for the foreign-born population - Ireland (%)
Place of birth for the foreign-born population - Denmark (%)
Place of birth for the foreign-born population - Norway (%)
Place of birth for the foreign-born population - Sweden (%)
Place of birth for the foreign-born population - United Kingdom (%)
Place of birth for the foreign-born population - England (%)
Place of birth for the foreign-born population - Scotland (%)
Place of birth for the foreign-born population - Other Northern Europe (%)
Place of birth for the foreign-born population - Austria (%)
Place of birth for the foreign-born population - Belgium (%)
Place of birth for the foreign-born population - France (%)
Place of birth for the foreign-born population - Germany (%)
Place of birth for the foreign-born population - Netherlands (%)
Place of birth for the foreign-born population - Switzerland (%)
Place of birth for the foreign-born population - Other Western Europe (%)
Place of birth for the foreign-born population - Greece (%)
Place of birth for the foreign-born population - Italy (%)
Place of birth for the foreign-born population - Portugal (%)
Place of birth for the foreign-born population - Spain (%)
Place of birth for the foreign-born population - Other Southern Europe (%)
Place of birth for the foreign-born population - Albania (%)
Place of birth for the foreign-born population - Belarus (%)
Place of birth for the foreign-born population - Bosnia and Herzegovina (%)
Place of birth for the foreign-born population - Bulgaria (%)
Place of birth for the foreign-born population - Croatia (%)
Place of birth for the foreign-born population - Czechoslovakia (%)
Place of birth for the foreign-born population - Hungary (%)
Place of birth for the foreign-born population - Latvia (%)
Place of birth for the foreign-born population - Lithuania (%)
Place of birth for the foreign-born population - North Macedonia (Macedonia) (%)
Place of birth for the foreign-born population - Moldova (%)
Place of birth for the foreign-born population - Poland (%)
Place of birth for the foreign-born population - Romania (%)
Place of birth for the foreign-born population - Russia (%)
Place of birth for the foreign-born population - Serbia (%)
Place of birth for the foreign-born population - Ukraine (%)
Place of birth for the foreign-born population - Other Eastern Europe (%)
Place of birth for the foreign-born population - China (%)
Place of birth for the foreign-born population - Hong Kong (%)
Place of birth for the foreign-born population - Taiwan (%)
Place of birth for the foreign-born population - Japan (%)
Place of birth for the foreign-born population - Korea (%)
Place of birth for the foreign-born population - Other Eastern Asia (%)
Place of birth for the foreign-born population - Afghanistan (%)
Place of birth for the foreign-born population - Bangladesh (%)
Place of birth for the foreign-born population - India (%)
Place of birth for the foreign-born population - Iran (%)
Place of birth for the foreign-born population - Kazakhstan (%)
Place of birth for the foreign-born population - Nepal (%)
Place of birth for the foreign-born population - Pakistan (%)
Place of birth for the foreign-born population - Sri Lanka (%)
Place of birth for the foreign-born population - Uzbekistan (%)
Place of birth for the foreign-born population - Other South Central Asia (%)
Place of birth for the foreign-born population - Burma (%)
Place of birth for the foreign-born population - Cambodia (%)
Place of birth for the foreign-born population - Indonesia (%)
Place of birth for the foreign-born population - Laos (%)
Place of birth for the foreign-born population - Malaysia (%)
Place of birth for the foreign-born population - Philippines (%)
Place of birth for the foreign-born population - Singapore (%)
Place of birth for the foreign-born population - Thailand (%)
Place of birth for the foreign-born population - Vietnam (%)
Place of birth for the foreign-born population - Other South Eastern Asia (%)
Place of birth for the foreign-born population - Armenia (%)
Place of birth for the foreign-born population - Iraq (%)
Place of birth for the foreign-born population - Israel (%)
Place of birth for the foreign-born population - Jordan (%)
Place of birth for the foreign-born population - Kuwait (%)
Place of birth for the foreign-born population - Lebanon (%)
Place of birth for the foreign-born population - Saudi Arabia (%)
Place of birth for the foreign-born population - Syria (%)
Place of birth for the foreign-born population - Turkey (%)
Place of birth for the foreign-born population - Yemen (%)
Place of birth for the foreign-born population - Other Western Asia (%)
Place of birth for the foreign-born population - Eritrea (%)
Place of birth for the foreign-born population - Ethiopia (%)
Place of birth for the foreign-born population - Kenya (%)
Place of birth for the foreign-born population - Somalia (%)
Place of birth for the foreign-born population - Uganda (%)
Place of birth for the foreign-born population - Zimbabwe (%)
Place of birth for the foreign-born population - Other Eastern Africa (%)
Place of birth for the foreign-born population - Cameroon (%)
Place of birth for the foreign-born population - Congo (%)
Place of birth for the foreign-born population - Democratic Republic of Congo (Zaire) (%)
Place of birth for the foreign-born population - Other Middle Africa (%)
Place of birth for the foreign-born population - Egypt (%)
Place of birth for the foreign-born population - Morocco (%)
Place of birth for the foreign-born population - Sudan (%)
Place of birth for the foreign-born population - Other Northern Africa (%)
Place of birth for the foreign-born population - South Africa (%)
Place of birth for the foreign-born population - Other Southern Africa (%)
Place of birth for the foreign-born population - Cabo Verde (%)
Place of birth for the foreign-born population - Ghana (%)
Place of birth for the foreign-born population - Liberia (%)
Place of birth for the foreign-born population - Nigeria (%)
Place of birth for the foreign-born population - Senegal (%)
Place of birth for the foreign-born population - Sierra Leone (%)
Place of birth for the foreign-born population - Other Western Africa (%)
Place of birth for the foreign-born population - Australia (%)
Place of birth for the foreign-born population - New Zealand (%)
Place of birth for the foreign-born population - Fiji (%)
Place of birth for the foreign-born population - Micronesia (%)
Place of birth for the foreign-born population - Bahamas (%)
Place of birth for the foreign-born population - Barbados (%)
Place of birth for the foreign-born population - Cuba (%)
Place of birth for the foreign-born population - Dominica (%)
Place of birth for the foreign-born population - Dominican Republic (%)
Place of birth for the foreign-born population - Grenada (%)
Place of birth for the foreign-born population - Haiti (%)
Place of birth for the foreign-born population - Jamaica (%)
Place of birth for the foreign-born population - St. Vincent and the Grenadines (%)
Place of birth for the foreign-born population - Trinidad and Tobago (%)
Place of birth for the foreign-born population - West Indies (%)
Place of birth for the foreign-born population - Other Caribbean (%)
Place of birth for the foreign-born population - Belize (%)
Place of birth for the foreign-born population - Costa Rica (%)
Place of birth for the foreign-born population - El Salvador (%)
Place of birth for the foreign-born population - Guatemala (%)
Place of birth for the foreign-born population - Honduras (%)
Place of birth for the foreign-born population - Mexico (%)
Place of birth for the foreign-born population - Nicaragua (%)
Place of birth for the foreign-born population - Panama (%)
Place of birth for the foreign-born population - Other Central America (%)
Place of birth for the foreign-born population - Argentina (%)
Place of birth for the foreign-born population - Bolivia (%)
Place of birth for the foreign-born population - Brazil (%)
Place of birth for the foreign-born population - Chile (%)
Place of birth for the foreign-born population - Colombia (%)
Place of birth for the foreign-born population - Ecuador (%)
Place of birth for the foreign-born population - Guyana (%)
Place of birth for the foreign-born population - Peru (%)
Place of birth for the foreign-born population - Uruguay (%)
Place of birth for the foreign-born population - Venezuela (%)
Place of birth for the foreign-born population - Other South America (%)
Place of birth for the foreign-born population - Canada (%)
Place of birth for the foreign-born population - Other Northern America (%)
Place of birth for the foreign-born population - Other (%)
Latest news about races in Georgetown, KY collected exclusively by city-data.com from local newspapers, TV, and radio stations
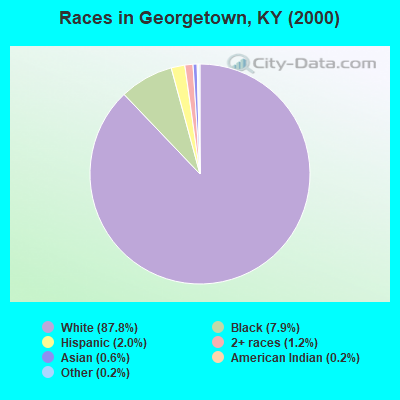
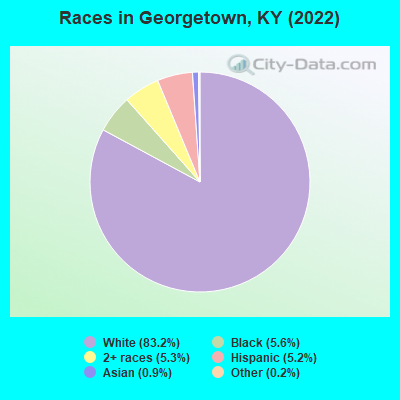
According to 2022 data, the most numerous races in Georgetown, KY are White alone (31,264 residents), Black alone (2,099 residents), and Hispanic (1,961 residents). 95.6% of Georgetown residents speak English at home. 2.4% of Georgetown, KY residents are foreign-born (1.4% born in Latin America, 0.6% born in Asia), which is 66.5% less than the foreign-born rate of 4.0% across the entire state of Kentucky.
Race distribution in Georgetown
2000 2022
3,608,013 89.3% White alone 293,639 7.3% Black alone 59,939 1.5% Hispanic 37,750 0.9% Two or more races 29,368 0.7% Asian alone 7,939 0.2% American Indian alone 3,846 0.10% Other race alone 1,275 0.03% Native Hawaiian and Other
3,710,998 82.2% White alone 343,194 7.6% Black alone 187,483 4.2% Hispanic 187,394 4.2% Two or more races 62,240 1.4% Asian alone 13,529 0.3% Other race alone 4,302 0.10% American Indian alone 3,170 0.07% Native Hawaiian and Other
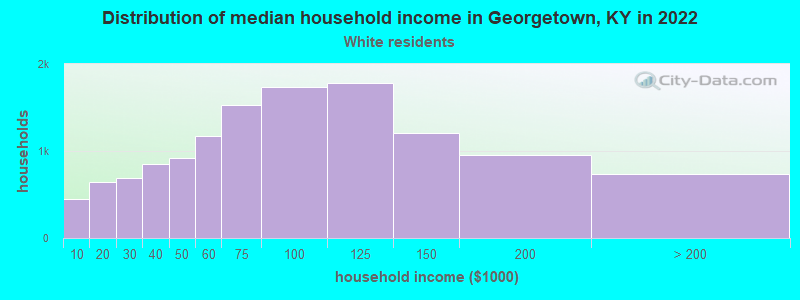
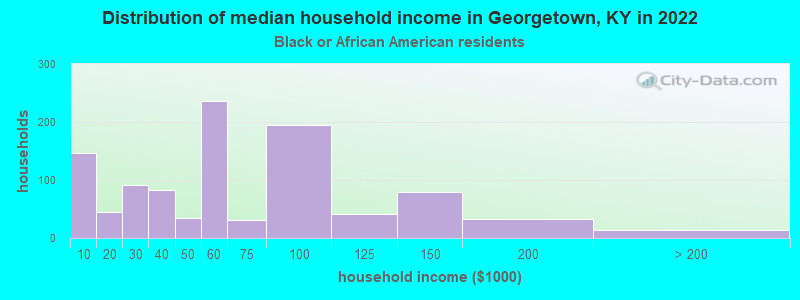
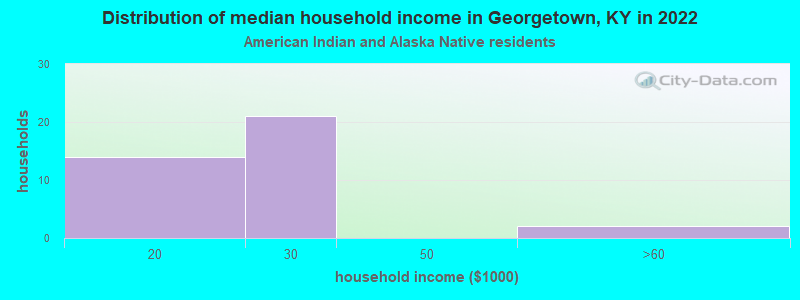
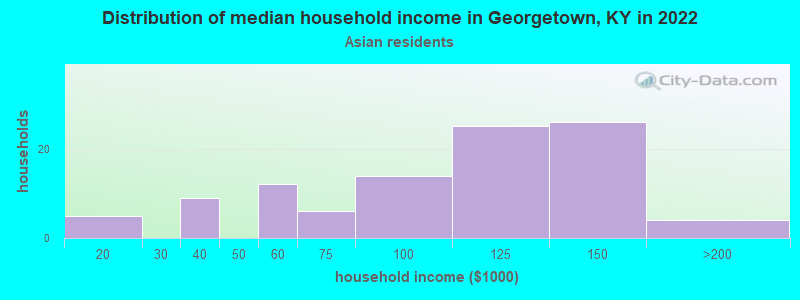
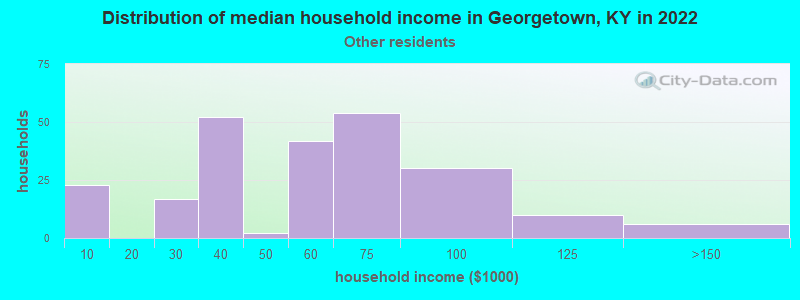
Income and house value in Georgetown Median household income in 2022 $74,792 White non-Hispanic householders$51,628 Black householders$29,236 American Indian and Alaska Native householders$106,921 Asian householders$54,254 Some other race householders$70,794 Two or more races householders$53,824 Hispanic or Latino race householdersMedian 2022 house value $249,363 White Non-Hispanic householders$193,186 Black or African American householders$216,063 American Indian or Alaska Native householders $376,713 Asian householders$260,547 Two or more races householders$165,225 Hispanic or Latino householders
Median age by race in Georgetown
33.8 Median age for White residents32.4 35.3 36.4 Median age for Black or African American residents41.9 32.8 27.8 Median age for American Indian / Alaska Native residents64.1 33.2 39.8 Median age for Asian residents39.2 40.6 -755,186,721.2 Median age for Native Hawaiian / Pacific Islander residents-724,043,715.1 -853,801,168.7 25.4 Median age for Other race residents34.8 13.0 18.1 Median age for Two or more races residents17.4 18.2 33.8 Median age for White alone residents32.4 35.3 21.8 Median age for Hispanic or Latino residents28.5 15.8
Owner/renter occupied households by race in Georgetown
House owners and renters - White residents 8,858 69.4% Owner occupied3,907 30.6% Renter occupiedHouse owners and renters - Black or African American residents 420 40.4% Owner occupied620 59.6% Renter occupiedHouse owners and renters - American Indian / Alaska Native residents 14 39.1% Owner occupied22 60.9% Renter occupiedHouse owners and renters - Asian residents 78 76.6% Owner occupied24 23.4% Renter occupiedHouse owners and renters - Other race residents 114 44.9% Owner occupied140 55.1% Renter occupiedHouse owners and renters - Two or more races residents 339 48.0% Owner occupied367 52.0% Renter occupiedHouse owners and renters - White alone residents 8,815 69.4% Owner occupied3,887 30.6% Renter occupiedHouse owners and renters - Hispanic or Latino residents 256 44.3% Owner occupied323 55.7% Renter occupied
Language usage in Georgetown
English speakers - Total 95.6% of residents of Georgetown speak English at home.
2.8% of residents speak Spanish at home 520 53.9% Speak English very well445 46.1% Speak English less than very well1.6% of residents speak other language at home 437 76.3% Speak English very well136 23.7% Speak English less than very well
English speakers - Born in the United States 98.1% of residents of Georgetown speak English at home.
1.4% of residents speak Spanish at home 137 100.0% Speak English very well0.4% of residents speak other language at home 22 64.7% Speak English very well12 35.3% Speak English less than very well
English speakers - Native, born elsewhere 66.9% of residents of Georgetown speak English at home.
19.7% of residents speak Spanish at home 30 56.6% Speak English very well23 43.4% Speak English less than very well15.6% of residents speak other language at home 42 100.0% Speak English less than very well
English speakers - Foreign-born 20.2% of residents of Georgetown speak English at home.
53.6% of residents speak Spanish at home 126 27.0% Speak English very well340 73.0% Speak English less than very well27.0% of residents speak other language at home 155 66.0% Speak English very well80 34.0% Speak English less than very well
White (Caucasian) - Speak only English Native:
99.0% (29,069)Foreign-born:
64.0% (58)
White (Caucasian) - Speak another language Native:
1.0% (303)Foreign-born:
44.6% (40)
Black or African American - Speak another language Native:
2.6% (51)Foreign-born:
97.0% (19)
Asian - Speak only English Native:
65.3% (87)Foreign-born:
17.1% (36)
Asian - Speak another language Native:
34.0% (45)Foreign-born:
82.8% (172)
Other race - Speak only English Native:
57.8% (257)Foreign-born:
19.5% (96)
Other race - Speak another language Native:
42.4% (188)Foreign-born:
81.6% (400)
Two or more races - Speak another language Native:
13.2% (320)Foreign-born:
98.8% (177)
White alone - Speak only English Native:
99.0% (28,963)Foreign-born:
60.1% (48)
White alone - Speak another language Native:
1.0% (293)Foreign-born:
42.1% (33)
Hispanic or Latino - Speak only English Native:
71.8% (852)Foreign-born:
14.4% (77)
Hispanic or Latino - Speak another language Native:
28.9% (343)Foreign-born:
85.3% (457)
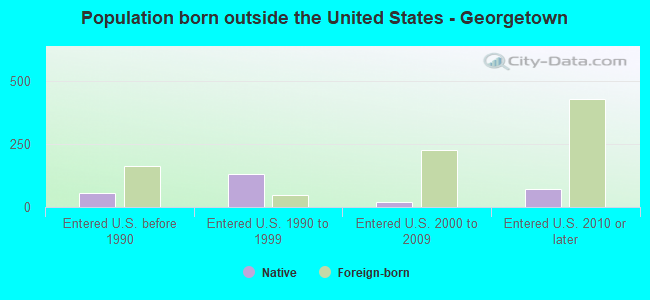
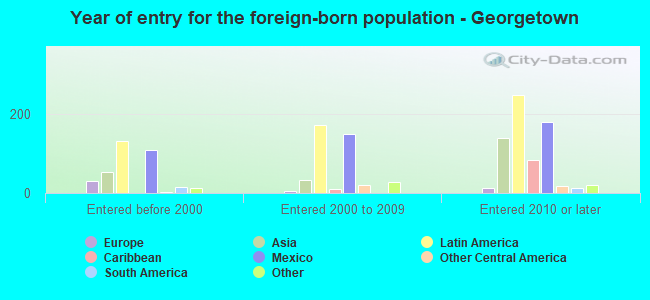
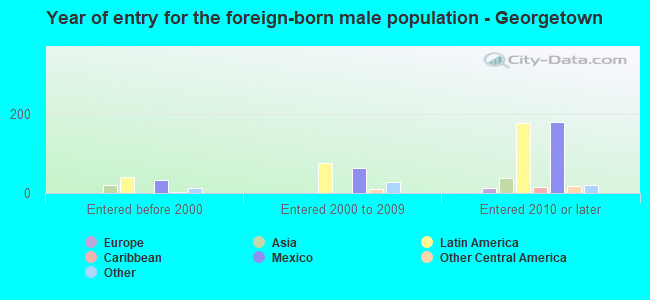
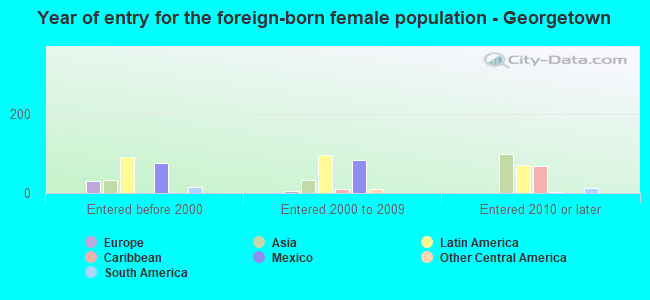
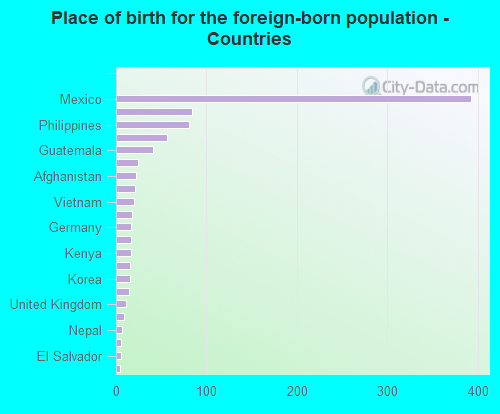
Foreign-born residents in Georgetown 903 residents are foreign born (1.4% Latin America , 0.6% Asia ).
This city:
2.4%Kentucky:
4.1%
Marital status for residents in Georgetown Marital status - White (Caucasian) population 15 years and over
Males 34.5% Never married52.2% Now married0.7% Separated2.5% Widowed10.1% DivorcedFemales 24.2% Never married48.7% Now married2.6% Separated8.6% Widowed15.9% DivorcedWomen who gave birth in the past 12 months Now married:
82.7% (332)Unmarried:
17.3% (69)
Women who did not give birth in the past 12 months Now married:
52.2% (4,094)Unmarried:
47.8% (3,748)
Marital status - Black or African American population 15 years and over
Males 33.2% Never married49.4% Now married6.3% Separated0.0% Widowed11.2% DivorcedFemales 42.8% Never married32.7% Now married0.6% Separated10.6% Widowed13.3% DivorcedWomen who gave birth in the past 12 months Now married:
20.0% (12)Unmarried:
80.0% (48)
Women who did not give birth in the past 12 months Now married:
40.9% (238)Unmarried:
59.1% (344)
Marital status - American Indian / Alaska Native population 15 years and over
Males 11.1% Never married11.1% Now married0.0% Separated0.0% Widowed77.8% DivorcedFemales 46.0% Never married54.0% Now married0.0% Separated0.0% Widowed0.0% DivorcedWomen who did not give birth in the past 12 months Now married:
56.2% (32)Unmarried:
43.7% (25)
Marital status - Asian population 15 years and over
Males 7.3% Never married92.7% Now married0.0% Separated0.0% Widowed0.0% DivorcedFemales 8.3% Never married73.9% Now married0.0% Separated11.5% Widowed6.4% DivorcedWomen who gave birth in the past 12 months Now married:
100.0% (10)Unmarried:
0.0% (0)
Women who did not give birth in the past 12 months Now married:
84.3% (67)Unmarried:
15.7% (13)
Marital status - Other race population 15 years and over
Males 50.2% Never married40.8% Now married0.0% Separated0.0% Widowed9.0% DivorcedFemales 24.5% Never married49.5% Now married0.0% Separated0.0% Widowed26.0% DivorcedWomen who gave birth in the past 12 months Now married:
68.0% (22)Unmarried:
32.0% (11)
Women who did not give birth in the past 12 months Now married:
50.0% (54)Unmarried:
50.0% (54)
Marital status - Two or more races population 15 years and over
Males 45.9% Never married39.6% Now married0.0% Separated3.4% Widowed11.1% DivorcedFemales 49.4% Never married37.0% Now married0.0% Separated0.9% Widowed12.7% DivorcedWomen who did not give birth in the past 12 months Now married:
28.3% (235)Unmarried:
71.7% (596)
Marital status - White alone, not Hispanic / Latino population 15 years and over
Males 34.5% Never married52.2% Now married0.7% Separated2.5% Widowed10.1% DivorcedFemales 23.8% Never married49.0% Now married2.6% Separated8.7% Widowed16.0% DivorcedWomen who gave birth in the past 12 months Now married:
89.5% (335)Unmarried:
10.5% (39)
Women who did not give birth in the past 12 months Now married:
52.4% (4,111)Unmarried:
47.6% (3,740)
Marital status - Hispanic or Latino population 15 years and over
Males 50.9% Never married39.6% Now married0.0% Separated0.0% Widowed9.5% DivorcedFemales 43.4% Never married36.8% Now married0.0% Separated0.0% Widowed19.7% DivorcedWomen who gave birth in the past 12 months Now married:
35.4% (18)Unmarried:
64.6% (34)
Women who did not give birth in the past 12 months Now married:
34.8% (177)Unmarried:
65.2% (331)
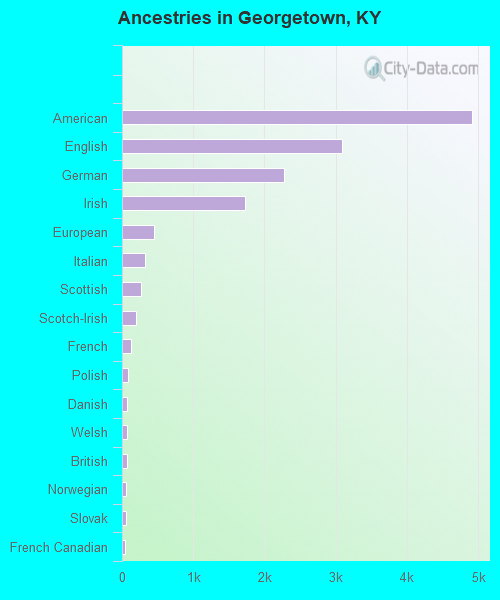
Ancestries in Georgetown
4,907 26.4% American3,086 16.6% English2,275 12.2% German1,726 9.3% Irish445 2.4% European317 1.7% Italian272 1.5% Scottish195 1.0% Scotch-Irish124 0.7% French86 0.5% Polish76 0.4% Danish71 0.4% Welsh68 0.4% British63 0.3% Norwegian52 0.3% Slovak46 0.2% French Canadian33 0.2% Scandinavian32 0.2% Swedish30 0.2% African25 0.1% Dutch21 0.1% Afghan21 0.1% Czech18 0.10% Lebanese16 0.09% Australian16 0.09% Canadian16 0.09% Portuguese14 0.08% Eastern European9 0.05% Greek7 0.04% Brazilian6 0.03% Iraqi
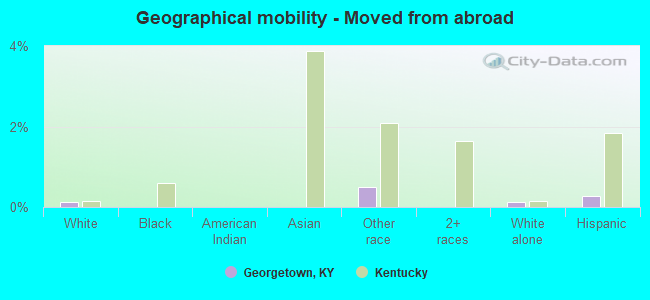
Geographical mobility in Georgetown Same house 1 year ago 25,435 82.0% White (Caucasian)1,882 89.3% Black or African American57 72.8% American Indian / Alaska Native329 95.1% Asian842 74.8% Other race2,009 68.3% Two or more races25,365 81.9% White alone, not Hispanic / Latino1,505 77.6% Hispanic or LatinoMoved within same county 2,725 8.8% White / Caucasian61 2.9% Black or African American23 30.1% American Indian / Alaska Native220 19.5% Other race567 19.3% Two or more races2,747 8.9% White alone, not Hispanic / Latino323 16.7% Hispanic or LatinoMoved within same state 1,894 6.1% White / Caucasian194 9.2% Black or African American13 3.6% Asian2 0.2% Other race150 5.1% Two or more races1,904 6.1% White alone, not Hispanic / Latino54 2.8% Hispanic or LatinoMoved from different state 752 2.4% White / Caucasian19 0.9% Black or African American5 0.5% Other race191 6.5% Two or more races766 2.5% White alone, not Hispanic / Latino5 0.2% Hispanic or LatinoMoved from abroad 35 0.1% White5 0.5% Other race37 0.1% White alone, not Hispanic / Latino5 0.3% Hispanic or Latino
Children Nativity (place of birth) in Georgetown
Children under 6 years - Living with two parents Both parents native 2,157 100.0% NativeBoth parents foreign-born 23 100.0% NativeOne native, one foreign-born parent 221 100.0% NativeChildren under 6 years - Living with one parent Native parent 614 100.0% NativeForeign-born parent 36 100.0% NativeChildren 6 to 17 years - Living with two parents Both parents native 3,626 99.8% Native7 0.2% Foreign-bornBoth parents foreign-born 89 100.0% NativeOne native, one foreign-born parent 146 100.0% NativeChildren 6 to 17 years - Living with one parent Native parent 1,742 100.0% NativeForeign-born parent 108 54.9% Native88 45.1% Foreign-born
Grandparents responsible for own grandchildren in Georgetown
Grandparents (30 to 59 years) White / Caucasian 259 63.0% Responsible for grandchildren152 37.0% Not responsible for grandchildrenBlack or African American 33 52.3% Responsible for grandchildren30 47.7% Not responsible for grandchildrenAsian 7 100.0% Responsible for grandchildrenOther race 14 100.0% Not responsible for grandchildrenTwo or more races 32 100.0% Responsible for grandchildrenWhite alone, not Hispanic / Latino 260 62.7% Responsible for grandchildren155 37.3% Not responsible for grandchildrenHispanic or Latino 12 61.2% Responsible for grandchildren7 38.8% Not responsible for grandchildrenGrandparents (60 years and over) White / Caucasian 55 34.3% Responsible for grandchildren104 65.7% Not responsible for grandchildrenTwo or more races 25 100.0% Not responsible for grandchildrenWhite alone, not Hispanic / Latino 55 34.1% Responsible for grandchildren106 65.9% Not responsible for grandchildren