Races in Gerber-Las Flores, California (CA) Detailed Stats
Ancestries, Foreign-born residents, place of birth

Discuss Gerber-Las Flores, California races on our local forum with over 2,400,000 registered users
25.8% of Gerber-Las Flores, CA residents are foreign-born (25.5% born in Latin America), which is about the same as the foreign-born rate of 26.0% across the entire state of California.
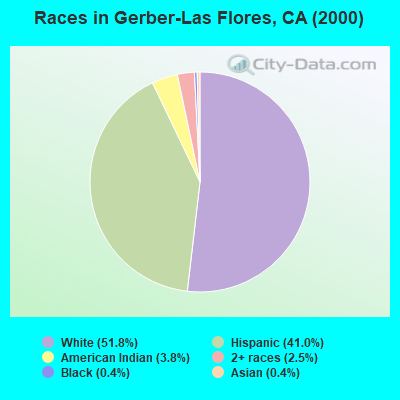
Race distribution in Gerber-Las Flores

- 72051.8%White alone
- 56941.0%Hispanic
- 533.8%American Indian alone
- 352.5%Two or more races
- 50.4%Asian alone
- 50.4%Black alone
- 10.07%Other race alone
- 10.07%Native Hawaiian and Other
Pacific Islander alone
2000
2022
-
- 15,816,79046.7%White alone
- 10,966,55632.4%Hispanic
- 3,648,86010.8%Asian alone
- 2,181,9266.4%Black alone
- 903,1152.7%Two or more races
- 178,9840.5%American Indian alone
- 103,7360.3%Native Hawaiian and Other
Pacific Islander alone - 71,6810.2%Other race alone

-
- 15,732,18440.3%Hispanic
- 13,160,42633.7%White alone
- 5,957,86715.3%Asian alone
- 2,025,2185.2%Black alone
- 1,663,2224.3%Two or more races
- 251,6180.6%Other race alone
- 135,7770.3%Native Hawaiian and Other
Pacific Islander alone - 103,0300.3%American Indian alone

Income and house value in Gerber-Las Flores
- Median household income in 2022
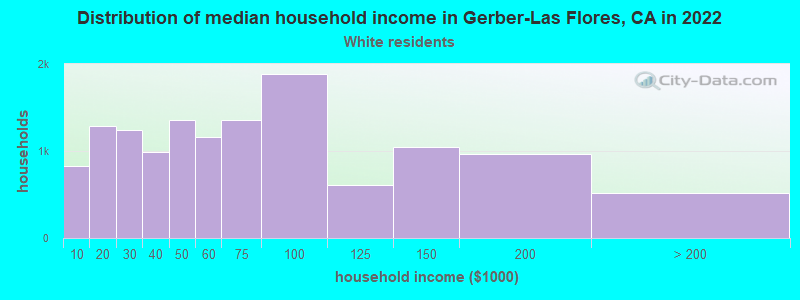
- $42,516White non-Hispanic householders
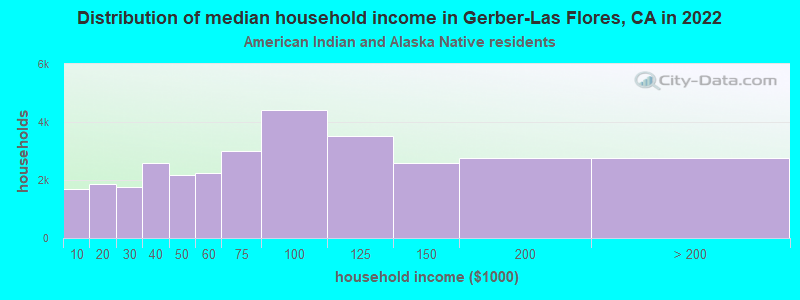
- $30,595American Indian and Alaska Native householders
- $56,804Some other race householders
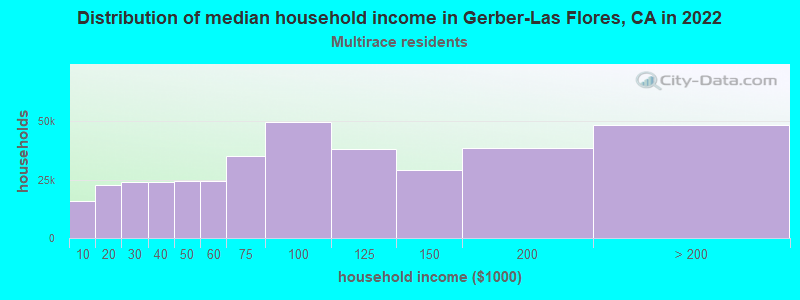
- $30,307Two or more races householders
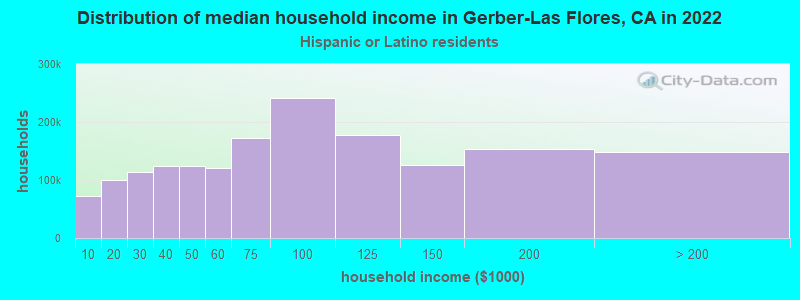
- $59,984Hispanic or Latino race householders
- Median 2022 house value
- $241,512White Non-Hispanic householders
- $207,679Some other race householders
- $305,940Two or more races householders
- $261,668Hispanic or Latino householders
Household income for White non-Hispanic householders
Household income for American Indian and Alaska Native householders
Household income for Two or more races householders
Household income for Hispanic or Latino race householders
Foreign-born residents in Gerber-Las Flores
359 residents are foreign born (25.5% Latin America).
| This city: | 25.8% |
| California: | 26.2% |
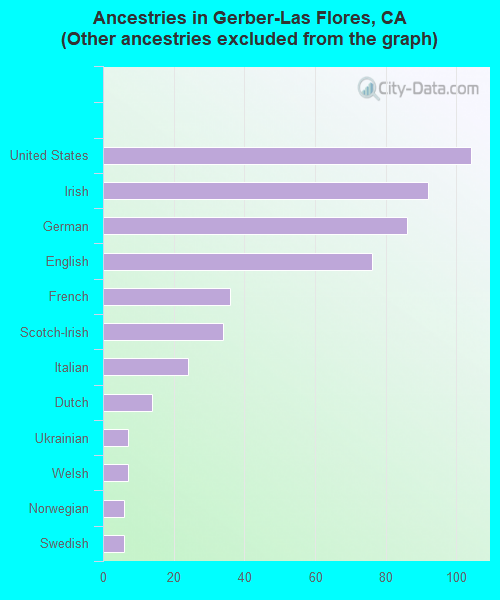
Ancestries in Gerber-Las Flores

- 78861.6%Other
- 1048.1%United States
- 927.2%Irish
- 866.7%German
- 765.9%English
- 362.8%French
- 342.7%Scotch-Irish
- 241.9%Italian
- 141.1%Dutch
- 70.5%Ukrainian
- 70.5%Welsh
- 60.5%Norwegian
- 60.5%Swedish
Zip codes: 96035.