Races in Glenmont, Maryland (MD) Detailed Stats
Data:
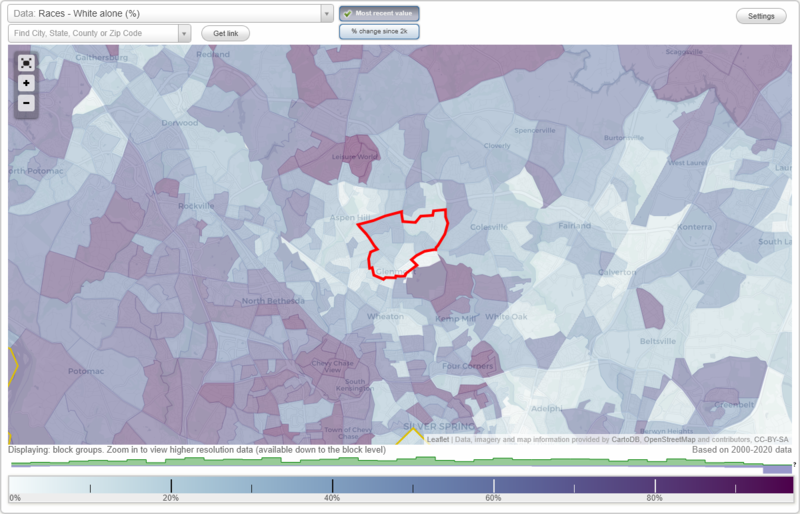
Races - White alone (%)
Races - White alone (% change since 2000)
Races - Black alone (%)
Races - Black alone (% change since 2000)
Races - American Indian alone (%)
Races - American Indian alone (% change since 2000)
Races - Asian alone (%)
Races - Asian alone (% change since 2000)
Races - Hispanic (%)
Races - Hispanic (% change since 2000)
Races - Native Hawaiian and Other Pacific Islander alone (%)
Races - Native Hawaiian and Other Pacific Islander alone (% change since 2000)
Races - Two or more races(%)
Races - Two or more races(% change since 2000)
Races - Other race alone (%)
Races - Other race alone (% change since 2000)
Racial diversity
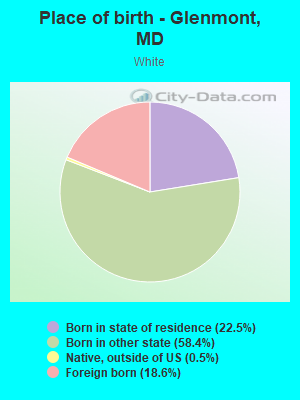
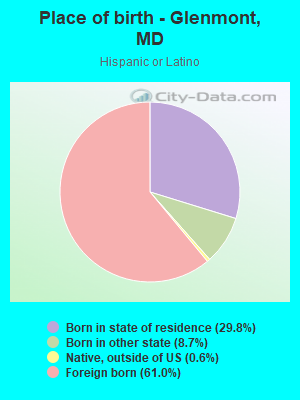
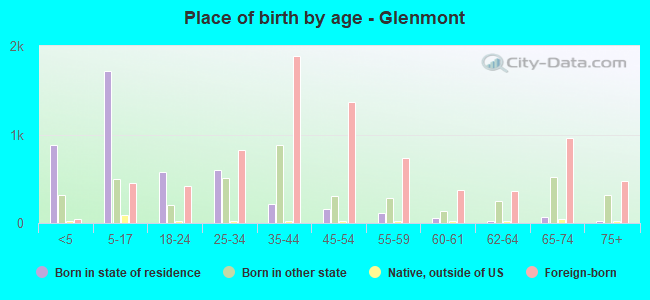
Place of birth - Born in state of residence (%)
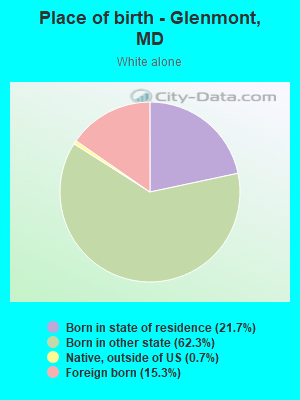
Place of birth - Born in state of residence (%) - White
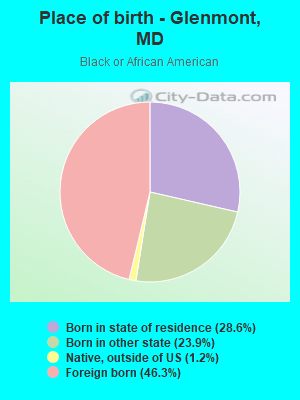
Place of birth - Born in state of residence (%) - Black or African American
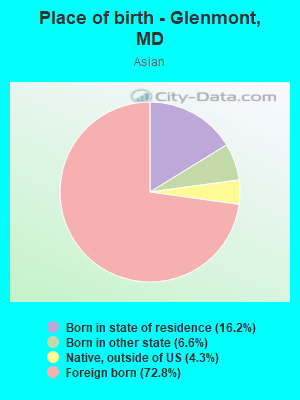
Place of birth - Born in state of residence (%) - Asian
Place of birth - Born in state of residence (%) - Hispanic or Latino
Place of birth - Born in state of residence (%) - American Indian and Alaska Native
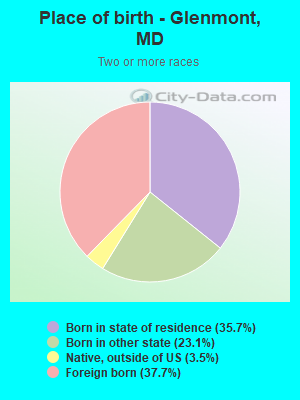
Place of birth - Born in state of residence (%) - Multirace
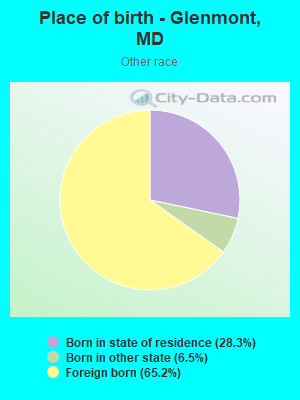
Place of birth - Born in state of residence (%) - Other Race
Place of birth - Born in other state (%)
Place of birth - Born in other state (%) - White
Place of birth - Born in other state (%) - Black or African American
Place of birth - Born in other state (%) - Asian
Place of birth - Born in other state (%) - Hispanic or Latino
Place of birth - Born in other state (%) - American Indian and Alaska Native
Place of birth - Born in other state (%) - Multirace
Place of birth - Born in other state (%) - Other Race
Place of birth - Native, outside of US (%)
Place of birth - Native, outside of US (%) - White
Place of birth - Native, outside of US (%) - Black or African American
Place of birth - Native, outside of US (%) - Asian
Place of birth - Native, outside of US (%) - Hispanic or Latino
Place of birth - Native, outside of US (%) - American Indian and Alaska Native
Place of birth - Native, outside of US (%) - Multirace
Place of birth - Native, outside of US (%) - Other Race
Place of birth - Foreign born (%)
Place of birth - Foreign born (%) - White
Place of birth - Foreign born (%) - Black or African American
Place of birth - Foreign born (%) - Asian
Place of birth - Foreign born (%) - Hispanic or Latino
Place of birth - Foreign born (%) - American Indian and Alaska Native
Place of birth - Foreign born (%) - Multirace
Place of birth - Foreign born (%) - Other Race
Residents speaking English at home (%)
Residents speaking English at home - Born in the United States (%)
Residents speaking English at home - Native, born elsewhere (%)
Residents speaking English at home - Foreign born (%)
Residents speaking Spanish at home (%)
Residents speaking Spanish at home - Born in the United States (%)
Residents speaking Spanish at home - Native, born elsewhere (%)
Residents speaking Spanish at home - Foreign born (%)
Residents speaking other language at home (%)
Residents speaking other language at home - Born in the United States (%)
Residents speaking other language at home - Native, born elsewhere (%)
Residents speaking other language at home - Foreign born (%)
Marital status - Never married (%)
Marital status - Now married (%)
Marital status - Separated (%)
Marital status - Widowed (%)
Marital status - Divorced (%)
Ancestries Reported - Arab (%)
Ancestries Reported - Czech (%)
Ancestries Reported - Danish (%)
Ancestries Reported - Dutch (%)
Ancestries Reported - English (%)
Ancestries Reported - French (%)
Ancestries Reported - French Canadian (%)
Ancestries Reported - German (%)
Ancestries Reported - Greek (%)
Ancestries Reported - Hungarian (%)
Ancestries Reported - Irish (%)
Ancestries Reported - Italian (%)
Ancestries Reported - Lithuanian (%)
Ancestries Reported - Norwegian (%)
Ancestries Reported - Polish (%)
Ancestries Reported - Portuguese (%)
Ancestries Reported - Russian (%)
Ancestries Reported - Scotch-Irish (%)
Ancestries Reported - Scottish (%)
Ancestries Reported - Slovak (%)
Ancestries Reported - Subsaharan African (%)
Ancestries Reported - Swedish (%)
Ancestries Reported - Swiss (%)
Ancestries Reported - Ukrainian (%)
Ancestries Reported - United States (%)
Ancestries Reported - Welsh (%)
Ancestries Reported - West Indian (%)
Ancestries Reported - Other (%)
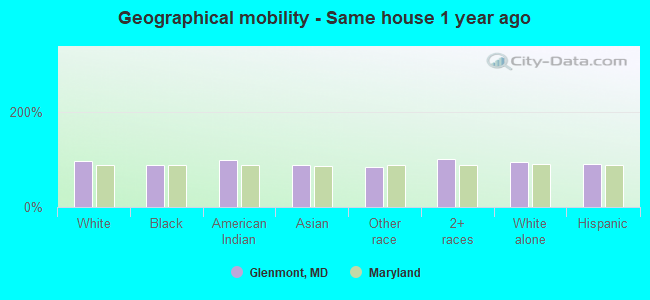
Geographical mobility - Same house 1 year ago (%)
Geographical mobility - Same house 1 year ago (%) - White
Geographical mobility - Same house 1 year ago (%) - Black or African American
Geographical mobility - Same house 1 year ago (%) - Asian
Geographical mobility - Same house 1 year ago (%) - Hispanic or Latino
Geographical mobility - Same house 1 year ago (%) - American Indian and Alaska Native
Geographical mobility - Same house 1 year ago (%) - Multirace
Geographical mobility - Same house 1 year ago (%) - Other Race
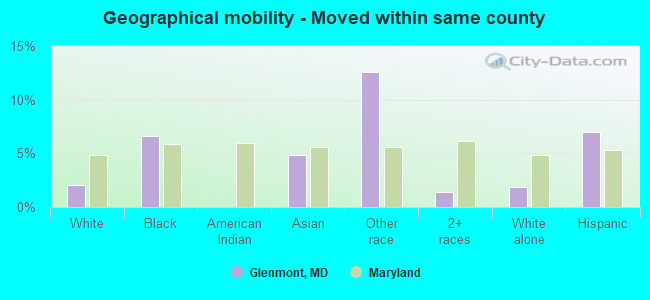
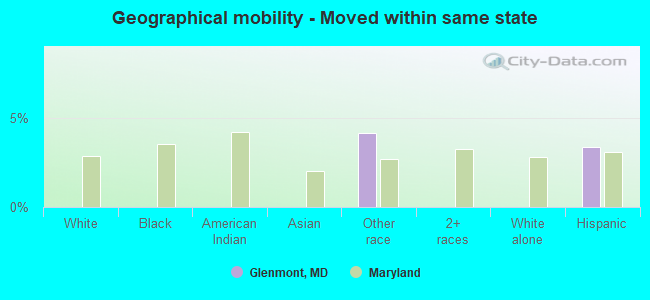
Geographical mobility - Moved within same county (%)
Geographical mobility - Moved within same county (%) - White
Geographical mobility - Moved within same county (%) - Black or African American
Geographical mobility - Moved within same county (%) - Asian
Geographical mobility - Moved within same county (%) - Hispanic or Latino
Geographical mobility - Moved within same county (%) - American Indian and Alaska Native
Geographical mobility - Moved within same county (%) - Multirace
Geographical mobility - Moved within same county (%) - Other Race
Geographical mobility - Moved from different county within same state (%)
Geographical mobility - Moved from different county within same state (%) - White
Geographical mobility - Moved from different county within same state (%) - Black or African American
Geographical mobility - Moved from different county within same state (%) - Asian
Geographical mobility - Moved from different county within same state (%) - Hispanic or Latino
Geographical mobility - Moved from different county within same state (%) - American Indian and Alaska Native
Geographical mobility - Moved from different county within same state (%) - Multirace
Geographical mobility - Moved from different county within same state (%) - Other Race
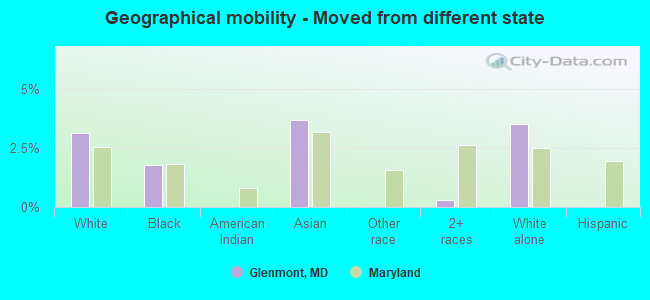
Geographical mobility - Moved from different state (%)
Geographical mobility - Moved from different state (%) - White
Geographical mobility - Moved from different state (%) - Black or African American
Geographical mobility - Moved from different state (%) - Asian
Geographical mobility - Moved from different state (%) - Hispanic or Latino
Geographical mobility - Moved from different state (%) - American Indian and Alaska Native
Geographical mobility - Moved from different state (%) - Multirace
Geographical mobility - Moved from different state (%) - Other Race
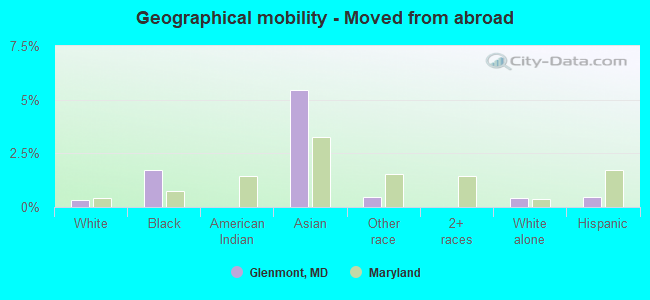
Geographical mobility - Moved from abroad (%)
Geographical mobility - Moved from abroad (%) - White
Geographical mobility - Moved from abroad (%) - Black or African American
Geographical mobility - Moved from abroad (%) - Asian
Geographical mobility - Moved from abroad (%) - Hispanic or Latino
Geographical mobility - Moved from abroad (%) - American Indian and Alaska Native
Geographical mobility - Moved from abroad (%) - Multirace
Geographical mobility - Moved from abroad (%) - Other Race
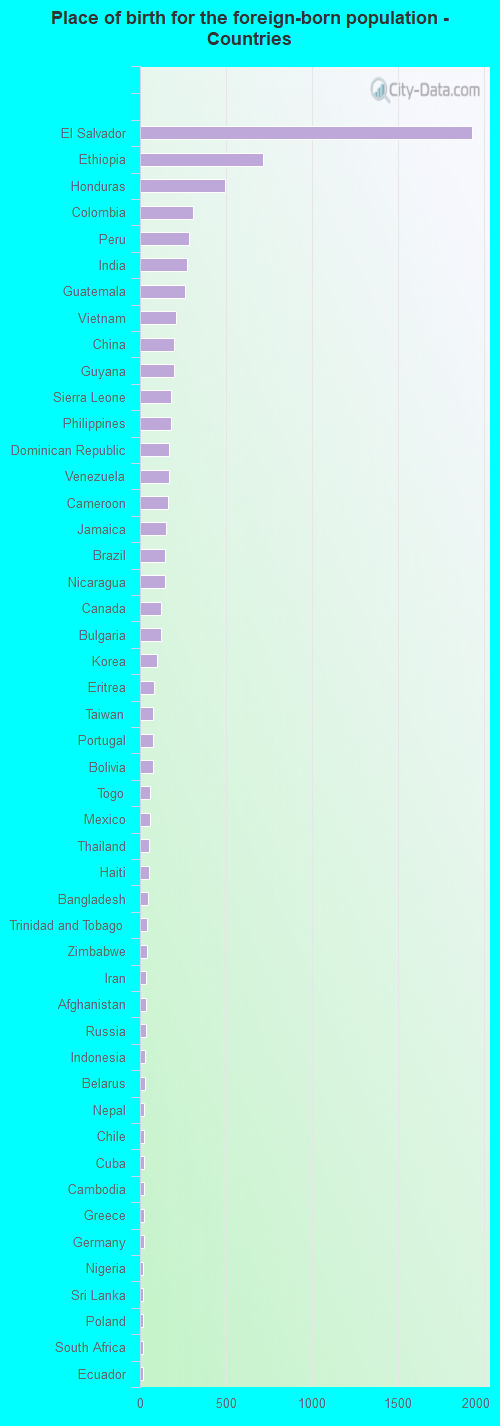
Place of birth for the foreign-born population - Ireland (%)
Place of birth for the foreign-born population - Denmark (%)
Place of birth for the foreign-born population - Norway (%)
Place of birth for the foreign-born population - Sweden (%)
Place of birth for the foreign-born population - United Kingdom (%)
Place of birth for the foreign-born population - England (%)
Place of birth for the foreign-born population - Scotland (%)
Place of birth for the foreign-born population - Other Northern Europe (%)
Place of birth for the foreign-born population - Austria (%)
Place of birth for the foreign-born population - Belgium (%)
Place of birth for the foreign-born population - France (%)
Place of birth for the foreign-born population - Germany (%)
Place of birth for the foreign-born population - Netherlands (%)
Place of birth for the foreign-born population - Switzerland (%)
Place of birth for the foreign-born population - Other Western Europe (%)
Place of birth for the foreign-born population - Greece (%)
Place of birth for the foreign-born population - Italy (%)
Place of birth for the foreign-born population - Portugal (%)
Place of birth for the foreign-born population - Spain (%)
Place of birth for the foreign-born population - Other Southern Europe (%)
Place of birth for the foreign-born population - Albania (%)
Place of birth for the foreign-born population - Belarus (%)
Place of birth for the foreign-born population - Bosnia and Herzegovina (%)
Place of birth for the foreign-born population - Bulgaria (%)
Place of birth for the foreign-born population - Croatia (%)
Place of birth for the foreign-born population - Czechoslovakia (%)
Place of birth for the foreign-born population - Hungary (%)
Place of birth for the foreign-born population - Latvia (%)
Place of birth for the foreign-born population - Lithuania (%)
Place of birth for the foreign-born population - North Macedonia (Macedonia) (%)
Place of birth for the foreign-born population - Moldova (%)
Place of birth for the foreign-born population - Poland (%)
Place of birth for the foreign-born population - Romania (%)
Place of birth for the foreign-born population - Russia (%)
Place of birth for the foreign-born population - Serbia (%)
Place of birth for the foreign-born population - Ukraine (%)
Place of birth for the foreign-born population - Other Eastern Europe (%)
Place of birth for the foreign-born population - China (%)
Place of birth for the foreign-born population - Hong Kong (%)
Place of birth for the foreign-born population - Taiwan (%)
Place of birth for the foreign-born population - Japan (%)
Place of birth for the foreign-born population - Korea (%)
Place of birth for the foreign-born population - Other Eastern Asia (%)
Place of birth for the foreign-born population - Afghanistan (%)
Place of birth for the foreign-born population - Bangladesh (%)
Place of birth for the foreign-born population - India (%)
Place of birth for the foreign-born population - Iran (%)
Place of birth for the foreign-born population - Kazakhstan (%)
Place of birth for the foreign-born population - Nepal (%)
Place of birth for the foreign-born population - Pakistan (%)
Place of birth for the foreign-born population - Sri Lanka (%)
Place of birth for the foreign-born population - Uzbekistan (%)
Place of birth for the foreign-born population - Other South Central Asia (%)
Place of birth for the foreign-born population - Burma (%)
Place of birth for the foreign-born population - Cambodia (%)
Place of birth for the foreign-born population - Indonesia (%)
Place of birth for the foreign-born population - Laos (%)
Place of birth for the foreign-born population - Malaysia (%)
Place of birth for the foreign-born population - Philippines (%)
Place of birth for the foreign-born population - Singapore (%)
Place of birth for the foreign-born population - Thailand (%)
Place of birth for the foreign-born population - Vietnam (%)
Place of birth for the foreign-born population - Other South Eastern Asia (%)
Place of birth for the foreign-born population - Armenia (%)
Place of birth for the foreign-born population - Iraq (%)
Place of birth for the foreign-born population - Israel (%)
Place of birth for the foreign-born population - Jordan (%)
Place of birth for the foreign-born population - Kuwait (%)
Place of birth for the foreign-born population - Lebanon (%)
Place of birth for the foreign-born population - Saudi Arabia (%)
Place of birth for the foreign-born population - Syria (%)
Place of birth for the foreign-born population - Turkey (%)
Place of birth for the foreign-born population - Yemen (%)
Place of birth for the foreign-born population - Other Western Asia (%)
Place of birth for the foreign-born population - Eritrea (%)
Place of birth for the foreign-born population - Ethiopia (%)
Place of birth for the foreign-born population - Kenya (%)
Place of birth for the foreign-born population - Somalia (%)
Place of birth for the foreign-born population - Uganda (%)
Place of birth for the foreign-born population - Zimbabwe (%)
Place of birth for the foreign-born population - Other Eastern Africa (%)
Place of birth for the foreign-born population - Cameroon (%)
Place of birth for the foreign-born population - Congo (%)
Place of birth for the foreign-born population - Democratic Republic of Congo (Zaire) (%)
Place of birth for the foreign-born population - Other Middle Africa (%)
Place of birth for the foreign-born population - Egypt (%)
Place of birth for the foreign-born population - Morocco (%)
Place of birth for the foreign-born population - Sudan (%)
Place of birth for the foreign-born population - Other Northern Africa (%)
Place of birth for the foreign-born population - South Africa (%)
Place of birth for the foreign-born population - Other Southern Africa (%)
Place of birth for the foreign-born population - Cabo Verde (%)
Place of birth for the foreign-born population - Ghana (%)
Place of birth for the foreign-born population - Liberia (%)
Place of birth for the foreign-born population - Nigeria (%)
Place of birth for the foreign-born population - Senegal (%)
Place of birth for the foreign-born population - Sierra Leone (%)
Place of birth for the foreign-born population - Other Western Africa (%)
Place of birth for the foreign-born population - Australia (%)
Place of birth for the foreign-born population - New Zealand (%)
Place of birth for the foreign-born population - Fiji (%)
Place of birth for the foreign-born population - Micronesia (%)
Place of birth for the foreign-born population - Bahamas (%)
Place of birth for the foreign-born population - Barbados (%)
Place of birth for the foreign-born population - Cuba (%)
Place of birth for the foreign-born population - Dominica (%)
Place of birth for the foreign-born population - Dominican Republic (%)
Place of birth for the foreign-born population - Grenada (%)
Place of birth for the foreign-born population - Haiti (%)
Place of birth for the foreign-born population - Jamaica (%)
Place of birth for the foreign-born population - St. Vincent and the Grenadines (%)
Place of birth for the foreign-born population - Trinidad and Tobago (%)
Place of birth for the foreign-born population - West Indies (%)
Place of birth for the foreign-born population - Other Caribbean (%)
Place of birth for the foreign-born population - Belize (%)
Place of birth for the foreign-born population - Costa Rica (%)
Place of birth for the foreign-born population - El Salvador (%)
Place of birth for the foreign-born population - Guatemala (%)
Place of birth for the foreign-born population - Honduras (%)
Place of birth for the foreign-born population - Mexico (%)
Place of birth for the foreign-born population - Nicaragua (%)
Place of birth for the foreign-born population - Panama (%)
Place of birth for the foreign-born population - Other Central America (%)
Place of birth for the foreign-born population - Argentina (%)
Place of birth for the foreign-born population - Bolivia (%)
Place of birth for the foreign-born population - Brazil (%)
Place of birth for the foreign-born population - Chile (%)
Place of birth for the foreign-born population - Colombia (%)
Place of birth for the foreign-born population - Ecuador (%)
Place of birth for the foreign-born population - Guyana (%)
Place of birth for the foreign-born population - Peru (%)
Place of birth for the foreign-born population - Uruguay (%)
Place of birth for the foreign-born population - Venezuela (%)
Place of birth for the foreign-born population - Other South America (%)
Place of birth for the foreign-born population - Canada (%)
Place of birth for the foreign-born population - Other Northern America (%)
Place of birth for the foreign-born population - Other (%)
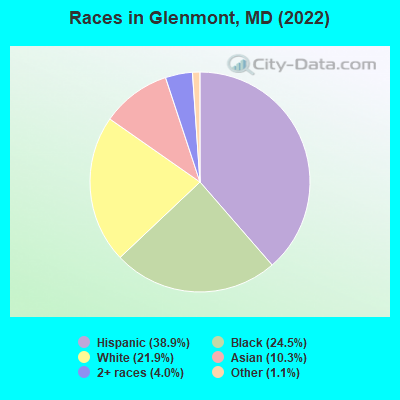
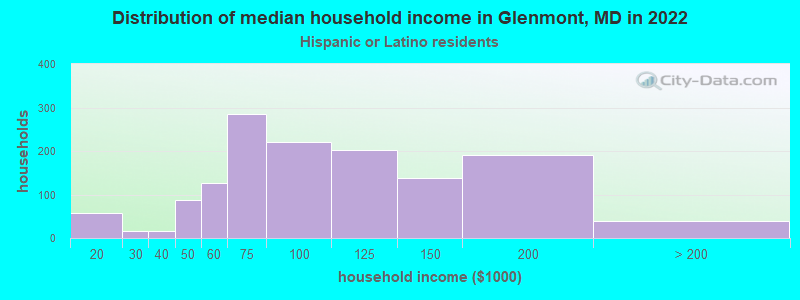
According to 2022 data, the most numerous races in Glenmont, MD are White alone (3,620 residents), Black alone (4,063 residents), and Hispanic (6,443 residents). 38.7% of Glenmont residents speak English at home.
Race distribution in Glenmont 6,443 38.9% Hispanic 4,063 24.5% Black alone 3,620 21.9% White alone 1,701 10.3% Asian alone 668 4.0% Two or more races 190 1.1% Other race alone
2000 2022
3,286,547 62.1% White alone 1,464,735 27.7% Black alone 227,916 4.3% Hispanic 209,738 4.0% Asian alone 82,946 1.6% Two or more races 13,312 0.3% American Indian alone 9,379 0.2% Other race alone 1,913 0.04% Native Hawaiian and Other
2,906,492 47.1% White alone 1,800,914 29.2% Black alone 705,842 11.4% Hispanic 401,818 6.5% Asian alone 291,317 4.7% Two or more races 46,930 0.8% Other race alone 8,930 0.1% American Indian alone 2,417 0.04% Native Hawaiian and Other
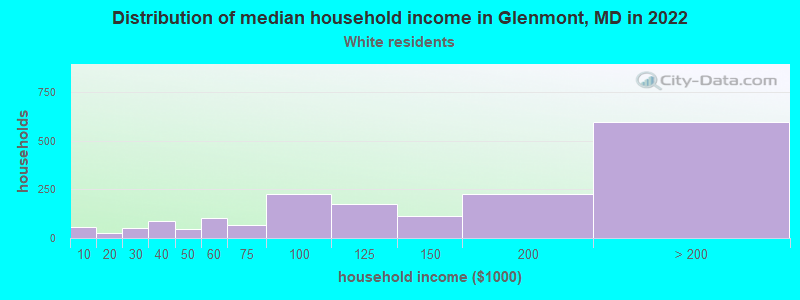
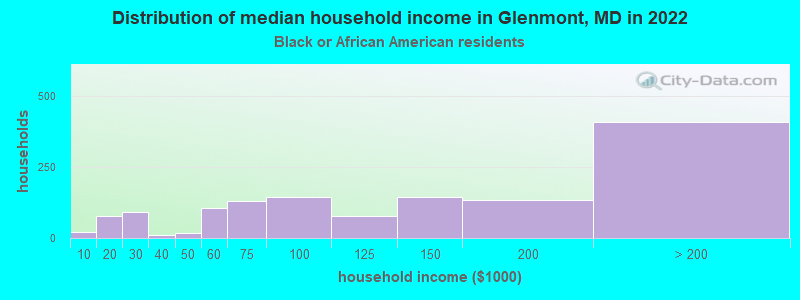
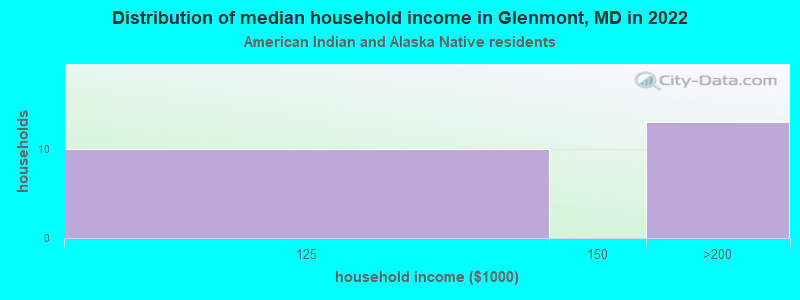
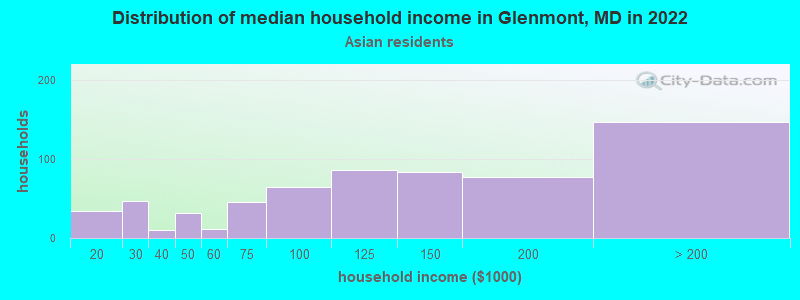
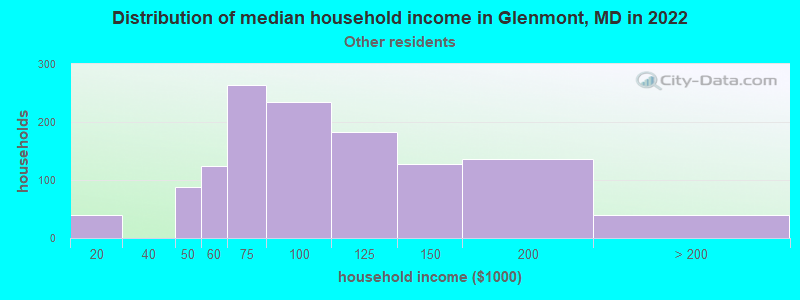
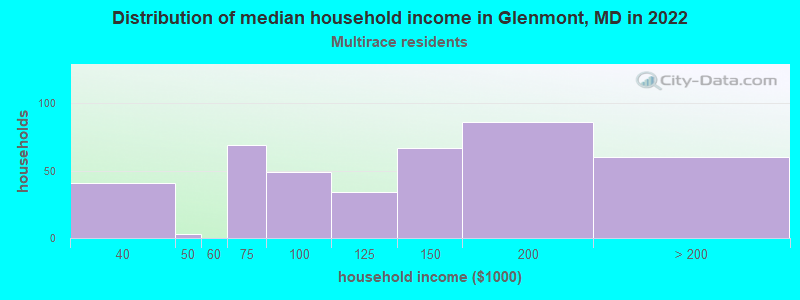
Income and house value in Glenmont Median household income in 2022 $140,548 White non-Hispanic householders$127,664 Black householders$122,836 Asian householders$82,485 Some other race householders$127,015 Two or more races householders$84,347 Hispanic or Latino race householders
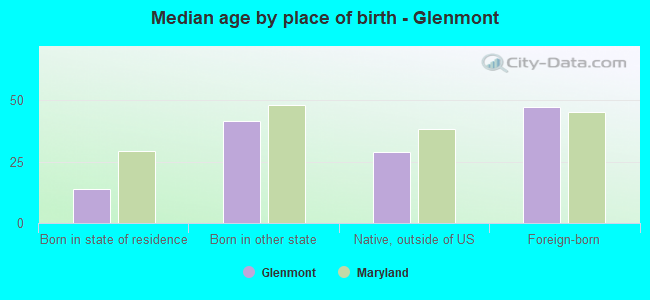
Median age by race in Glenmont
47.4 Median age for White residents47.4 46.4 39.1 Median age for Black or African American residents36.6 40.4 36.2 Median age for American Indian / Alaska Native residents-555,555,555.0 -671,704,449.4 49.6 Median age for Asian residents49.7 49.2 -763,333,332.6 Median age for Native Hawaiian / Pacific Islander residents-720,061,021.4 -760,942,760.2 28.6 Median age for Other race residents33.3 24.4 34.6 Median age for Two or more races residents29.6 42.6 46.3 Median age for White alone residents47.1 44.8 31.7 Median age for Hispanic or Latino residents32.5 27.3
Owner/renter occupied households by race in Glenmont
House owners and renters - White residents 1,336 75.1% Owner occupied444 24.9% Renter occupiedHouse owners and renters - Black or African American residents 829 60.9% Owner occupied532 39.1% Renter occupiedHouse owners and renters - American Indian / Alaska Native residents 8 46.7% Owner occupied9 53.3% Renter occupiedHouse owners and renters - Asian residents 553 85.9% Owner occupied91 14.1% Renter occupiedHouse owners and renters - Other race residents 604 48.0% Owner occupied654 52.0% Renter occupiedHouse owners and renters - Two or more races residents 346 86.3% Owner occupied55 13.7% Renter occupiedHouse owners and renters - White alone residents 1,252 74.3% Owner occupied434 25.7% Renter occupiedHouse owners and renters - Hispanic or Latino residents 785 54.5% Owner occupied654 45.5% Renter occupied
Language usage in Glenmont
English speakers - Total 38.7% of residents of Glenmont speak English at home.
37.5% of residents speak Spanish at home 3,211 55.9% Speak English very well2,533 44.1% Speak English less than very well24.2% of residents speak other language at home 2,675 72.3% Speak English very well1,024 27.7% Speak English less than very well
English speakers - Born in the United States 81.0% of residents of Glenmont speak English at home.
13.4% of residents speak Spanish at home 471 90.9% Speak English very well47 9.1% Speak English less than very well5.2% of residents speak other language at home 133 66.5% Speak English very well67 33.5% Speak English less than very well
English speakers - Native, born elsewhere 72.2% of residents of Glenmont speak English at home.
24.7% of residents speak other language at home 43 87.8% Speak English very well6 12.2% Speak English less than very well
English speakers - Foreign-born 10.3% of residents of Glenmont speak English at home.
49.5% of residents speak Spanish at home 1,573 40.4% Speak English very well2,320 59.6% Speak English less than very well40.1% of residents speak other language at home 2,247 71.3% Speak English very well904 28.7% Speak English less than very well
White (Caucasian) - Speak only English Native:
89.8% (2,536)Foreign-born:
20.2% (147)
White (Caucasian) - Speak another language Native:
9.4% (266)Foreign-born:
79.5% (581)
Black or African American - Speak only English Native:
89.2% (1,765)Foreign-born:
19.0% (357)
Black or African American - Speak another language Native:
10.6% (210)Foreign-born:
81.6% (1,531)
Asian - Speak only English Native:
46.8% (196)Foreign-born:
7.7% (97)
Asian - Speak another language Native:
53.2% (222)Foreign-born:
92.0% (1,161)
Other race - Speak only English Native:
4.1% (62)Foreign-born:
3.3% (124)
Other race - Speak another language Native:
90.7% (1,381)Foreign-born:
96.9% (3,617)
Two or more races - Speak only English Native:
55.3% (587)Foreign-born:
8.3% (65)
Two or more races - Speak another language Native:
46.9% (498)Foreign-born:
91.4% (713)
White alone - Speak only English Native:
90.7% (2,490)Foreign-born:
25.7% (144)
White alone - Speak another language Native:
9.0% (248)Foreign-born:
74.0% (413)
Hispanic or Latino - Speak only English Native:
18.9% (384)Foreign-born:
2.8% (111)
Hispanic or Latino - Speak another language Native:
79.9% (1,626)Foreign-born:
97.3% (3,824)
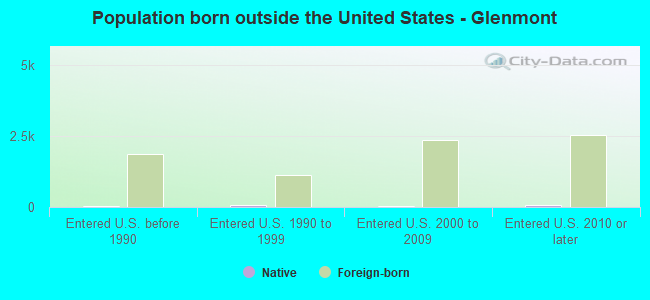
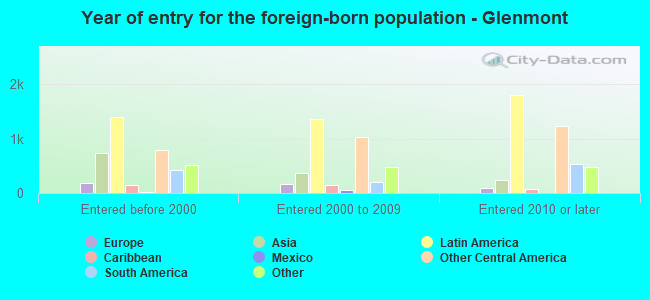
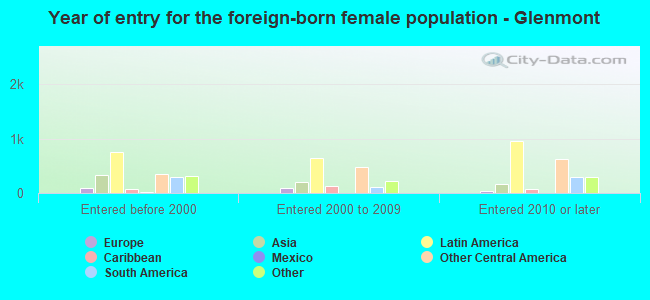
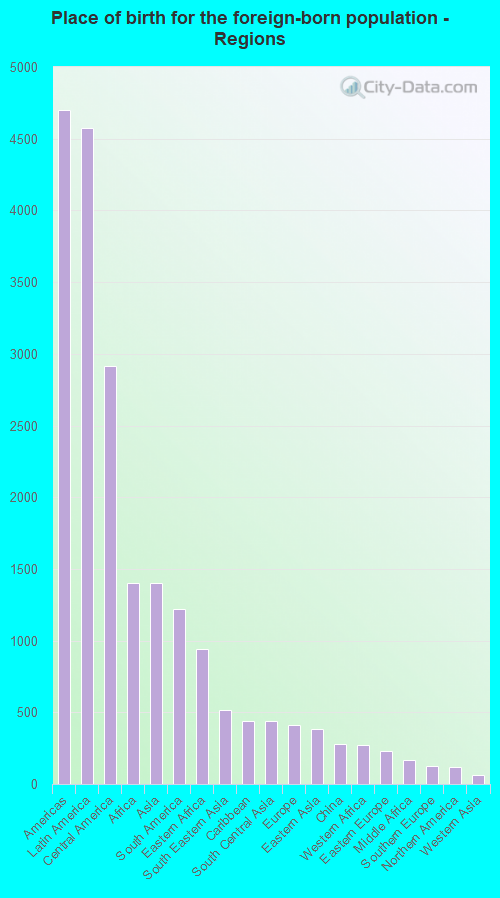
Foreign-born residents in Glenmont
Marital status for residents in Glenmont Marital status - White (Caucasian) population 15 years and over
Males 32.5% Never married56.0% Now married0.8% Separated2.4% Widowed8.3% DivorcedFemales 19.7% Never married64.9% Now married0.4% Separated7.8% Widowed7.2% DivorcedWomen who gave birth in the past 12 months Now married:
81.5% (65)Unmarried:
18.5% (15)
Women who did not give birth in the past 12 months Now married:
66.3% (383)Unmarried:
33.7% (195)
Marital status - Black or African American population 15 years and over
Males 41.1% Never married48.4% Now married1.9% Separated2.8% Widowed5.8% DivorcedFemales 39.1% Never married38.3% Now married1.4% Separated9.1% Widowed12.1% DivorcedWomen who gave birth in the past 12 months Now married:
100.0% (35)Unmarried:
0.0% (0)
Women who did not give birth in the past 12 months Now married:
30.3% (294)Unmarried:
69.7% (677)
Marital status - American Indian / Alaska Native population 15 years and over
Males 50.0% Never married50.0% Now married0.0% Separated0.0% Widowed0.0% DivorcedFemales 0.0% Never married0.0% Now married0.0% Separated0.0% Widowed100.0% DivorcedWomen who did not give birth in the past 12 months Now married:
0.0% (0)Unmarried:
100.0% (13)
Marital status - Asian population 15 years and over
Males 23.7% Never married66.5% Now married1.8% Separated2.6% Widowed5.4% DivorcedFemales 20.4% Never married62.2% Now married1.3% Separated5.5% Widowed10.5% DivorcedWomen who gave birth in the past 12 months Now married:
100.0% (20)Unmarried:
0.0% (0)
Women who did not give birth in the past 12 months Now married:
57.5% (222)Unmarried:
42.5% (164)
Marital status - Other race population 15 years and over
Males 44.4% Never married41.5% Now married4.1% Separated0.0% Widowed10.0% DivorcedFemales 43.8% Never married39.6% Now married0.1% Separated3.7% Widowed12.9% DivorcedWomen who gave birth in the past 12 months Now married:
58.2% (48)Unmarried:
41.8% (34)
Women who did not give birth in the past 12 months Now married:
36.0% (605)Unmarried:
64.0% (1,077)
Marital status - Two or more races population 15 years and over
Males 40.6% Never married55.2% Now married0.0% Separated1.9% Widowed2.3% DivorcedFemales 40.0% Never married43.5% Now married0.0% Separated5.6% Widowed10.9% DivorcedWomen who gave birth in the past 12 months Now married:
100.0% (12)Unmarried:
0.0% (0)
Women who did not give birth in the past 12 months Now married:
45.5% (117)Unmarried:
54.5% (140)
Marital status - White alone, not Hispanic / Latino population 15 years and over
Males 31.8% Never married57.5% Now married0.0% Separated2.1% Widowed8.7% DivorcedFemales 15.3% Never married70.7% Now married0.5% Separated7.2% Widowed6.3% DivorcedWomen who gave birth in the past 12 months Now married:
100.0% (71)Unmarried:
0.0% (0)
Women who did not give birth in the past 12 months Now married:
74.6% (403)Unmarried:
25.4% (137)
Marital status - Hispanic or Latino population 15 years and over
Males 43.1% Never married43.4% Now married3.8% Separated1.0% Widowed8.7% DivorcedFemales 44.1% Never married38.6% Now married0.0% Separated5.2% Widowed12.1% DivorcedWomen who gave birth in the past 12 months Now married:
52.1% (49)Unmarried:
47.9% (45)
Women who did not give birth in the past 12 months Now married:
33.8% (530)Unmarried:
66.2% (1,040)
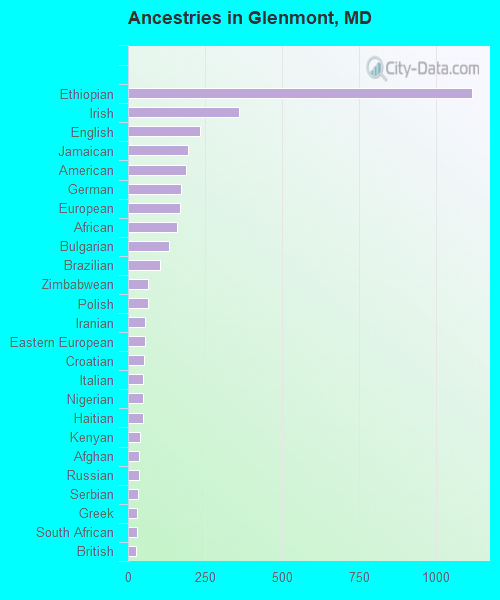
Ancestries in Glenmont
1,117 9.4% Ethiopian361 3.0% Irish234 2.0% English194 1.6% Jamaican187 1.6% American171 1.4% German168 1.4% European160 1.3% African133 1.1% Bulgarian104 0.9% Brazilian66 0.6% Zimbabwean65 0.5% Polish56 0.5% Iranian55 0.5% Eastern European51 0.4% Croatian50 0.4% Italian50 0.4% Nigerian48 0.4% Haitian40 0.3% Kenyan37 0.3% Afghan37 0.3% Russian32 0.3% Serbian30 0.3% Greek30 0.3% South African27 0.2% British21 0.2% Guyanese19 0.2% Hungarian18 0.2% Norwegian18 0.2% Trinidadian and Tobagonian13 0.1% Palestinian12 0.1% Portuguese12 0.1% Austrian11 0.09% Cape Verdean11 0.09% Lebanese9 0.08% Romanian9 0.08% West Indian8 0.07% Danish5 0.04% Scotch-Irish
Geographical mobility in Glenmont Same house 1 year ago 3,707 95.5% White (Caucasian)3,572 88.6% Black or African American30 98.9% American Indian / Alaska Native1,494 87.1% Asian4,678 83.1% Other race1,921 100.0% Two or more races3,413 95.0% White alone, not Hispanic / Latino5,677 89.8% Hispanic or LatinoMoved within same county 79 2.0% White / Caucasian266 6.6% Black or African American83 4.8% Asian707 12.6% Other race26 1.4% Two or more races66 1.8% White alone, not Hispanic / Latino440 7.0% Hispanic or LatinoMoved within same state 233 4.1% Other race212 3.3% Hispanic or LatinoMoved from different state 120 3.1% White / Caucasian72 1.8% Black or African American63 3.7% Asian5 0.3% Two or more races126 3.5% White alone, not Hispanic / LatinoMoved from abroad 13 0.3% White70 1.7% Black or African American93 5.4% Asian26 0.5% Other race16 0.4% White alone, not Hispanic / Latino30 0.5% Hispanic or Latino
Children Nativity (place of birth) in Glenmont
Children under 6 years - Living with two parents Both parents native 353 99.7% Native1 0.3% Foreign-bornBoth parents foreign-born 409 95.0% Native22 5.0% Foreign-bornOne native, one foreign-born parent 327 96.5% Native12 3.5% Foreign-bornChildren under 6 years - Living with one parent Native parent 41 100.0% NativeForeign-born parent 268 93.8% Native18 6.2% Foreign-bornChildren 6 to 17 years - Living with two parents Both parents native 219 100.0% NativeBoth parents foreign-born 523 78.9% Native140 21.1% Foreign-bornOne native, one foreign-born parent 259 87.9% Native36 12.1% Foreign-bornChildren 6 to 17 years - Living with one parent Foreign-born parent 1,127 55.7% Native898 44.3% Foreign-born
Grandparents responsible for own grandchildren in Glenmont
Grandparents (30 to 59 years) White / Caucasian 13 100.0% Not responsible for grandchildrenBlack or African American 27 100.0% Responsible for grandchildrenOther race 30 21.9% Responsible for grandchildren106 78.1% Not responsible for grandchildrenHispanic or Latino 51 32.5% Responsible for grandchildren106 67.5% Not responsible for grandchildrenGrandparents (60 years and over) White / Caucasian 17 38.9% Responsible for grandchildren27 61.1% Not responsible for grandchildrenBlack or African American 25 100.0% Responsible for grandchildrenOther race 18 11.9% Responsible for grandchildren130 88.1% Not responsible for grandchildrenHispanic or Latino 44 20.8% Responsible for grandchildren167 79.2% Not responsible for grandchildren