Races in Glenvar Heights, Florida (FL) Detailed Stats
Data:
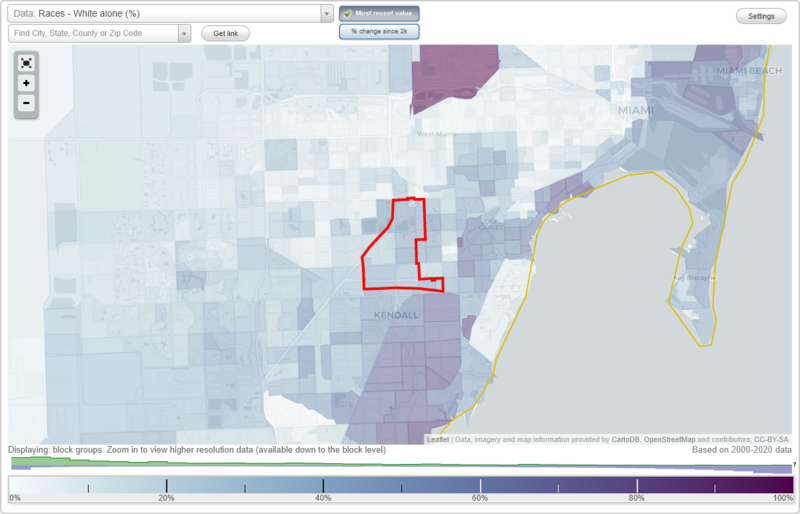
Races - White alone (%)
Races - White alone (% change since 2000)
Races - Black alone (%)
Races - Black alone (% change since 2000)
Races - American Indian alone (%)
Races - American Indian alone (% change since 2000)
Races - Asian alone (%)
Races - Asian alone (% change since 2000)
Races - Hispanic (%)
Races - Hispanic (% change since 2000)
Races - Native Hawaiian and Other Pacific Islander alone (%)
Races - Native Hawaiian and Other Pacific Islander alone (% change since 2000)
Races - Two or more races(%)
Races - Two or more races(% change since 2000)
Races - Other race alone (%)
Races - Other race alone (% change since 2000)
Racial diversity
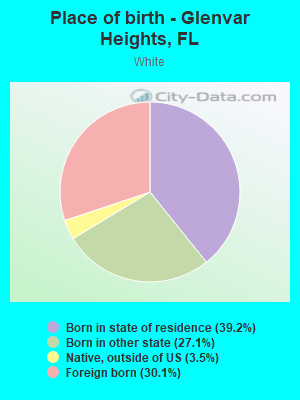
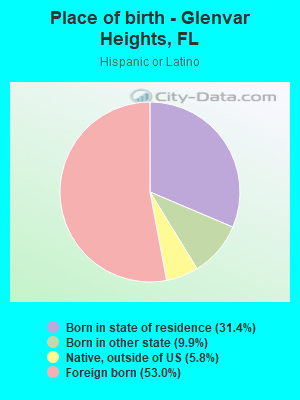
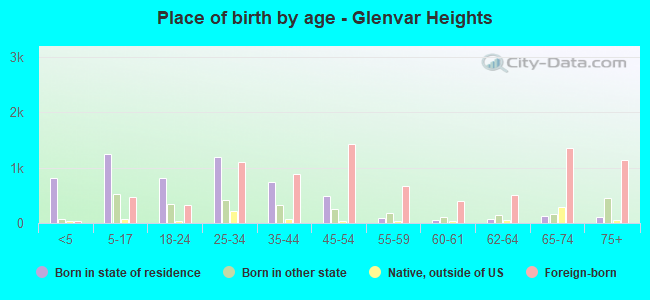
Place of birth - Born in state of residence (%)
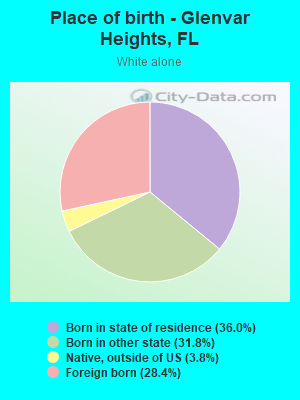
Place of birth - Born in state of residence (%) - White
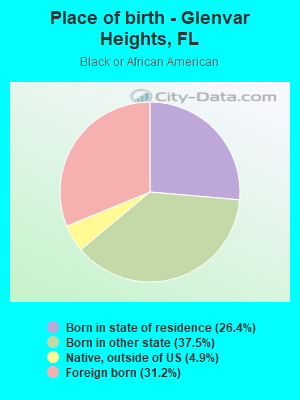
Place of birth - Born in state of residence (%) - Black or African American
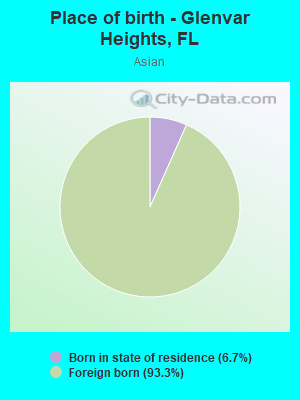
Place of birth - Born in state of residence (%) - Asian
Place of birth - Born in state of residence (%) - Hispanic or Latino
Place of birth - Born in state of residence (%) - American Indian and Alaska Native
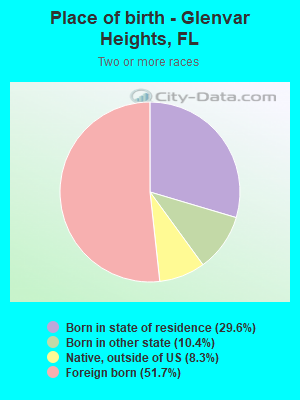
Place of birth - Born in state of residence (%) - Multirace
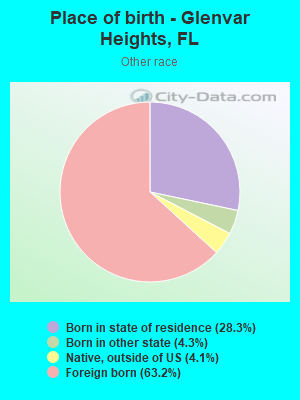
Place of birth - Born in state of residence (%) - Other Race
Place of birth - Born in other state (%)
Place of birth - Born in other state (%) - White
Place of birth - Born in other state (%) - Black or African American
Place of birth - Born in other state (%) - Asian
Place of birth - Born in other state (%) - Hispanic or Latino
Place of birth - Born in other state (%) - American Indian and Alaska Native
Place of birth - Born in other state (%) - Multirace
Place of birth - Born in other state (%) - Other Race
Place of birth - Native, outside of US (%)
Place of birth - Native, outside of US (%) - White
Place of birth - Native, outside of US (%) - Black or African American
Place of birth - Native, outside of US (%) - Asian
Place of birth - Native, outside of US (%) - Hispanic or Latino
Place of birth - Native, outside of US (%) - American Indian and Alaska Native
Place of birth - Native, outside of US (%) - Multirace
Place of birth - Native, outside of US (%) - Other Race
Place of birth - Foreign born (%)
Place of birth - Foreign born (%) - White
Place of birth - Foreign born (%) - Black or African American
Place of birth - Foreign born (%) - Asian
Place of birth - Foreign born (%) - Hispanic or Latino
Place of birth - Foreign born (%) - American Indian and Alaska Native
Place of birth - Foreign born (%) - Multirace
Place of birth - Foreign born (%) - Other Race
Residents speaking English at home (%)
Residents speaking English at home - Born in the United States (%)
Residents speaking English at home - Native, born elsewhere (%)
Residents speaking English at home - Foreign born (%)
Residents speaking Spanish at home (%)
Residents speaking Spanish at home - Born in the United States (%)
Residents speaking Spanish at home - Native, born elsewhere (%)
Residents speaking Spanish at home - Foreign born (%)
Residents speaking other language at home (%)
Residents speaking other language at home - Born in the United States (%)
Residents speaking other language at home - Native, born elsewhere (%)
Residents speaking other language at home - Foreign born (%)
Marital status - Never married (%)
Marital status - Now married (%)
Marital status - Separated (%)
Marital status - Widowed (%)
Marital status - Divorced (%)
Ancestries Reported - Arab (%)
Ancestries Reported - Czech (%)
Ancestries Reported - Danish (%)
Ancestries Reported - Dutch (%)
Ancestries Reported - English (%)
Ancestries Reported - French (%)
Ancestries Reported - French Canadian (%)
Ancestries Reported - German (%)
Ancestries Reported - Greek (%)
Ancestries Reported - Hungarian (%)
Ancestries Reported - Irish (%)
Ancestries Reported - Italian (%)
Ancestries Reported - Lithuanian (%)
Ancestries Reported - Norwegian (%)
Ancestries Reported - Polish (%)
Ancestries Reported - Portuguese (%)
Ancestries Reported - Russian (%)
Ancestries Reported - Scotch-Irish (%)
Ancestries Reported - Scottish (%)
Ancestries Reported - Slovak (%)
Ancestries Reported - Subsaharan African (%)
Ancestries Reported - Swedish (%)
Ancestries Reported - Swiss (%)
Ancestries Reported - Ukrainian (%)
Ancestries Reported - United States (%)
Ancestries Reported - Welsh (%)
Ancestries Reported - West Indian (%)
Ancestries Reported - Other (%)
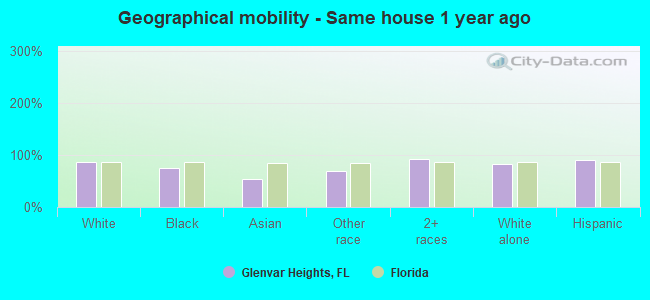
Geographical mobility - Same house 1 year ago (%)
Geographical mobility - Same house 1 year ago (%) - White
Geographical mobility - Same house 1 year ago (%) - Black or African American
Geographical mobility - Same house 1 year ago (%) - Asian
Geographical mobility - Same house 1 year ago (%) - Hispanic or Latino
Geographical mobility - Same house 1 year ago (%) - American Indian and Alaska Native
Geographical mobility - Same house 1 year ago (%) - Multirace
Geographical mobility - Same house 1 year ago (%) - Other Race
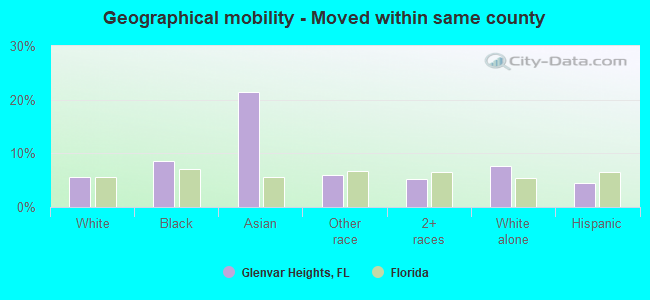
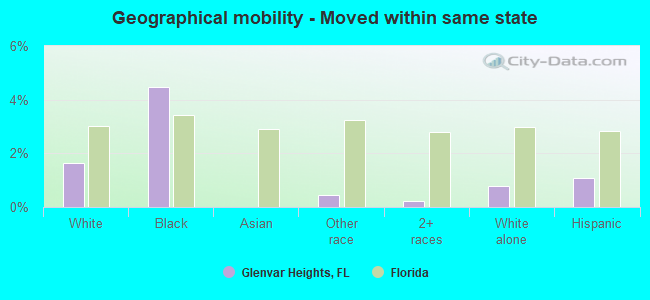
Geographical mobility - Moved within same county (%)
Geographical mobility - Moved within same county (%) - White
Geographical mobility - Moved within same county (%) - Black or African American
Geographical mobility - Moved within same county (%) - Asian
Geographical mobility - Moved within same county (%) - Hispanic or Latino
Geographical mobility - Moved within same county (%) - American Indian and Alaska Native
Geographical mobility - Moved within same county (%) - Multirace
Geographical mobility - Moved within same county (%) - Other Race
Geographical mobility - Moved from different county within same state (%)
Geographical mobility - Moved from different county within same state (%) - White
Geographical mobility - Moved from different county within same state (%) - Black or African American
Geographical mobility - Moved from different county within same state (%) - Asian
Geographical mobility - Moved from different county within same state (%) - Hispanic or Latino
Geographical mobility - Moved from different county within same state (%) - American Indian and Alaska Native
Geographical mobility - Moved from different county within same state (%) - Multirace
Geographical mobility - Moved from different county within same state (%) - Other Race
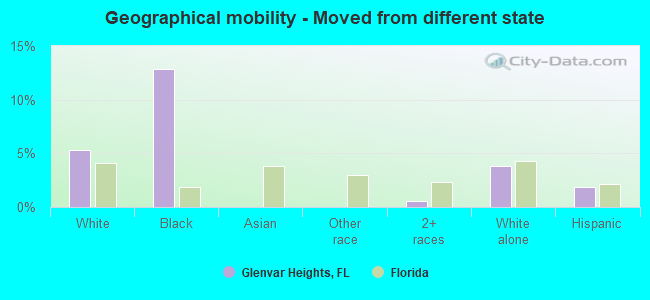
Geographical mobility - Moved from different state (%)
Geographical mobility - Moved from different state (%) - White
Geographical mobility - Moved from different state (%) - Black or African American
Geographical mobility - Moved from different state (%) - Asian
Geographical mobility - Moved from different state (%) - Hispanic or Latino
Geographical mobility - Moved from different state (%) - American Indian and Alaska Native
Geographical mobility - Moved from different state (%) - Multirace
Geographical mobility - Moved from different state (%) - Other Race
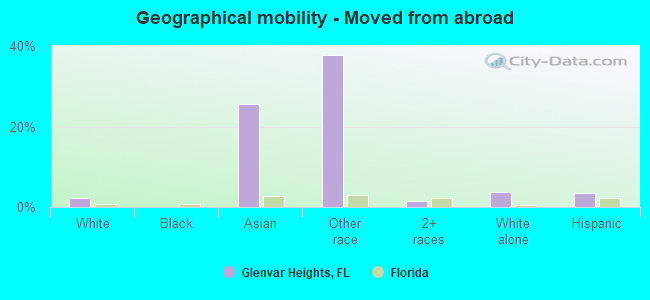
Geographical mobility - Moved from abroad (%)
Geographical mobility - Moved from abroad (%) - White
Geographical mobility - Moved from abroad (%) - Black or African American
Geographical mobility - Moved from abroad (%) - Asian
Geographical mobility - Moved from abroad (%) - Hispanic or Latino
Geographical mobility - Moved from abroad (%) - American Indian and Alaska Native
Geographical mobility - Moved from abroad (%) - Multirace
Geographical mobility - Moved from abroad (%) - Other Race
Place of birth for the foreign-born population - Ireland (%)
Place of birth for the foreign-born population - Denmark (%)
Place of birth for the foreign-born population - Norway (%)
Place of birth for the foreign-born population - Sweden (%)
Place of birth for the foreign-born population - United Kingdom (%)
Place of birth for the foreign-born population - England (%)
Place of birth for the foreign-born population - Scotland (%)
Place of birth for the foreign-born population - Other Northern Europe (%)
Place of birth for the foreign-born population - Austria (%)
Place of birth for the foreign-born population - Belgium (%)
Place of birth for the foreign-born population - France (%)
Place of birth for the foreign-born population - Germany (%)
Place of birth for the foreign-born population - Netherlands (%)
Place of birth for the foreign-born population - Switzerland (%)
Place of birth for the foreign-born population - Other Western Europe (%)
Place of birth for the foreign-born population - Greece (%)
Place of birth for the foreign-born population - Italy (%)
Place of birth for the foreign-born population - Portugal (%)
Place of birth for the foreign-born population - Spain (%)
Place of birth for the foreign-born population - Other Southern Europe (%)
Place of birth for the foreign-born population - Albania (%)
Place of birth for the foreign-born population - Belarus (%)
Place of birth for the foreign-born population - Bosnia and Herzegovina (%)
Place of birth for the foreign-born population - Bulgaria (%)
Place of birth for the foreign-born population - Croatia (%)
Place of birth for the foreign-born population - Czechoslovakia (%)
Place of birth for the foreign-born population - Hungary (%)
Place of birth for the foreign-born population - Latvia (%)
Place of birth for the foreign-born population - Lithuania (%)
Place of birth for the foreign-born population - North Macedonia (Macedonia) (%)
Place of birth for the foreign-born population - Moldova (%)
Place of birth for the foreign-born population - Poland (%)
Place of birth for the foreign-born population - Romania (%)
Place of birth for the foreign-born population - Russia (%)
Place of birth for the foreign-born population - Serbia (%)
Place of birth for the foreign-born population - Ukraine (%)
Place of birth for the foreign-born population - Other Eastern Europe (%)
Place of birth for the foreign-born population - China (%)
Place of birth for the foreign-born population - Hong Kong (%)
Place of birth for the foreign-born population - Taiwan (%)
Place of birth for the foreign-born population - Japan (%)
Place of birth for the foreign-born population - Korea (%)
Place of birth for the foreign-born population - Other Eastern Asia (%)
Place of birth for the foreign-born population - Afghanistan (%)
Place of birth for the foreign-born population - Bangladesh (%)
Place of birth for the foreign-born population - India (%)
Place of birth for the foreign-born population - Iran (%)
Place of birth for the foreign-born population - Kazakhstan (%)
Place of birth for the foreign-born population - Nepal (%)
Place of birth for the foreign-born population - Pakistan (%)
Place of birth for the foreign-born population - Sri Lanka (%)
Place of birth for the foreign-born population - Uzbekistan (%)
Place of birth for the foreign-born population - Other South Central Asia (%)
Place of birth for the foreign-born population - Burma (%)
Place of birth for the foreign-born population - Cambodia (%)
Place of birth for the foreign-born population - Indonesia (%)
Place of birth for the foreign-born population - Laos (%)
Place of birth for the foreign-born population - Malaysia (%)
Place of birth for the foreign-born population - Philippines (%)
Place of birth for the foreign-born population - Singapore (%)
Place of birth for the foreign-born population - Thailand (%)
Place of birth for the foreign-born population - Vietnam (%)
Place of birth for the foreign-born population - Other South Eastern Asia (%)
Place of birth for the foreign-born population - Armenia (%)
Place of birth for the foreign-born population - Iraq (%)
Place of birth for the foreign-born population - Israel (%)
Place of birth for the foreign-born population - Jordan (%)
Place of birth for the foreign-born population - Kuwait (%)
Place of birth for the foreign-born population - Lebanon (%)
Place of birth for the foreign-born population - Saudi Arabia (%)
Place of birth for the foreign-born population - Syria (%)
Place of birth for the foreign-born population - Turkey (%)
Place of birth for the foreign-born population - Yemen (%)
Place of birth for the foreign-born population - Other Western Asia (%)
Place of birth for the foreign-born population - Eritrea (%)
Place of birth for the foreign-born population - Ethiopia (%)
Place of birth for the foreign-born population - Kenya (%)
Place of birth for the foreign-born population - Somalia (%)
Place of birth for the foreign-born population - Uganda (%)
Place of birth for the foreign-born population - Zimbabwe (%)
Place of birth for the foreign-born population - Other Eastern Africa (%)
Place of birth for the foreign-born population - Cameroon (%)
Place of birth for the foreign-born population - Congo (%)
Place of birth for the foreign-born population - Democratic Republic of Congo (Zaire) (%)
Place of birth for the foreign-born population - Other Middle Africa (%)
Place of birth for the foreign-born population - Egypt (%)
Place of birth for the foreign-born population - Morocco (%)
Place of birth for the foreign-born population - Sudan (%)
Place of birth for the foreign-born population - Other Northern Africa (%)
Place of birth for the foreign-born population - South Africa (%)
Place of birth for the foreign-born population - Other Southern Africa (%)
Place of birth for the foreign-born population - Cabo Verde (%)
Place of birth for the foreign-born population - Ghana (%)
Place of birth for the foreign-born population - Liberia (%)
Place of birth for the foreign-born population - Nigeria (%)
Place of birth for the foreign-born population - Senegal (%)
Place of birth for the foreign-born population - Sierra Leone (%)
Place of birth for the foreign-born population - Other Western Africa (%)
Place of birth for the foreign-born population - Australia (%)
Place of birth for the foreign-born population - New Zealand (%)
Place of birth for the foreign-born population - Fiji (%)
Place of birth for the foreign-born population - Micronesia (%)
Place of birth for the foreign-born population - Bahamas (%)
Place of birth for the foreign-born population - Barbados (%)
Place of birth for the foreign-born population - Cuba (%)
Place of birth for the foreign-born population - Dominica (%)
Place of birth for the foreign-born population - Dominican Republic (%)
Place of birth for the foreign-born population - Grenada (%)
Place of birth for the foreign-born population - Haiti (%)
Place of birth for the foreign-born population - Jamaica (%)
Place of birth for the foreign-born population - St. Vincent and the Grenadines (%)
Place of birth for the foreign-born population - Trinidad and Tobago (%)
Place of birth for the foreign-born population - West Indies (%)
Place of birth for the foreign-born population - Other Caribbean (%)
Place of birth for the foreign-born population - Belize (%)
Place of birth for the foreign-born population - Costa Rica (%)
Place of birth for the foreign-born population - El Salvador (%)
Place of birth for the foreign-born population - Guatemala (%)
Place of birth for the foreign-born population - Honduras (%)
Place of birth for the foreign-born population - Mexico (%)
Place of birth for the foreign-born population - Nicaragua (%)
Place of birth for the foreign-born population - Panama (%)
Place of birth for the foreign-born population - Other Central America (%)
Place of birth for the foreign-born population - Argentina (%)
Place of birth for the foreign-born population - Bolivia (%)
Place of birth for the foreign-born population - Brazil (%)
Place of birth for the foreign-born population - Chile (%)
Place of birth for the foreign-born population - Colombia (%)
Place of birth for the foreign-born population - Ecuador (%)
Place of birth for the foreign-born population - Guyana (%)
Place of birth for the foreign-born population - Peru (%)
Place of birth for the foreign-born population - Uruguay (%)
Place of birth for the foreign-born population - Venezuela (%)
Place of birth for the foreign-born population - Other South America (%)
Place of birth for the foreign-born population - Canada (%)
Place of birth for the foreign-born population - Other Northern America (%)
Place of birth for the foreign-born population - Other (%)
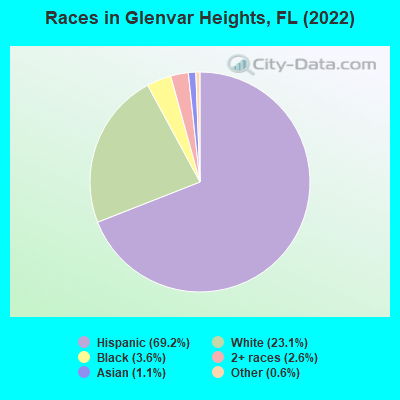
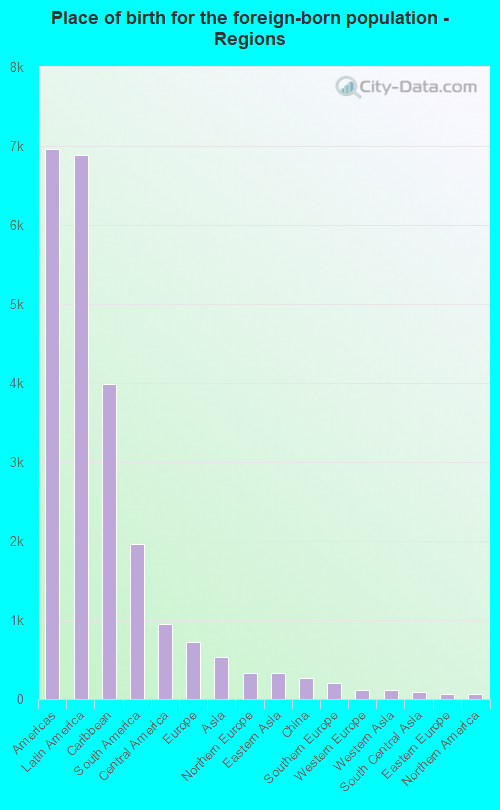
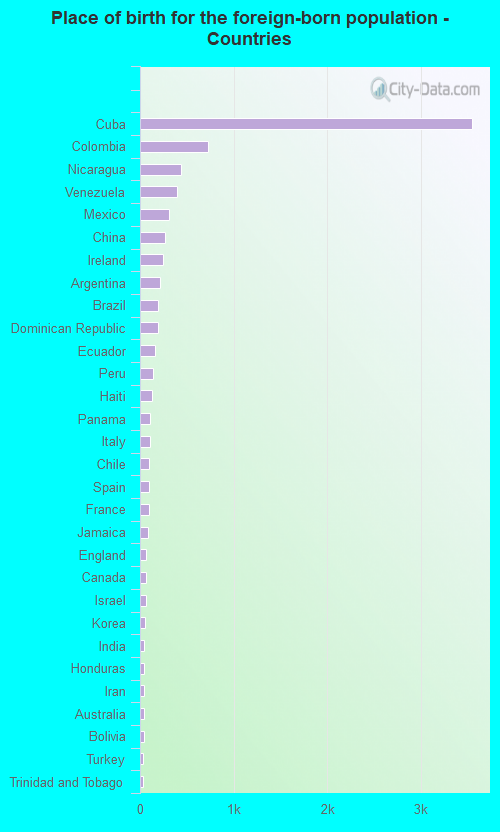
According to 2022 data, the most numerous races in Glenvar Heights, FL are White alone (4,117 residents), Hispanic (12,330 residents), and Black alone (642 residents). 29.3% of Glenvar Heights residents speak English at home. 46.4% of Glenvar Heights, FL residents are foreign-born (38.5% born in Latin America), which is 54.8% greater than the foreign-born rate of 21.0% across the entire state of Florida.
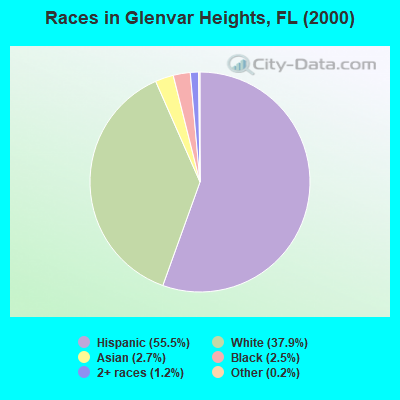
Race distribution in Glenvar Heights
2000 2022
10,458,509 65.4% White alone 2,682,715 16.8% Hispanic 2,264,268 14.2% Black alone 261,693 1.6% Asian alone 236,954 1.5% Two or more races 42,358 0.3% American Indian alone 28,994 0.2% Other race alone 6,887 0.04% Native Hawaiian and Other
11,309,403 50.8% White alone 6,025,039 27.1% Hispanic 3,241,015 14.6% Black alone 861,630 3.9% Two or more races 623,692 2.8% Asian alone 152,054 0.7% Other race alone 22,504 0.1% American Indian alone 9,486 0.04% Native Hawaiian and Other
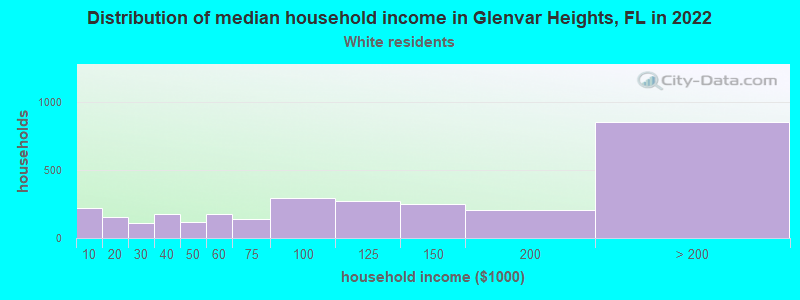
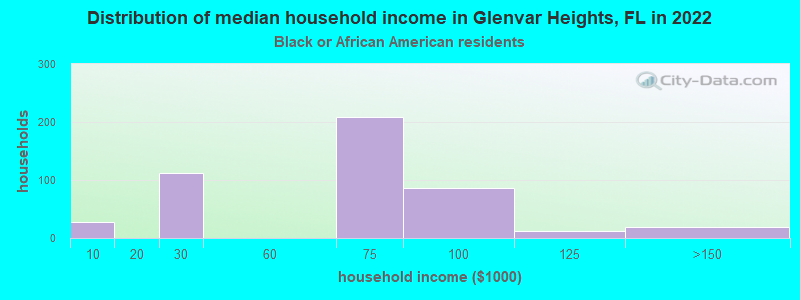
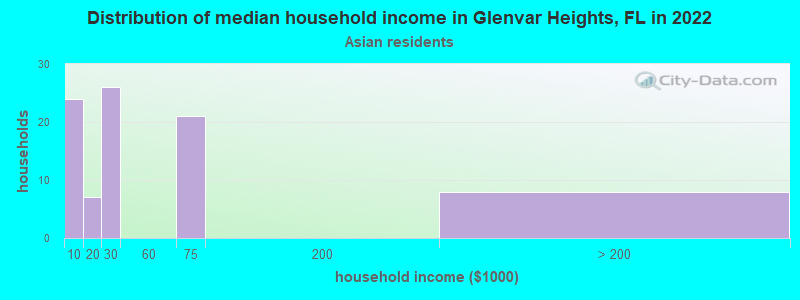
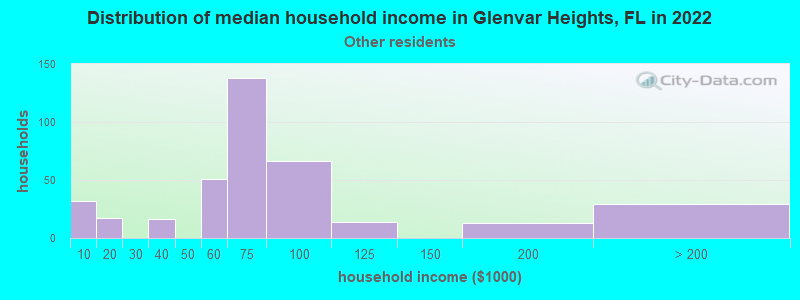
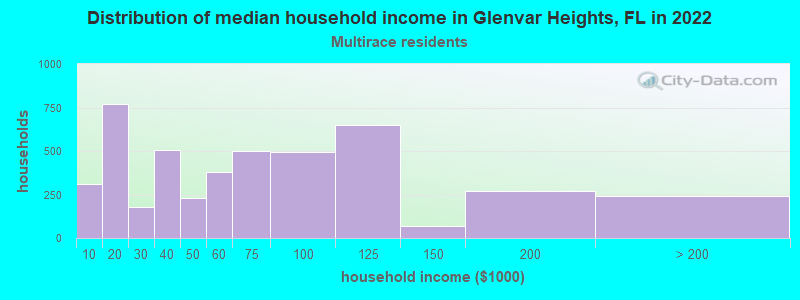
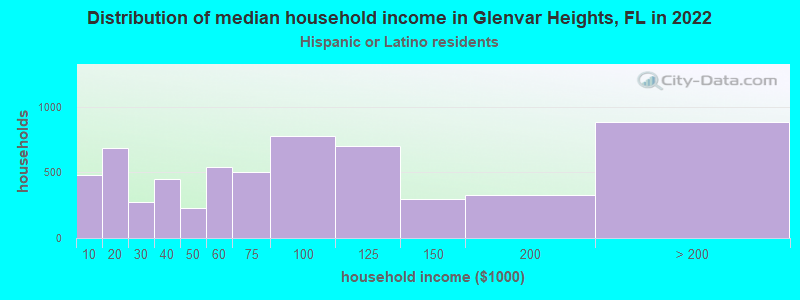
Income and house value in Glenvar Heights Median household income in 2022 $111,759 White non-Hispanic householders$68,414 Black householders$23,892 Asian householders$73,175 Some other race householders$59,428 Two or more races householders$71,809 Hispanic or Latino race householdersMedian 2022 house value $705,683 White Non-Hispanic householders$514,799 Black or African American householdersover $1,000,000 American Indian or Alaska Native householders $603,485 Asian householders$658,222 Some other race householdersover $1,000,000 Two or more races householders$826,588 Hispanic or Latino householders
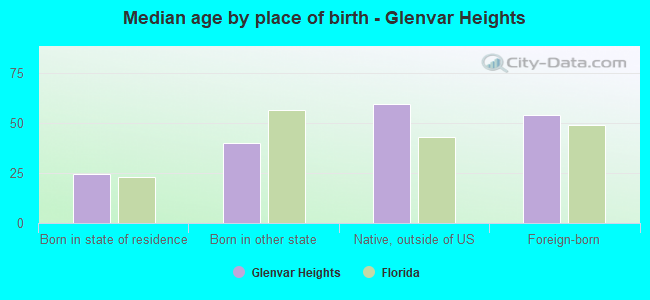
Median age by race in Glenvar Heights
37.0 Median age for White residents36.7 40.1 31.6 Median age for Black or African American residents31.5 31.9 -653,446,647.1 Median age for American Indian / Alaska Native residents-543,352,600.6 -762,696,213.5 23.6 Median age for Asian residents40.5 21.5 -679,849,340.2 Median age for Native Hawaiian / Pacific Islander residents-858,307,848.3 -443,298,968.6 35.5 Median age for Other race residents34.6 36.3 46.8 Median age for Two or more races residents39.7 50.0 32.1 Median age for White alone residents32.1 31.9 44.4 Median age for Hispanic or Latino residents39.6 47.5
Owner/renter occupied households by race in Glenvar Heights
House owners and renters - White residents 1,649 58.5% Owner occupied1,168 41.5% Renter occupiedHouse owners and renters - Black or African American residents 37 8.1% Owner occupied422 91.9% Renter occupiedHouse owners and renters - Asian residents 43 44.1% Owner occupied55 55.9% Renter occupiedHouse owners and renters - Other race residents 101 26.9% Owner occupied275 73.1% Renter occupiedHouse owners and renters - Two or more races residents 2,121 46.6% Owner occupied2,427 53.4% Renter occupiedHouse owners and renters - White alone residents 929 55.6% Owner occupied743 44.4% Renter occupiedHouse owners and renters - Hispanic or Latino residents 3,098 50.9% Owner occupied2,991 49.1% Renter occupied
Language usage in Glenvar Heights
English speakers - Total 29.3% of residents of Glenvar Heights speak English at home.
65.2% of residents speak Spanish at home 7,446 67.6% Speak English very well3,562 32.4% Speak English less than very well5.1% of residents speak other language at home 529 61.4% Speak English very well332 38.6% Speak English less than very well
English speakers - Born in the United States 63.2% of residents of Glenvar Heights speak English at home.
34.7% of residents speak Spanish at home 925 92.9% Speak English very well71 7.1% Speak English less than very well1.5% of residents speak other language at home 44 100.0% Speak English very well
English speakers - Native, born elsewhere 18.3% of residents of Glenvar Heights speak English at home.
78.1% of residents speak Spanish at home 674 95.2% Speak English very well34 4.8% Speak English less than very well
English speakers - Foreign-born 9.4% of residents of Glenvar Heights speak English at home.
80.4% of residents speak Spanish at home 3,292 49.8% Speak English very well3,315 50.2% Speak English less than very well9.6% of residents speak other language at home 472 59.6% Speak English very well320 40.4% Speak English less than very well
White (Caucasian) - Speak only English Native:
67.3% (2,817)Foreign-born:
13.4% (259)
White (Caucasian) - Speak another language Native:
37.0% (1,549)Foreign-born:
88.0% (1,706)
Black or African American - Speak only English Native:
94.5% (451)Foreign-born:
40.2% (94)
Black or African American - Speak another language Native:
5.5% (26)Foreign-born:
61.0% (142)
Asian - Speak only English Native:
100.0% (15)Foreign-born:
19.8% (37)
Other race - Speak only English Native:
13.5% (45)Foreign-born:
22.1% (145)
Other race - Speak another language Native:
86.5% (286)Foreign-born:
77.6% (509)
Two or more races - Speak only English Native:
26.1% (949)Foreign-born:
3.8% (171)
Two or more races - Speak another language Native:
73.7% (2,681)Foreign-born:
96.1% (4,270)
White alone - Speak only English Native:
81.6% (2,238)Foreign-born:
27.4% (321)
White alone - Speak another language Native:
18.8% (516)Foreign-born:
72.9% (853)
Hispanic or Latino - Speak only English Native:
25.4% (1,307)Foreign-born:
4.1% (270)
Hispanic or Latino - Speak another language Native:
75.0% (3,865)Foreign-born:
95.9% (6,236)
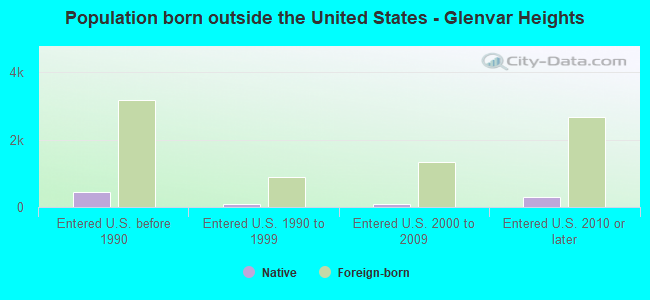
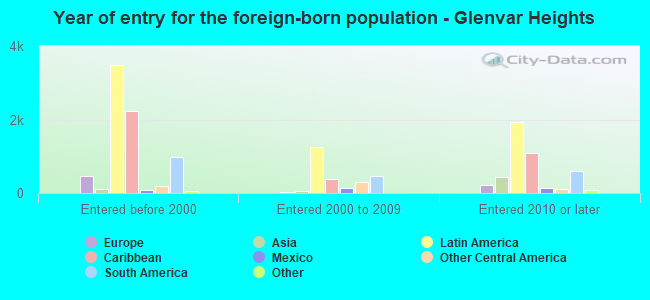
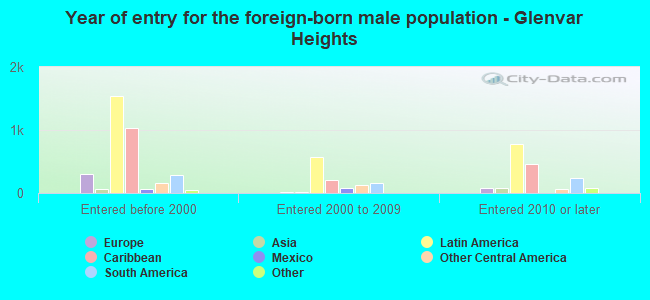
Foreign-born residents in Glenvar Heights 8,265 residents are foreign born (38.5% Latin America ).
This city:
46.4%Florida:
21.1%
Marital status for residents in Glenvar Heights Marital status - White (Caucasian) population 15 years and over
Males 34.7% Never married53.6% Now married0.5% Separated3.5% Widowed7.7% DivorcedFemales 30.7% Never married38.0% Now married2.1% Separated6.4% Widowed22.8% DivorcedWomen who gave birth in the past 12 months Now married:
69.2% (30)Unmarried:
30.8% (13)
Women who did not give birth in the past 12 months Now married:
36.6% (468)Unmarried:
63.4% (812)
Marital status - Black or African American population 15 years and over
Males 72.7% Never married16.0% Now married1.7% Separated0.0% Widowed9.6% DivorcedFemales 44.4% Never married28.8% Now married5.1% Separated17.9% Widowed3.8% DivorcedWomen who did not give birth in the past 12 months Now married:
41.2% (97)Unmarried:
58.8% (139)
Marital status - Asian population 15 years and over
Males 41.9% Never married36.5% Now married0.0% Separated0.0% Widowed21.6% DivorcedFemales 87.3% Never married12.7% Now married0.0% Separated0.0% Widowed0.0% DivorcedWomen who did not give birth in the past 12 months Now married:
12.7% (14)Unmarried:
87.3% (93)
Marital status - Other race population 15 years and over
Males 26.7% Never married68.6% Now married0.0% Separated0.0% Widowed4.7% DivorcedFemales 46.0% Never married44.3% Now married0.0% Separated0.0% Widowed9.7% DivorcedWomen who gave birth in the past 12 months Now married:
100.0% (68)Unmarried:
0.0% (0)
Women who did not give birth in the past 12 months Now married:
31.2% (102)Unmarried:
68.8% (224)
Marital status - Two or more races population 15 years and over
Males 38.1% Never married45.4% Now married4.0% Separated0.0% Widowed12.5% DivorcedFemales 26.1% Never married34.9% Now married1.3% Separated3.6% Widowed34.1% DivorcedWomen who gave birth in the past 12 months Now married:
100.0% (46)Unmarried:
0.0% (0)
Women who did not give birth in the past 12 months Now married:
38.2% (755)Unmarried:
61.8% (1,221)
Marital status - White alone, not Hispanic / Latino population 15 years and over
Males 44.7% Never married48.2% Now married0.0% Separated2.2% Widowed4.9% DivorcedFemales 35.6% Never married38.1% Now married2.1% Separated10.3% Widowed13.9% DivorcedWomen who gave birth in the past 12 months Now married:
100.0% (19)Unmarried:
0.0% (0)
Women who did not give birth in the past 12 months Now married:
30.1% (246)Unmarried:
69.9% (573)
Marital status - Hispanic or Latino population 15 years and over
Males 32.5% Never married52.7% Now married2.1% Separated2.3% Widowed10.4% DivorcedFemales 27.2% Never married37.5% Now married1.7% Separated3.9% Widowed29.7% DivorcedWomen who gave birth in the past 12 months Now married:
82.4% (109)Unmarried:
17.6% (23)
Women who did not give birth in the past 12 months Now married:
40.8% (1,144)Unmarried:
59.2% (1,662)
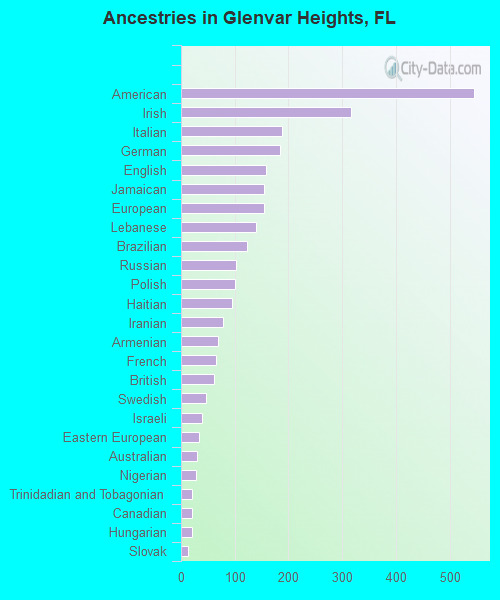
Ancestries in Glenvar Heights
546 5.0% American316 2.9% Irish188 1.7% Italian185 1.7% German159 1.5% English155 1.4% Jamaican154 1.4% European140 1.3% Lebanese122 1.1% Brazilian102 0.9% Russian101 0.9% Polish94 0.9% Haitian78 0.7% Iranian69 0.6% Armenian66 0.6% French61 0.6% British47 0.4% Swedish40 0.4% Israeli34 0.3% Eastern European29 0.3% Australian27 0.2% Nigerian21 0.2% Trinidadian and Tobagonian20 0.2% Canadian20 0.2% Hungarian13 0.1% Slovak11 0.1% Scottish10 0.09% Portuguese8 0.07% Austrian6 0.06% Palestinian6 0.06% South African
Children Nativity (place of birth) in Glenvar Heights
Children under 6 years - Living with two parents Both parents native 366 100.0% NativeBoth parents foreign-born 312 100.0% NativeOne native, one foreign-born parent 216 100.0% NativeChildren under 6 years - Living with one parent Native parent 23 85.0% Native4 15.0% Foreign-bornForeign-born parent 80 47.8% Native87 52.2% Foreign-bornChildren 6 to 17 years - Living with two parents Both parents native 318 100.0% NativeBoth parents foreign-born 211 74.4% Native72 25.6% Foreign-bornOne native, one foreign-born parent 255 89.7% Native29 10.3% Foreign-bornChildren 6 to 17 years - Living with one parent Native parent 79 100.0% NativeForeign-born parent 696 62.5% Native418 37.5% Foreign-born