Races in Golden, Colorado (CO) Detailed Stats
Data:
Races - White alone (%)
Races - White alone (% change since 2000)
Races - Black alone (%)
Races - Black alone (% change since 2000)
Races - American Indian alone (%)
Races - American Indian alone (% change since 2000)
Races - Asian alone (%)
Races - Asian alone (% change since 2000)
Races - Hispanic (%)
Races - Hispanic (% change since 2000)
Races - Native Hawaiian and Other Pacific Islander alone (%)
Races - Native Hawaiian and Other Pacific Islander alone (% change since 2000)
Races - Two or more races(%)
Races - Two or more races(% change since 2000)
Races - Other race alone (%)
Races - Other race alone (% change since 2000)
Racial diversity
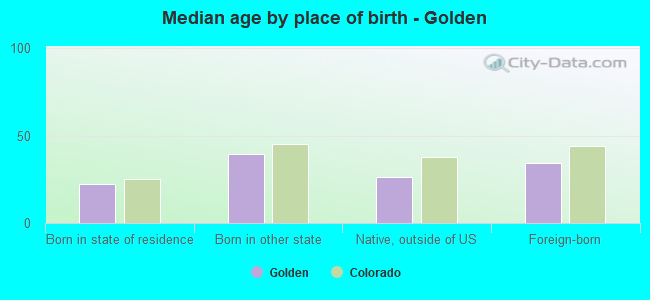
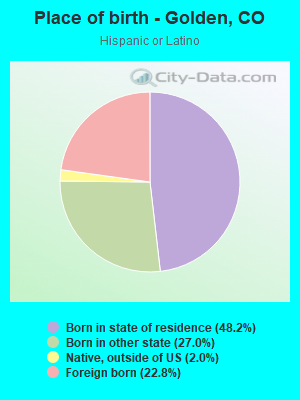
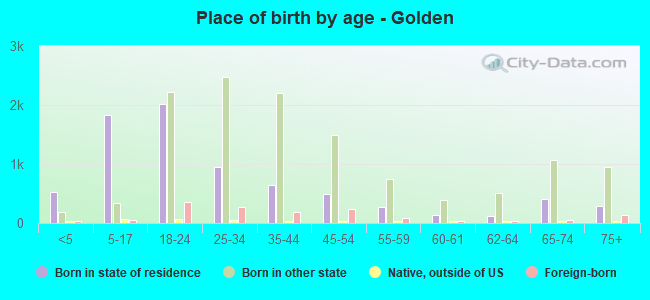
Place of birth - Born in state of residence (%)
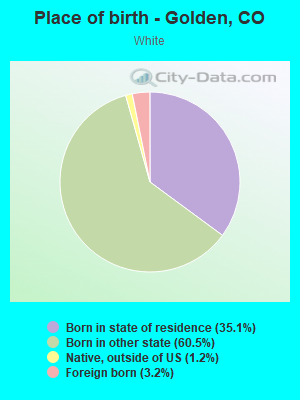
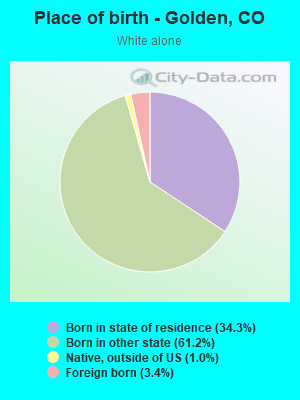
Place of birth - Born in state of residence (%) - White
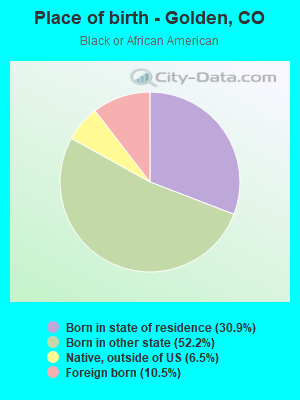
Place of birth - Born in state of residence (%) - Black or African American
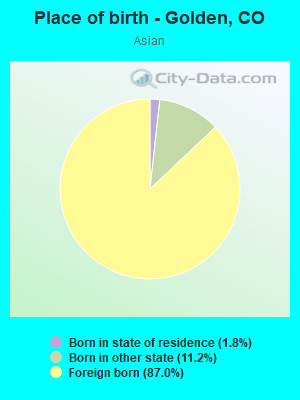
Place of birth - Born in state of residence (%) - Asian
Place of birth - Born in state of residence (%) - Hispanic or Latino
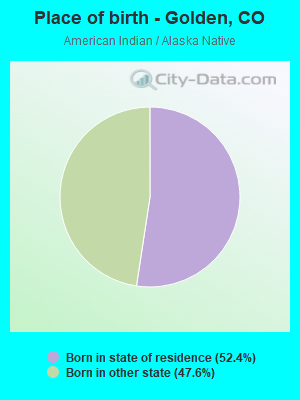
Place of birth - Born in state of residence (%) - American Indian and Alaska Native
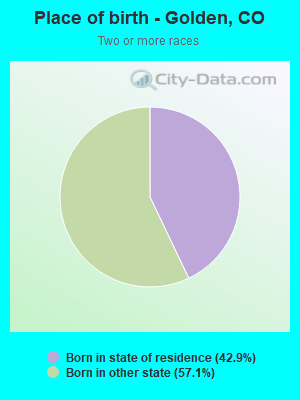
Place of birth - Born in state of residence (%) - Multirace
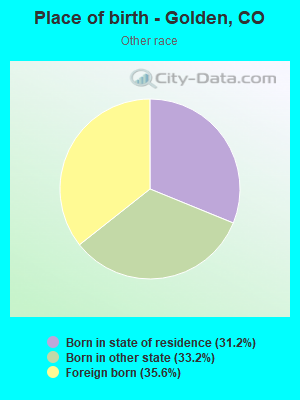
Place of birth - Born in state of residence (%) - Other Race
Place of birth - Born in other state (%)
Place of birth - Born in other state (%) - White
Place of birth - Born in other state (%) - Black or African American
Place of birth - Born in other state (%) - Asian
Place of birth - Born in other state (%) - Hispanic or Latino
Place of birth - Born in other state (%) - American Indian and Alaska Native
Place of birth - Born in other state (%) - Multirace
Place of birth - Born in other state (%) - Other Race
Place of birth - Native, outside of US (%)
Place of birth - Native, outside of US (%) - White
Place of birth - Native, outside of US (%) - Black or African American
Place of birth - Native, outside of US (%) - Asian
Place of birth - Native, outside of US (%) - Hispanic or Latino
Place of birth - Native, outside of US (%) - American Indian and Alaska Native
Place of birth - Native, outside of US (%) - Multirace
Place of birth - Native, outside of US (%) - Other Race
Place of birth - Foreign born (%)
Place of birth - Foreign born (%) - White
Place of birth - Foreign born (%) - Black or African American
Place of birth - Foreign born (%) - Asian
Place of birth - Foreign born (%) - Hispanic or Latino
Place of birth - Foreign born (%) - American Indian and Alaska Native
Place of birth - Foreign born (%) - Multirace
Place of birth - Foreign born (%) - Other Race
Residents speaking English at home (%)
Residents speaking English at home - Born in the United States (%)
Residents speaking English at home - Native, born elsewhere (%)
Residents speaking English at home - Foreign born (%)
Residents speaking Spanish at home (%)
Residents speaking Spanish at home - Born in the United States (%)
Residents speaking Spanish at home - Native, born elsewhere (%)
Residents speaking Spanish at home - Foreign born (%)
Residents speaking other language at home (%)
Residents speaking other language at home - Born in the United States (%)
Residents speaking other language at home - Native, born elsewhere (%)
Residents speaking other language at home - Foreign born (%)
Marital status - Never married (%)
Marital status - Now married (%)
Marital status - Separated (%)
Marital status - Widowed (%)
Marital status - Divorced (%)
Ancestries Reported - Arab (%)
Ancestries Reported - Czech (%)
Ancestries Reported - Danish (%)
Ancestries Reported - Dutch (%)
Ancestries Reported - English (%)
Ancestries Reported - French (%)
Ancestries Reported - French Canadian (%)
Ancestries Reported - German (%)
Ancestries Reported - Greek (%)
Ancestries Reported - Hungarian (%)
Ancestries Reported - Irish (%)
Ancestries Reported - Italian (%)
Ancestries Reported - Lithuanian (%)
Ancestries Reported - Norwegian (%)
Ancestries Reported - Polish (%)
Ancestries Reported - Portuguese (%)
Ancestries Reported - Russian (%)
Ancestries Reported - Scotch-Irish (%)
Ancestries Reported - Scottish (%)
Ancestries Reported - Slovak (%)
Ancestries Reported - Subsaharan African (%)
Ancestries Reported - Swedish (%)
Ancestries Reported - Swiss (%)
Ancestries Reported - Ukrainian (%)
Ancestries Reported - United States (%)
Ancestries Reported - Welsh (%)
Ancestries Reported - West Indian (%)
Ancestries Reported - Other (%)
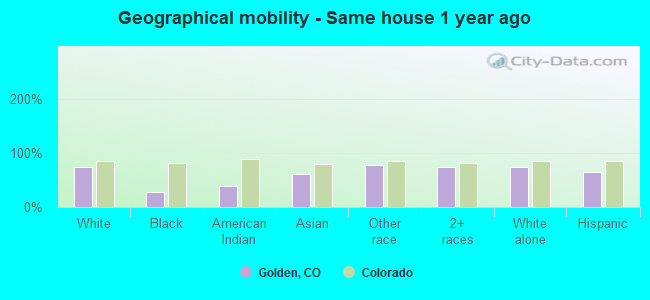
Geographical mobility - Same house 1 year ago (%)
Geographical mobility - Same house 1 year ago (%) - White
Geographical mobility - Same house 1 year ago (%) - Black or African American
Geographical mobility - Same house 1 year ago (%) - Asian
Geographical mobility - Same house 1 year ago (%) - Hispanic or Latino
Geographical mobility - Same house 1 year ago (%) - American Indian and Alaska Native
Geographical mobility - Same house 1 year ago (%) - Multirace
Geographical mobility - Same house 1 year ago (%) - Other Race
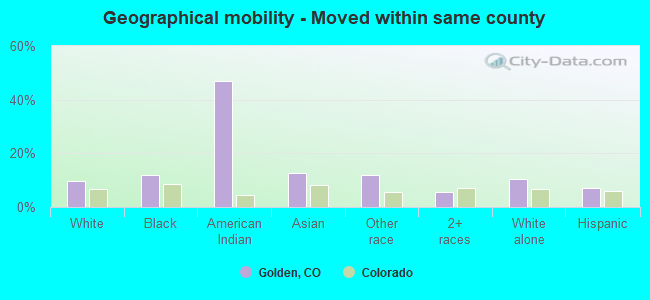
Geographical mobility - Moved within same county (%)
Geographical mobility - Moved within same county (%) - White
Geographical mobility - Moved within same county (%) - Black or African American
Geographical mobility - Moved within same county (%) - Asian
Geographical mobility - Moved within same county (%) - Hispanic or Latino
Geographical mobility - Moved within same county (%) - American Indian and Alaska Native
Geographical mobility - Moved within same county (%) - Multirace
Geographical mobility - Moved within same county (%) - Other Race
Geographical mobility - Moved from different county within same state (%)
Geographical mobility - Moved from different county within same state (%) - White
Geographical mobility - Moved from different county within same state (%) - Black or African American
Geographical mobility - Moved from different county within same state (%) - Asian
Geographical mobility - Moved from different county within same state (%) - Hispanic or Latino
Geographical mobility - Moved from different county within same state (%) - American Indian and Alaska Native
Geographical mobility - Moved from different county within same state (%) - Multirace
Geographical mobility - Moved from different county within same state (%) - Other Race
Geographical mobility - Moved from different state (%)
Geographical mobility - Moved from different state (%) - White
Geographical mobility - Moved from different state (%) - Black or African American
Geographical mobility - Moved from different state (%) - Asian
Geographical mobility - Moved from different state (%) - Hispanic or Latino
Geographical mobility - Moved from different state (%) - American Indian and Alaska Native
Geographical mobility - Moved from different state (%) - Multirace
Geographical mobility - Moved from different state (%) - Other Race
Geographical mobility - Moved from abroad (%)
Geographical mobility - Moved from abroad (%) - White
Geographical mobility - Moved from abroad (%) - Black or African American
Geographical mobility - Moved from abroad (%) - Asian
Geographical mobility - Moved from abroad (%) - Hispanic or Latino
Geographical mobility - Moved from abroad (%) - American Indian and Alaska Native
Geographical mobility - Moved from abroad (%) - Multirace
Geographical mobility - Moved from abroad (%) - Other Race
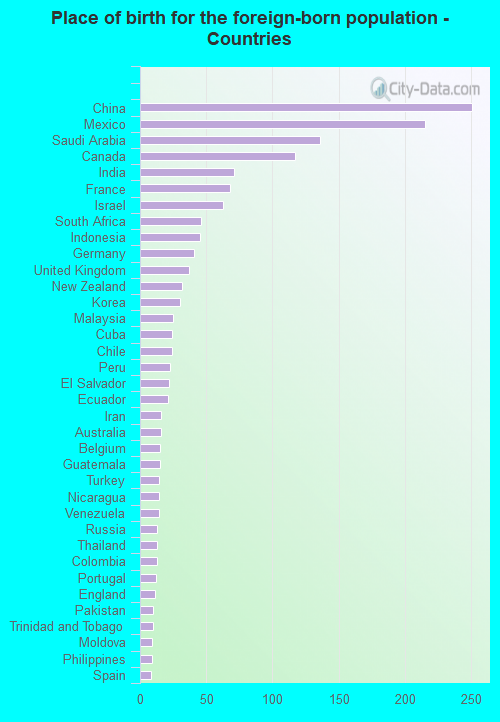
Place of birth for the foreign-born population - Ireland (%)
Place of birth for the foreign-born population - Denmark (%)
Place of birth for the foreign-born population - Norway (%)
Place of birth for the foreign-born population - Sweden (%)
Place of birth for the foreign-born population - United Kingdom (%)
Place of birth for the foreign-born population - England (%)
Place of birth for the foreign-born population - Scotland (%)
Place of birth for the foreign-born population - Other Northern Europe (%)
Place of birth for the foreign-born population - Austria (%)
Place of birth for the foreign-born population - Belgium (%)
Place of birth for the foreign-born population - France (%)
Place of birth for the foreign-born population - Germany (%)
Place of birth for the foreign-born population - Netherlands (%)
Place of birth for the foreign-born population - Switzerland (%)
Place of birth for the foreign-born population - Other Western Europe (%)
Place of birth for the foreign-born population - Greece (%)
Place of birth for the foreign-born population - Italy (%)
Place of birth for the foreign-born population - Portugal (%)
Place of birth for the foreign-born population - Spain (%)
Place of birth for the foreign-born population - Other Southern Europe (%)
Place of birth for the foreign-born population - Albania (%)
Place of birth for the foreign-born population - Belarus (%)
Place of birth for the foreign-born population - Bosnia and Herzegovina (%)
Place of birth for the foreign-born population - Bulgaria (%)
Place of birth for the foreign-born population - Croatia (%)
Place of birth for the foreign-born population - Czechoslovakia (%)
Place of birth for the foreign-born population - Hungary (%)
Place of birth for the foreign-born population - Latvia (%)
Place of birth for the foreign-born population - Lithuania (%)
Place of birth for the foreign-born population - North Macedonia (Macedonia) (%)
Place of birth for the foreign-born population - Moldova (%)
Place of birth for the foreign-born population - Poland (%)
Place of birth for the foreign-born population - Romania (%)
Place of birth for the foreign-born population - Russia (%)
Place of birth for the foreign-born population - Serbia (%)
Place of birth for the foreign-born population - Ukraine (%)
Place of birth for the foreign-born population - Other Eastern Europe (%)
Place of birth for the foreign-born population - China (%)
Place of birth for the foreign-born population - Hong Kong (%)
Place of birth for the foreign-born population - Taiwan (%)
Place of birth for the foreign-born population - Japan (%)
Place of birth for the foreign-born population - Korea (%)
Place of birth for the foreign-born population - Other Eastern Asia (%)
Place of birth for the foreign-born population - Afghanistan (%)
Place of birth for the foreign-born population - Bangladesh (%)
Place of birth for the foreign-born population - India (%)
Place of birth for the foreign-born population - Iran (%)
Place of birth for the foreign-born population - Kazakhstan (%)
Place of birth for the foreign-born population - Nepal (%)
Place of birth for the foreign-born population - Pakistan (%)
Place of birth for the foreign-born population - Sri Lanka (%)
Place of birth for the foreign-born population - Uzbekistan (%)
Place of birth for the foreign-born population - Other South Central Asia (%)
Place of birth for the foreign-born population - Burma (%)
Place of birth for the foreign-born population - Cambodia (%)
Place of birth for the foreign-born population - Indonesia (%)
Place of birth for the foreign-born population - Laos (%)
Place of birth for the foreign-born population - Malaysia (%)
Place of birth for the foreign-born population - Philippines (%)
Place of birth for the foreign-born population - Singapore (%)
Place of birth for the foreign-born population - Thailand (%)
Place of birth for the foreign-born population - Vietnam (%)
Place of birth for the foreign-born population - Other South Eastern Asia (%)
Place of birth for the foreign-born population - Armenia (%)
Place of birth for the foreign-born population - Iraq (%)
Place of birth for the foreign-born population - Israel (%)
Place of birth for the foreign-born population - Jordan (%)
Place of birth for the foreign-born population - Kuwait (%)
Place of birth for the foreign-born population - Lebanon (%)
Place of birth for the foreign-born population - Saudi Arabia (%)
Place of birth for the foreign-born population - Syria (%)
Place of birth for the foreign-born population - Turkey (%)
Place of birth for the foreign-born population - Yemen (%)
Place of birth for the foreign-born population - Other Western Asia (%)
Place of birth for the foreign-born population - Eritrea (%)
Place of birth for the foreign-born population - Ethiopia (%)
Place of birth for the foreign-born population - Kenya (%)
Place of birth for the foreign-born population - Somalia (%)
Place of birth for the foreign-born population - Uganda (%)
Place of birth for the foreign-born population - Zimbabwe (%)
Place of birth for the foreign-born population - Other Eastern Africa (%)
Place of birth for the foreign-born population - Cameroon (%)
Place of birth for the foreign-born population - Congo (%)
Place of birth for the foreign-born population - Democratic Republic of Congo (Zaire) (%)
Place of birth for the foreign-born population - Other Middle Africa (%)
Place of birth for the foreign-born population - Egypt (%)
Place of birth for the foreign-born population - Morocco (%)
Place of birth for the foreign-born population - Sudan (%)
Place of birth for the foreign-born population - Other Northern Africa (%)
Place of birth for the foreign-born population - South Africa (%)
Place of birth for the foreign-born population - Other Southern Africa (%)
Place of birth for the foreign-born population - Cabo Verde (%)
Place of birth for the foreign-born population - Ghana (%)
Place of birth for the foreign-born population - Liberia (%)
Place of birth for the foreign-born population - Nigeria (%)
Place of birth for the foreign-born population - Senegal (%)
Place of birth for the foreign-born population - Sierra Leone (%)
Place of birth for the foreign-born population - Other Western Africa (%)
Place of birth for the foreign-born population - Australia (%)
Place of birth for the foreign-born population - New Zealand (%)
Place of birth for the foreign-born population - Fiji (%)
Place of birth for the foreign-born population - Micronesia (%)
Place of birth for the foreign-born population - Bahamas (%)
Place of birth for the foreign-born population - Barbados (%)
Place of birth for the foreign-born population - Cuba (%)
Place of birth for the foreign-born population - Dominica (%)
Place of birth for the foreign-born population - Dominican Republic (%)
Place of birth for the foreign-born population - Grenada (%)
Place of birth for the foreign-born population - Haiti (%)
Place of birth for the foreign-born population - Jamaica (%)
Place of birth for the foreign-born population - St. Vincent and the Grenadines (%)
Place of birth for the foreign-born population - Trinidad and Tobago (%)
Place of birth for the foreign-born population - West Indies (%)
Place of birth for the foreign-born population - Other Caribbean (%)
Place of birth for the foreign-born population - Belize (%)
Place of birth for the foreign-born population - Costa Rica (%)
Place of birth for the foreign-born population - El Salvador (%)
Place of birth for the foreign-born population - Guatemala (%)
Place of birth for the foreign-born population - Honduras (%)
Place of birth for the foreign-born population - Mexico (%)
Place of birth for the foreign-born population - Nicaragua (%)
Place of birth for the foreign-born population - Panama (%)
Place of birth for the foreign-born population - Other Central America (%)
Place of birth for the foreign-born population - Argentina (%)
Place of birth for the foreign-born population - Bolivia (%)
Place of birth for the foreign-born population - Brazil (%)
Place of birth for the foreign-born population - Chile (%)
Place of birth for the foreign-born population - Colombia (%)
Place of birth for the foreign-born population - Ecuador (%)
Place of birth for the foreign-born population - Guyana (%)
Place of birth for the foreign-born population - Peru (%)
Place of birth for the foreign-born population - Uruguay (%)
Place of birth for the foreign-born population - Venezuela (%)
Place of birth for the foreign-born population - Other South America (%)
Place of birth for the foreign-born population - Canada (%)
Place of birth for the foreign-born population - Other Northern America (%)
Place of birth for the foreign-born population - Other (%)
Latest news about races in Golden, CO collected exclusively by city-data.com from local newspapers, TV, and radio stations
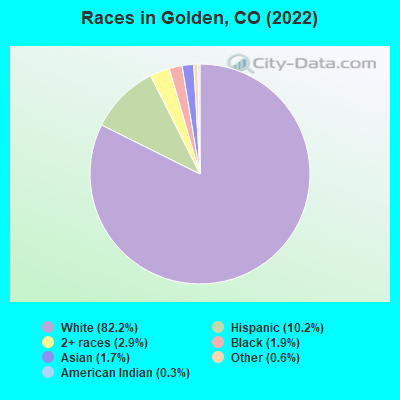
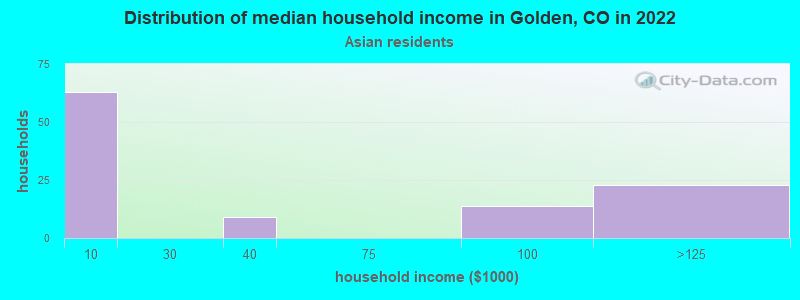
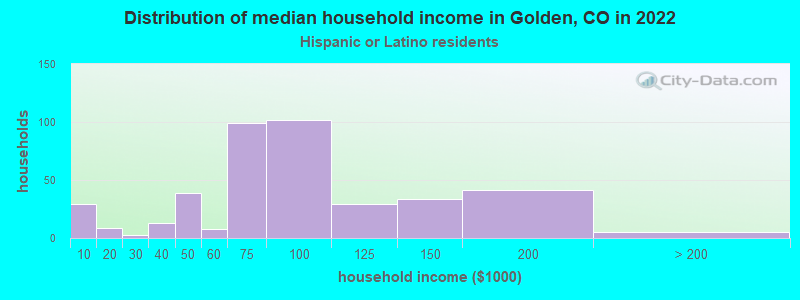
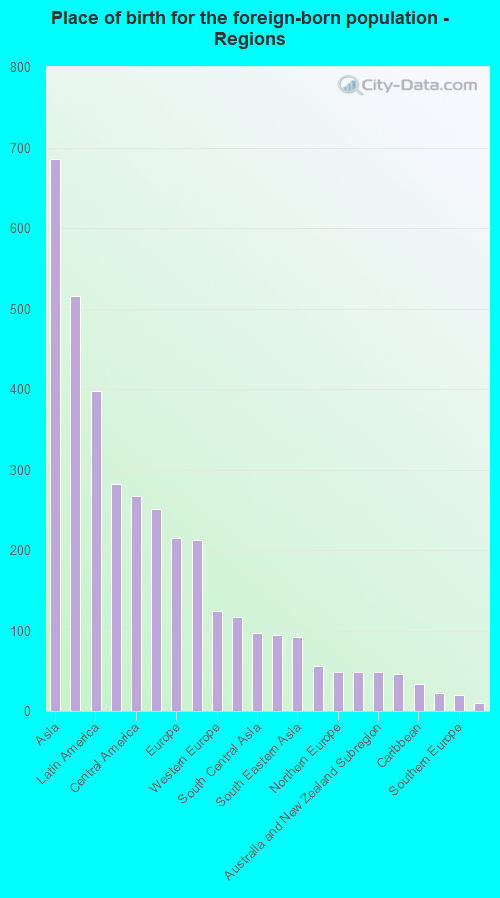
According to 2022 data, the most numerous races in Golden, CO are White alone (18,035 residents), Hispanic (1,749 residents), and Two or more races (659 residents). 91.9% of Golden residents speak English at home. 7.0% of Golden, CO residents are foreign-born (3.2% born in Asia, 1.9% born in Latin America, 1.0% born in Europe), which is 27.7% less than the foreign-born rate of 9.0% across the entire state of Colorado.
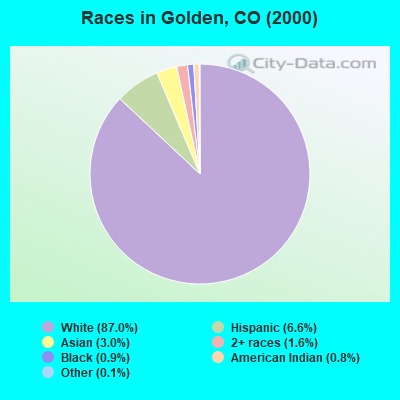
Race distribution in Golden
2000 2022
3,202,880 74.5% White alone 735,601 17.1% Hispanic 158,443 3.7% Black alone 93,277 2.2% Asian alone 72,721 1.7% Two or more races 28,982 0.7% American Indian alone 5,512 0.1% Other race alone 3,845 0.09% Native Hawaiian and Other
3,793,270 65.0% White alone 1,314,962 22.5% Hispanic 268,754 4.6% Two or more races 220,756 3.8% Black alone 182,658 3.1% Asian alone 29,798 0.5% Other race alone 23,389 0.4% American Indian alone 6,339 0.1% Native Hawaiian and Other
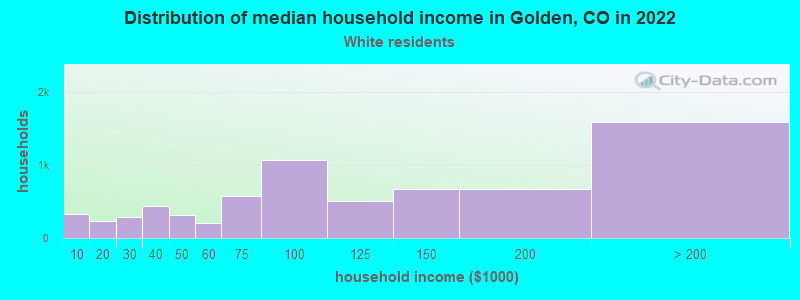
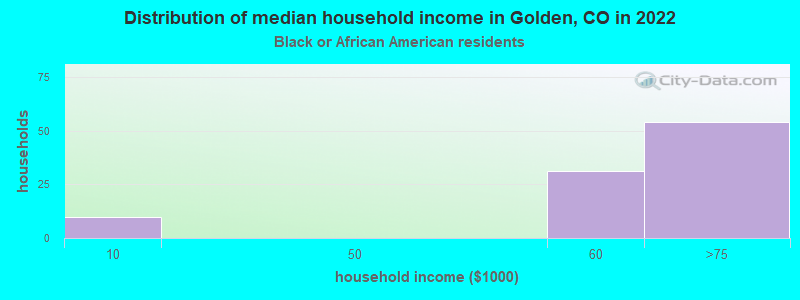
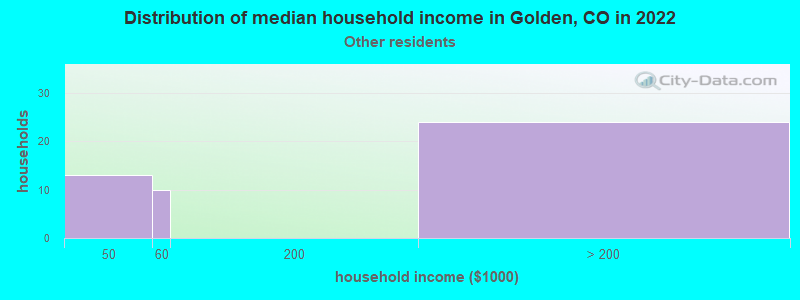
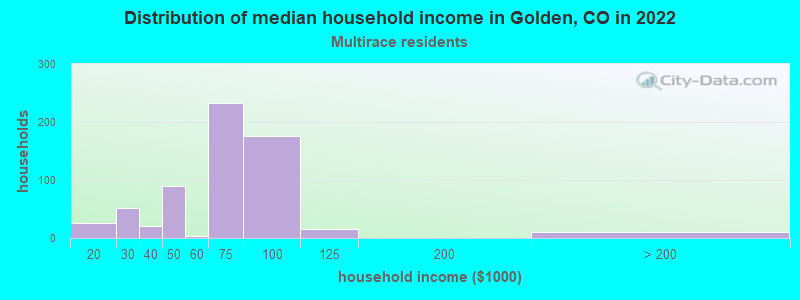
Income and house value in Golden Median household income in 2022 $99,699 White non-Hispanic householders$9,808 Black householders$15,847 American Indian and Alaska Native householders$34,898 Asian householders$76,023 Native Hawaiian and other Pacific Islander householders$40,474 Some other race householders$100,100 Two or more races householders$83,787 Hispanic or Latino race householdersMedian 2022 house value $662,133 White Non-Hispanic householders$746,392 Black or African American householdersover $1,000,000 American Indian or Alaska Native householders $651,518 Asian householders$621,994 Some other race householders$546,691 Two or more races householders$615,691 Hispanic or Latino householders
Median age by race in Golden
34.8 Median age for White residents32.0 40.1 37.0 Median age for Black or African American residents35.8 35.0 41.7 Median age for American Indian / Alaska Native residents27.2 Median age for Asian residents28.2 29.4 4.7 Median age for Native Hawaiian / Pacific Islander residents46.1 Median age for Other race residents46.0 49.2 32.6 Median age for Two or more races residents50.1 29.6 34.5 Median age for White alone residents32.4 39.0 31.4 Median age for Hispanic or Latino residents25.9 39.3
Owner/renter occupied households by race in Golden
House owners and renters - White residents 4,343 60.0% Owner occupied2,893 40.0% Renter occupiedHouse owners and renters - Black or African American residents 17 100.0% Renter occupiedHouse owners and renters - Asian residents 49 27.5% Owner occupied129 72.5% Renter occupiedHouse owners and renters - Other race residents 33 81.0% Owner occupied8 19.0% Renter occupiedHouse owners and renters - Two or more races residents 354 55.9% Owner occupied279 44.1% Renter occupiedHouse owners and renters - White alone residents 4,285 59.9% Owner occupied2,867 40.1% Renter occupiedHouse owners and renters - Hispanic or Latino residents 217 53.9% Owner occupied186 46.1% Renter occupied
Language usage in Golden
English speakers - Total 91.9% of residents of Golden speak English at home.
4.0% of residents speak Spanish at home 444 53.9% Speak English very well380 46.1% Speak English less than very well4.6% of residents speak other language at home 750 79.1% Speak English very well198 20.9% Speak English less than very well
English speakers - Born in the United States 97.0% of residents of Golden speak English at home.
2.2% of residents speak Spanish at home 204 77.6% Speak English very well59 22.4% Speak English less than very well0.9% of residents speak other language at home 98 94.2% Speak English very well6 5.8% Speak English less than very well
English speakers - Native, born elsewhere 70.5% of residents of Golden speak English at home.
21.4% of residents speak Spanish at home 30 60.0% Speak English very well20 40.0% Speak English less than very well8.1% of residents speak other language at home 19 100.0% Speak English very well
English speakers - Foreign-born 31.3% of residents of Golden speak English at home.
21.8% of residents speak Spanish at home 71 21.7% Speak English very well256 78.3% Speak English less than very well49.4% of residents speak other language at home 562 75.6% Speak English very well181 24.4% Speak English less than very well
White (Caucasian) - Speak only English Native:
98.8% (16,789)Foreign-born:
52.8% (301)
White (Caucasian) - Speak another language Native:
2.5% (422)Foreign-born:
57.1% (326)
Black or African American - Speak only English Native:
96.2% (322)Foreign-born:
61.7% (24)
Black or African American - Speak another language Native:
2.6% (9)Foreign-born:
33.1% (13)
Asian - Speak only English Native:
67.4% (41)Foreign-born:
18.9% (92)
Asian - Speak another language Native:
32.7% (20)Foreign-born:
81.0% (396)
Other race - Speak only English Native:
43.3% (58)Foreign-born:
16.5% (15)
Other race - Speak another language Native:
63.4% (84)Foreign-born:
79.1% (72)
White alone - Speak only English Native:
98.1% (16,390)Foreign-born:
47.3% (276)
White alone - Speak another language Native:
1.9% (318)Foreign-born:
52.4% (305)
Hispanic or Latino - Speak only English Native:
75.7% (982)Foreign-born:
21.5% (74)
Hispanic or Latino - Speak another language Native:
25.5% (331)Foreign-born:
85.9% (297)
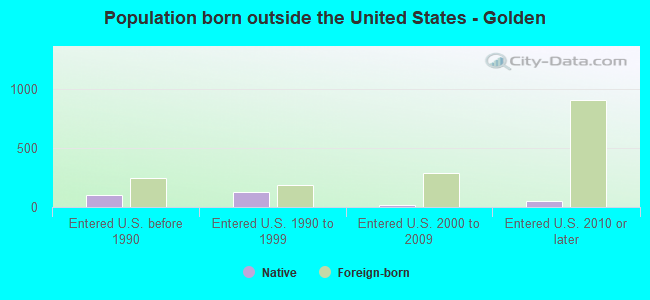
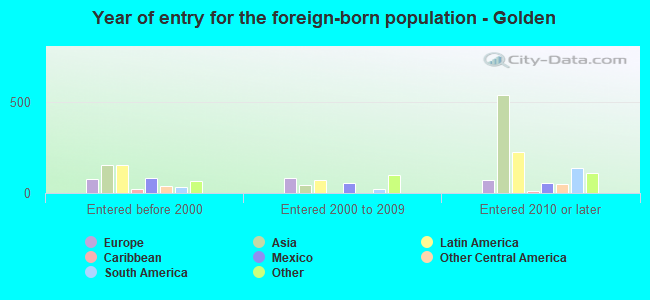
Foreign-born residents in Golden 1,521 residents are foreign born (3.2% Asia , 1.9% Latin America , 1.0% Europe ).
This city:
7.0%Colorado:
100.0%
Marital status for residents in Golden Marital status - White (Caucasian) population 15 years and over
Males 49.4% Never married35.3% Now married1.0% Separated1.7% Widowed12.6% DivorcedFemales 28.6% Never married46.5% Now married2.8% Separated8.0% Widowed14.1% DivorcedWomen who gave birth in the past 12 months Now married:
86.0% (86)Unmarried:
14.0% (14)
Women who did not give birth in the past 12 months Now married:
44.1% (1,744)Unmarried:
55.9% (2,210)
Marital status - Black or African American population 15 years and over
Males 65.9% Never married18.0% Now married0.0% Separated0.0% Widowed16.1% DivorcedFemales 86.5% Never married0.0% Now married0.0% Separated0.0% Widowed13.5% DivorcedWomen who did not give birth in the past 12 months Now married:
0.0% (0)Unmarried:
100.0% (32)
Marital status - Asian population 15 years and over
Males 78.9% Never married21.1% Now married0.0% Separated0.0% Widowed0.0% DivorcedFemales 57.4% Never married32.8% Now married0.0% Separated3.0% Widowed6.8% DivorcedWomen who did not give birth in the past 12 months Now married:
28.6% (61)Unmarried:
71.4% (152)
Marital status - Other race population 15 years and over
Males 43.7% Never married45.1% Now married0.0% Separated0.0% Widowed11.3% DivorcedFemales 50.0% Never married50.0% Now married0.0% Separated0.0% Widowed0.0% DivorcedWomen who did not give birth in the past 12 months Now married:
49.3% (40)Unmarried:
50.7% (42)
Marital status - Two or more races population 15 years and over
Males 69.8% Never married0.0% Now married0.0% Separated0.0% Widowed30.2% DivorcedFemales 79.0% Never married10.5% Now married2.4% Separated0.0% Widowed8.1% DivorcedWomen who did not give birth in the past 12 months Now married:
10.7% (93)Unmarried:
89.3% (774)
Marital status - White alone, not Hispanic / Latino population 15 years and over
Males 48.0% Never married36.6% Now married0.7% Separated1.9% Widowed12.8% DivorcedFemales 28.9% Never married46.6% Now married2.1% Separated8.6% Widowed13.8% DivorcedWomen who gave birth in the past 12 months Now married:
100.0% (78)Unmarried:
0.0% (0)
Women who did not give birth in the past 12 months Now married:
43.0% (1,705)Unmarried:
57.0% (2,263)
Marital status - Hispanic or Latino population 15 years and over
Males 61.4% Never married23.7% Now married3.3% Separated0.0% Widowed11.5% DivorcedFemales 30.6% Never married44.0% Now married9.7% Separated0.0% Widowed15.7% DivorcedWomen who gave birth in the past 12 months Now married:
50.0% (16)Unmarried:
50.0% (16)
Women who did not give birth in the past 12 months Now married:
56.1% (224)Unmarried:
43.9% (175)
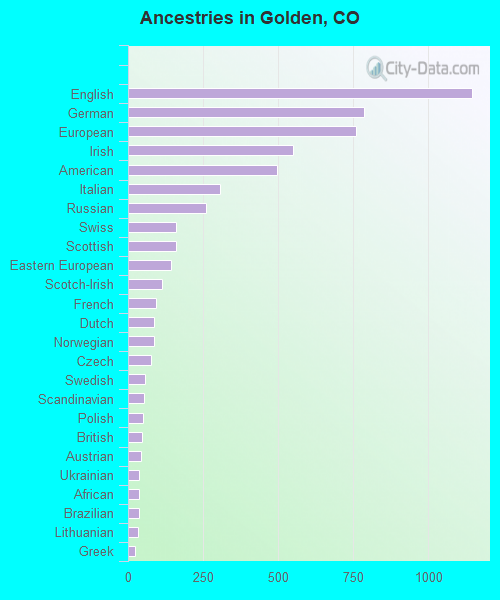
Ancestries in Golden
1,146 13.3% German1,014 11.8% European624 7.3% English475 5.5% Irish387 4.5% American230 2.7% Italian165 1.9% Scottish129 1.5% Polish120 1.4% Scandinavian117 1.4% Norwegian111 1.3% British92 1.1% Swedish92 1.1% Dutch84 1.0% Scotch-Irish70 0.8% French58 0.7% Danish53 0.6% New Zealander50 0.6% Eastern European49 0.6% Russian48 0.6% Israeli42 0.5% Ukrainian40 0.5% French Canadian37 0.4% Canadian30 0.3% Belgian23 0.3% Northern European20 0.2% Romanian19 0.2% Icelander19 0.2% Hungarian17 0.2% Greek17 0.2% Serbian17 0.2% Swiss16 0.2% Iranian15 0.2% Slovak14 0.2% Welsh12 0.1% Cajun11 0.1% Portuguese11 0.1% Kenyan10 0.1% Austrian10 0.1% Turkish7 0.08% Yugoslavian6 0.07% Lebanese6 0.07% Czech5 0.06% Czechoslovakian1 0.01% Albanian
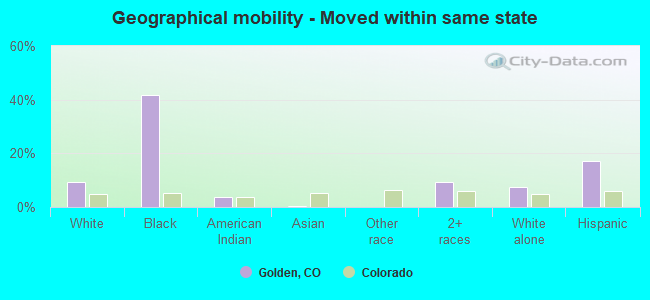
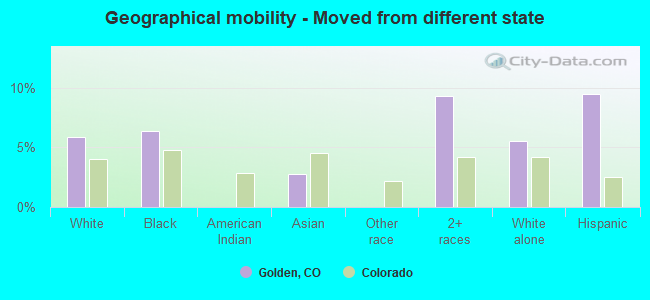
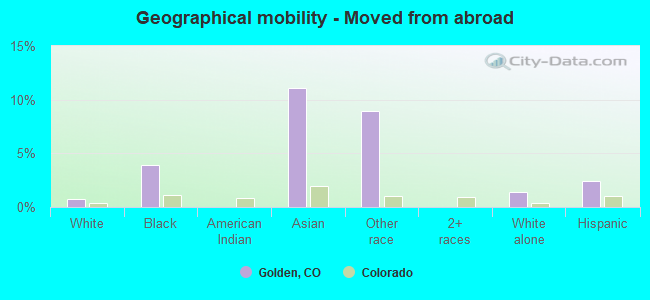
Geographical mobility in Golden Same house 1 year ago 13,153 73.3% White (Caucasian)104 27.4% Black or African American45 39.2% American Indian / Alaska Native362 61.5% Asian168 76.7% Other race888 74.3% Two or more races13,106 74.3% White alone, not Hispanic / Latino1,087 64.5% Hispanic or LatinoMoved within same county 1,737 9.7% White / Caucasian45 11.9% Black or African American53 46.9% American Indian / Alaska Native74 12.6% Asian26 11.7% Other race69 5.7% Two or more races1,871 10.6% White alone, not Hispanic / Latino122 7.3% Hispanic or LatinoMoved within same state 1,702 9.5% White / Caucasian159 41.7% Black or African American4 3.7% American Indian / Alaska Native3 0.5% Asian111 9.3% Two or more races1,342 7.6% White alone, not Hispanic / Latino287 17.0% Hispanic or LatinoMoved from different state 1,059 5.9% White / Caucasian24 6.3% Black or African American16 2.8% Asian112 9.3% Two or more races980 5.6% White alone, not Hispanic / Latino160 9.5% Hispanic or LatinoMoved from abroad 130 0.7% White15 3.9% Black or African American65 11.1% Asian20 8.9% Other race239 1.4% White alone, not Hispanic / Latino41 2.4% Hispanic or Latino
Children Nativity (place of birth) in Golden
Children under 6 years - Living with two parents Both parents native 699 100.0% NativeBoth parents foreign-born 10 100.0% NativeOne native, one foreign-born parent 28 100.0% NativeChildren under 6 years - Living with one parent Native parent 95 100.0% NativeForeign-born parent 9 100.0% Foreign-bornChildren 6 to 17 years - Living with two parents Both parents native 1,159 97.2% Native33 2.8% Foreign-bornBoth parents foreign-born 86 87.9% Native12 12.1% Foreign-bornOne native, one foreign-born parent 136 100.0% NativeChildren 6 to 17 years - Living with one parent Native parent 479 100.0% Native
Grandparents responsible for own grandchildren in Golden
Grandparents (30 to 59 years) White / Caucasian 13 100.0% Not responsible for grandchildrenWhite alone, not Hispanic / Latino 17 100.0% Not responsible for grandchildrenGrandparents (60 years and over) White / Caucasian 25 33.1% Responsible for grandchildren50 66.9% Not responsible for grandchildrenWhite alone, not Hispanic / Latino 31 32.9% Responsible for grandchildren64 67.1% Not responsible for grandchildren