Races in Goodings Grove, Illinois (IL) Detailed Stats
Ancestries, Foreign-born residents, place of birth

Discuss Goodings Grove, Illinois races on our local forum with over 2,400,000 registered users
8.0% of Goodings Grove, IL residents are foreign-born (5.6% born in Europe, 1.4% born in Asia, 0.9% born in Latin America), which is 75.7% less than the foreign-born rate of 14.0% across the entire state of Illinois.
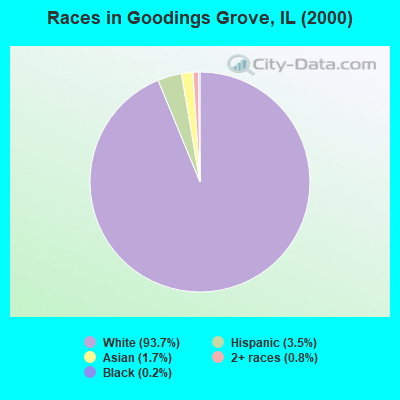
Race distribution in Goodings Grove

- 16,01293.7%White alone
- 6013.5%Hispanic
- 2931.7%Asian alone
- 1370.8%Two or more races
- 350.2%Black alone
- 50.03%Other race alone
- 10.01%American Indian alone
2000
2022
-
- 8,424,14067.8%White alone
- 1,856,15214.9%Black alone
- 1,530,26212.3%Hispanic
- 419,9163.4%Asian alone
- 153,9961.2%Two or more races
- 13,4790.1%Other race alone
- 18,2320.1%American Indian alone
- 3,1160.03%Native Hawaiian and Other
Pacific Islander alone

-
- 7,356,30158.5%White alone
- 2,299,72618.3%Hispanic
- 1,660,42313.2%Black alone
- 747,2965.9%Asian alone
- 458,5993.6%Two or more races
- 45,3860.4%Other race alone
- 10,4050.08%American Indian alone
- 3,8960.03%Native Hawaiian and Other
Pacific Islander alone

Income and house value in Goodings Grove
- Median household income in 2022
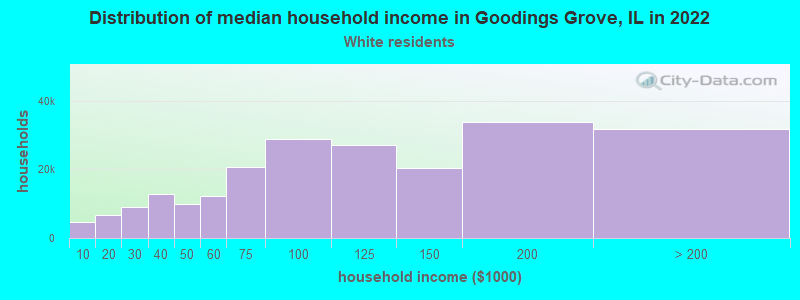
- $135,977White non-Hispanic householders
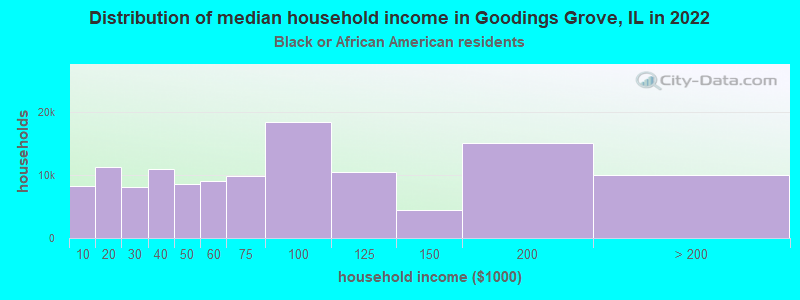
- over $200,000Black householders
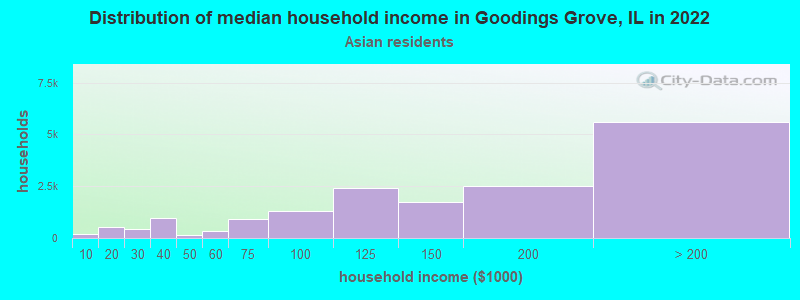
- $175,765Asian householders
- $187,228Two or more races householders
- $128,650Hispanic or Latino race householders
- Median 2022 house value
- $433,161White Non-Hispanic householders
- $222,412Black or African American householders
- $462,816Asian householders
- $514,021Two or more races householders
- $428,812Hispanic or Latino householders
Household income for White non-Hispanic householders
Household income for Black householders
Household income for Asian householders
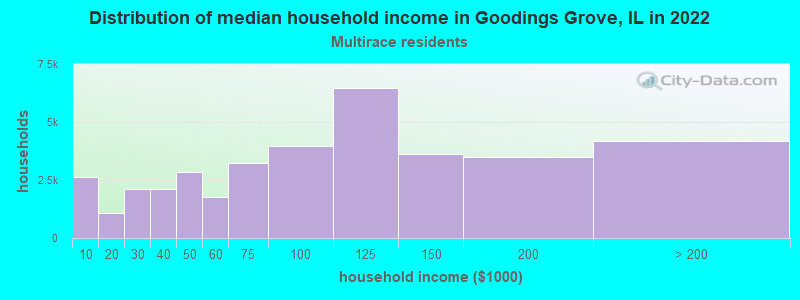
Household income for Two or more races householders
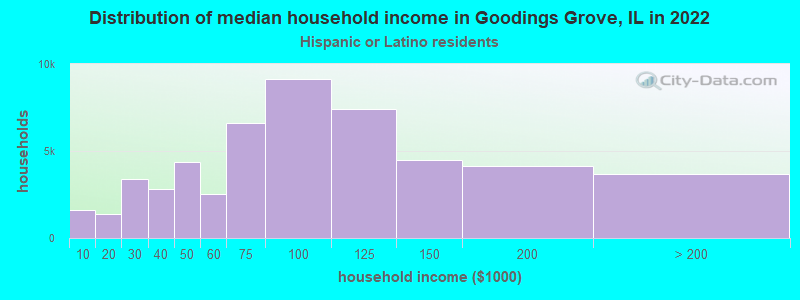
Household income for Hispanic or Latino race householders
Foreign-born residents in Goodings Grove
1,361 residents are foreign born (5.6% Europe, 1.4% Asia, 0.9% Latin America).
| This city: | 8.0% |
| Illinois: | 12.3% |
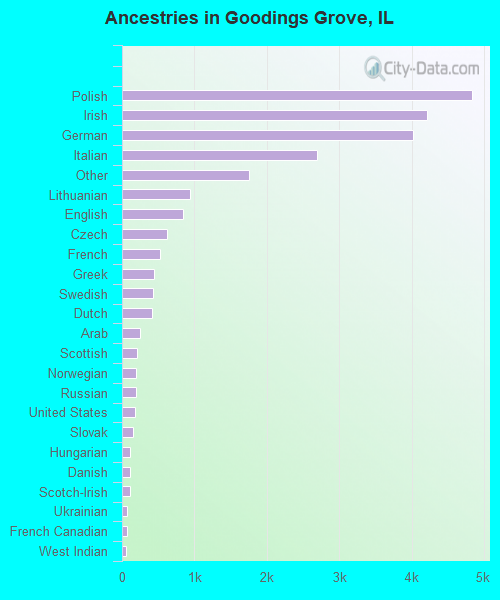
Ancestries in Goodings Grove

- 4,82520.6%Polish
- 4,21718.0%Irish
- 4,01917.2%German
- 2,69111.5%Italian
- 1,7577.5%Other
- 9344.0%Lithuanian
- 8383.6%English
- 6192.6%Czech
- 5272.2%French
- 4381.9%Greek
- 4281.8%Swedish
- 4211.8%Dutch
- 2541.1%Arab
- 2130.9%Scottish
- 1970.8%Norwegian
- 1890.8%Russian
- 1750.7%United States
- 1470.6%Slovak
- 1110.5%Hungarian
- 1060.5%Danish
- 1040.4%Scotch-Irish
- 700.3%Ukrainian
- 670.3%French Canadian
- 530.2%West Indian
- 320.1%Welsh
Zip codes: 60441.