Races in Grand Prairie, Texas (TX) Detailed Stats
Data:
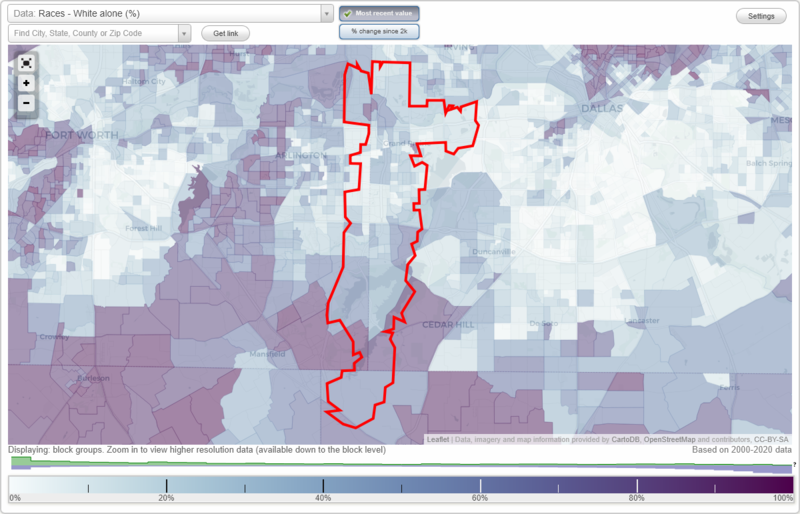
Races - White alone (%)
Races - White alone (% change since 2000)
Races - Black alone (%)
Races - Black alone (% change since 2000)
Races - American Indian alone (%)
Races - American Indian alone (% change since 2000)
Races - Asian alone (%)
Races - Asian alone (% change since 2000)
Races - Hispanic (%)
Races - Hispanic (% change since 2000)
Races - Native Hawaiian and Other Pacific Islander alone (%)
Races - Native Hawaiian and Other Pacific Islander alone (% change since 2000)
Races - Two or more races(%)
Races - Two or more races(% change since 2000)
Races - Other race alone (%)
Races - Other race alone (% change since 2000)
Racial diversity
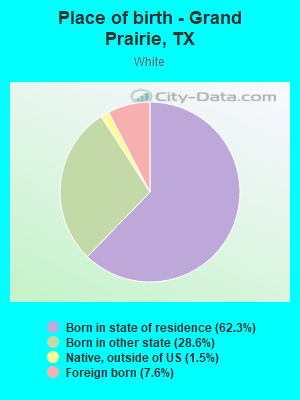
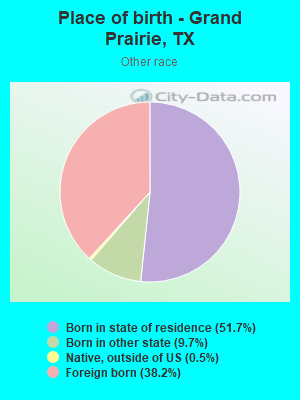
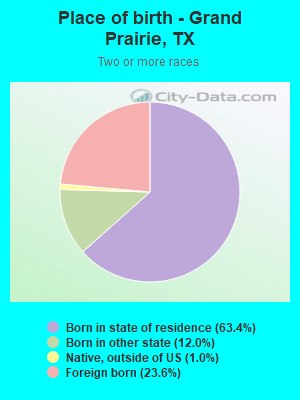
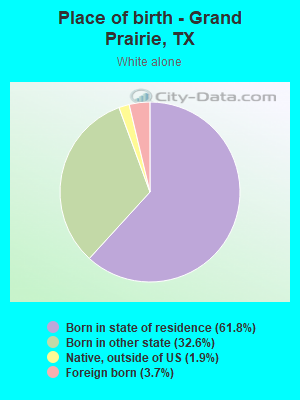
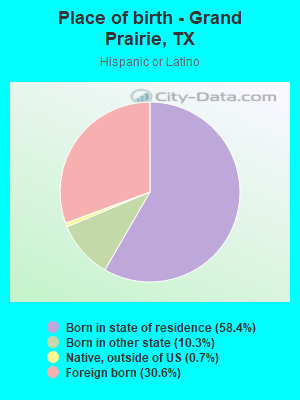
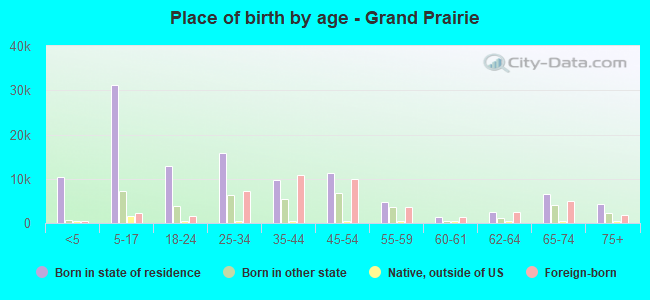
Place of birth - Born in state of residence (%)
Place of birth - Born in state of residence (%) - White
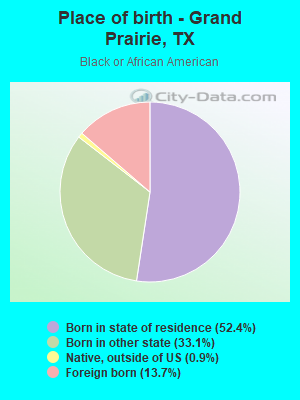
Place of birth - Born in state of residence (%) - Black or African American
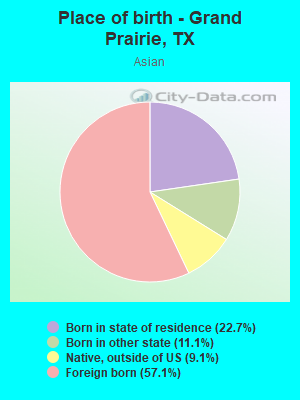
Place of birth - Born in state of residence (%) - Asian
Place of birth - Born in state of residence (%) - Hispanic or Latino
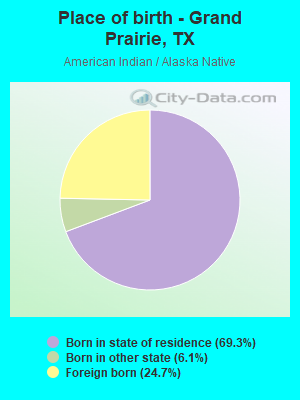
Place of birth - Born in state of residence (%) - American Indian and Alaska Native
Place of birth - Born in state of residence (%) - Multirace
Place of birth - Born in state of residence (%) - Other Race
Place of birth - Born in other state (%)
Place of birth - Born in other state (%) - White
Place of birth - Born in other state (%) - Black or African American
Place of birth - Born in other state (%) - Asian
Place of birth - Born in other state (%) - Hispanic or Latino
Place of birth - Born in other state (%) - American Indian and Alaska Native
Place of birth - Born in other state (%) - Multirace
Place of birth - Born in other state (%) - Other Race
Place of birth - Native, outside of US (%)
Place of birth - Native, outside of US (%) - White
Place of birth - Native, outside of US (%) - Black or African American
Place of birth - Native, outside of US (%) - Asian
Place of birth - Native, outside of US (%) - Hispanic or Latino
Place of birth - Native, outside of US (%) - American Indian and Alaska Native
Place of birth - Native, outside of US (%) - Multirace
Place of birth - Native, outside of US (%) - Other Race
Place of birth - Foreign born (%)
Place of birth - Foreign born (%) - White
Place of birth - Foreign born (%) - Black or African American
Place of birth - Foreign born (%) - Asian
Place of birth - Foreign born (%) - Hispanic or Latino
Place of birth - Foreign born (%) - American Indian and Alaska Native
Place of birth - Foreign born (%) - Multirace
Place of birth - Foreign born (%) - Other Race
Residents speaking English at home (%)
Residents speaking English at home - Born in the United States (%)
Residents speaking English at home - Native, born elsewhere (%)
Residents speaking English at home - Foreign born (%)
Residents speaking Spanish at home (%)
Residents speaking Spanish at home - Born in the United States (%)
Residents speaking Spanish at home - Native, born elsewhere (%)
Residents speaking Spanish at home - Foreign born (%)
Residents speaking other language at home (%)
Residents speaking other language at home - Born in the United States (%)
Residents speaking other language at home - Native, born elsewhere (%)
Residents speaking other language at home - Foreign born (%)
Marital status - Never married (%)
Marital status - Now married (%)
Marital status - Separated (%)
Marital status - Widowed (%)
Marital status - Divorced (%)
Ancestries Reported - Arab (%)
Ancestries Reported - Czech (%)
Ancestries Reported - Danish (%)
Ancestries Reported - Dutch (%)
Ancestries Reported - English (%)
Ancestries Reported - French (%)
Ancestries Reported - French Canadian (%)
Ancestries Reported - German (%)
Ancestries Reported - Greek (%)
Ancestries Reported - Hungarian (%)
Ancestries Reported - Irish (%)
Ancestries Reported - Italian (%)
Ancestries Reported - Lithuanian (%)
Ancestries Reported - Norwegian (%)
Ancestries Reported - Polish (%)
Ancestries Reported - Portuguese (%)
Ancestries Reported - Russian (%)
Ancestries Reported - Scotch-Irish (%)
Ancestries Reported - Scottish (%)
Ancestries Reported - Slovak (%)
Ancestries Reported - Subsaharan African (%)
Ancestries Reported - Swedish (%)
Ancestries Reported - Swiss (%)
Ancestries Reported - Ukrainian (%)
Ancestries Reported - United States (%)
Ancestries Reported - Welsh (%)
Ancestries Reported - West Indian (%)
Ancestries Reported - Other (%)
Geographical mobility - Same house 1 year ago (%)
Geographical mobility - Same house 1 year ago (%) - White
Geographical mobility - Same house 1 year ago (%) - Black or African American
Geographical mobility - Same house 1 year ago (%) - Asian
Geographical mobility - Same house 1 year ago (%) - Hispanic or Latino
Geographical mobility - Same house 1 year ago (%) - American Indian and Alaska Native
Geographical mobility - Same house 1 year ago (%) - Multirace
Geographical mobility - Same house 1 year ago (%) - Other Race
Geographical mobility - Moved within same county (%)
Geographical mobility - Moved within same county (%) - White
Geographical mobility - Moved within same county (%) - Black or African American
Geographical mobility - Moved within same county (%) - Asian
Geographical mobility - Moved within same county (%) - Hispanic or Latino
Geographical mobility - Moved within same county (%) - American Indian and Alaska Native
Geographical mobility - Moved within same county (%) - Multirace
Geographical mobility - Moved within same county (%) - Other Race
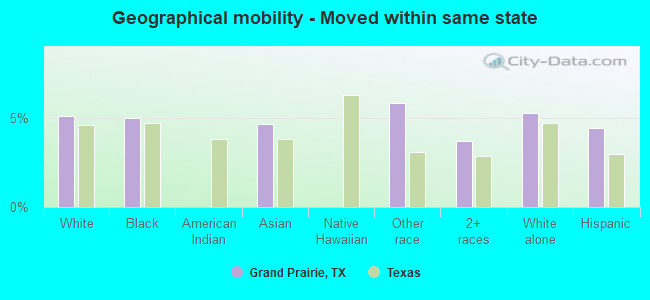
Geographical mobility - Moved from different county within same state (%)
Geographical mobility - Moved from different county within same state (%) - White
Geographical mobility - Moved from different county within same state (%) - Black or African American
Geographical mobility - Moved from different county within same state (%) - Asian
Geographical mobility - Moved from different county within same state (%) - Hispanic or Latino
Geographical mobility - Moved from different county within same state (%) - American Indian and Alaska Native
Geographical mobility - Moved from different county within same state (%) - Multirace
Geographical mobility - Moved from different county within same state (%) - Other Race
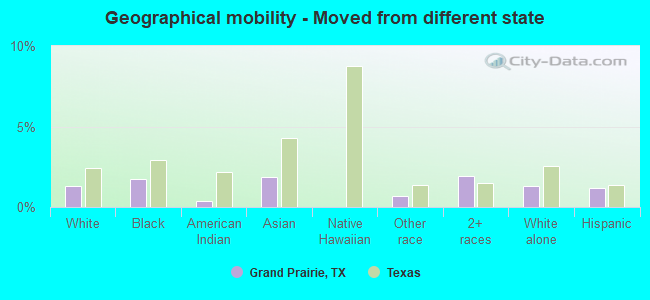
Geographical mobility - Moved from different state (%)
Geographical mobility - Moved from different state (%) - White
Geographical mobility - Moved from different state (%) - Black or African American
Geographical mobility - Moved from different state (%) - Asian
Geographical mobility - Moved from different state (%) - Hispanic or Latino
Geographical mobility - Moved from different state (%) - American Indian and Alaska Native
Geographical mobility - Moved from different state (%) - Multirace
Geographical mobility - Moved from different state (%) - Other Race
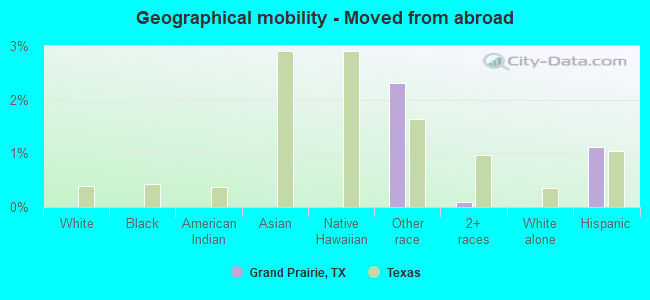
Geographical mobility - Moved from abroad (%)
Geographical mobility - Moved from abroad (%) - White
Geographical mobility - Moved from abroad (%) - Black or African American
Geographical mobility - Moved from abroad (%) - Asian
Geographical mobility - Moved from abroad (%) - Hispanic or Latino
Geographical mobility - Moved from abroad (%) - American Indian and Alaska Native
Geographical mobility - Moved from abroad (%) - Multirace
Geographical mobility - Moved from abroad (%) - Other Race
Place of birth for the foreign-born population - Ireland (%)
Place of birth for the foreign-born population - Denmark (%)
Place of birth for the foreign-born population - Norway (%)
Place of birth for the foreign-born population - Sweden (%)
Place of birth for the foreign-born population - United Kingdom (%)
Place of birth for the foreign-born population - England (%)
Place of birth for the foreign-born population - Scotland (%)
Place of birth for the foreign-born population - Other Northern Europe (%)
Place of birth for the foreign-born population - Austria (%)
Place of birth for the foreign-born population - Belgium (%)
Place of birth for the foreign-born population - France (%)
Place of birth for the foreign-born population - Germany (%)
Place of birth for the foreign-born population - Netherlands (%)
Place of birth for the foreign-born population - Switzerland (%)
Place of birth for the foreign-born population - Other Western Europe (%)
Place of birth for the foreign-born population - Greece (%)
Place of birth for the foreign-born population - Italy (%)
Place of birth for the foreign-born population - Portugal (%)
Place of birth for the foreign-born population - Spain (%)
Place of birth for the foreign-born population - Other Southern Europe (%)
Place of birth for the foreign-born population - Albania (%)
Place of birth for the foreign-born population - Belarus (%)
Place of birth for the foreign-born population - Bosnia and Herzegovina (%)
Place of birth for the foreign-born population - Bulgaria (%)
Place of birth for the foreign-born population - Croatia (%)
Place of birth for the foreign-born population - Czechoslovakia (%)
Place of birth for the foreign-born population - Hungary (%)
Place of birth for the foreign-born population - Latvia (%)
Place of birth for the foreign-born population - Lithuania (%)
Place of birth for the foreign-born population - North Macedonia (Macedonia) (%)
Place of birth for the foreign-born population - Moldova (%)
Place of birth for the foreign-born population - Poland (%)
Place of birth for the foreign-born population - Romania (%)
Place of birth for the foreign-born population - Russia (%)
Place of birth for the foreign-born population - Serbia (%)
Place of birth for the foreign-born population - Ukraine (%)
Place of birth for the foreign-born population - Other Eastern Europe (%)
Place of birth for the foreign-born population - China (%)
Place of birth for the foreign-born population - Hong Kong (%)
Place of birth for the foreign-born population - Taiwan (%)
Place of birth for the foreign-born population - Japan (%)
Place of birth for the foreign-born population - Korea (%)
Place of birth for the foreign-born population - Other Eastern Asia (%)
Place of birth for the foreign-born population - Afghanistan (%)
Place of birth for the foreign-born population - Bangladesh (%)
Place of birth for the foreign-born population - India (%)
Place of birth for the foreign-born population - Iran (%)
Place of birth for the foreign-born population - Kazakhstan (%)
Place of birth for the foreign-born population - Nepal (%)
Place of birth for the foreign-born population - Pakistan (%)
Place of birth for the foreign-born population - Sri Lanka (%)
Place of birth for the foreign-born population - Uzbekistan (%)
Place of birth for the foreign-born population - Other South Central Asia (%)
Place of birth for the foreign-born population - Burma (%)
Place of birth for the foreign-born population - Cambodia (%)
Place of birth for the foreign-born population - Indonesia (%)
Place of birth for the foreign-born population - Laos (%)
Place of birth for the foreign-born population - Malaysia (%)
Place of birth for the foreign-born population - Philippines (%)
Place of birth for the foreign-born population - Singapore (%)
Place of birth for the foreign-born population - Thailand (%)
Place of birth for the foreign-born population - Vietnam (%)
Place of birth for the foreign-born population - Other South Eastern Asia (%)
Place of birth for the foreign-born population - Armenia (%)
Place of birth for the foreign-born population - Iraq (%)
Place of birth for the foreign-born population - Israel (%)
Place of birth for the foreign-born population - Jordan (%)
Place of birth for the foreign-born population - Kuwait (%)
Place of birth for the foreign-born population - Lebanon (%)
Place of birth for the foreign-born population - Saudi Arabia (%)
Place of birth for the foreign-born population - Syria (%)
Place of birth for the foreign-born population - Turkey (%)
Place of birth for the foreign-born population - Yemen (%)
Place of birth for the foreign-born population - Other Western Asia (%)
Place of birth for the foreign-born population - Eritrea (%)
Place of birth for the foreign-born population - Ethiopia (%)
Place of birth for the foreign-born population - Kenya (%)
Place of birth for the foreign-born population - Somalia (%)
Place of birth for the foreign-born population - Uganda (%)
Place of birth for the foreign-born population - Zimbabwe (%)
Place of birth for the foreign-born population - Other Eastern Africa (%)
Place of birth for the foreign-born population - Cameroon (%)
Place of birth for the foreign-born population - Congo (%)
Place of birth for the foreign-born population - Democratic Republic of Congo (Zaire) (%)
Place of birth for the foreign-born population - Other Middle Africa (%)
Place of birth for the foreign-born population - Egypt (%)
Place of birth for the foreign-born population - Morocco (%)
Place of birth for the foreign-born population - Sudan (%)
Place of birth for the foreign-born population - Other Northern Africa (%)
Place of birth for the foreign-born population - South Africa (%)
Place of birth for the foreign-born population - Other Southern Africa (%)
Place of birth for the foreign-born population - Cabo Verde (%)
Place of birth for the foreign-born population - Ghana (%)
Place of birth for the foreign-born population - Liberia (%)
Place of birth for the foreign-born population - Nigeria (%)
Place of birth for the foreign-born population - Senegal (%)
Place of birth for the foreign-born population - Sierra Leone (%)
Place of birth for the foreign-born population - Other Western Africa (%)
Place of birth for the foreign-born population - Australia (%)
Place of birth for the foreign-born population - New Zealand (%)
Place of birth for the foreign-born population - Fiji (%)
Place of birth for the foreign-born population - Micronesia (%)
Place of birth for the foreign-born population - Bahamas (%)
Place of birth for the foreign-born population - Barbados (%)
Place of birth for the foreign-born population - Cuba (%)
Place of birth for the foreign-born population - Dominica (%)
Place of birth for the foreign-born population - Dominican Republic (%)
Place of birth for the foreign-born population - Grenada (%)
Place of birth for the foreign-born population - Haiti (%)
Place of birth for the foreign-born population - Jamaica (%)
Place of birth for the foreign-born population - St. Vincent and the Grenadines (%)
Place of birth for the foreign-born population - Trinidad and Tobago (%)
Place of birth for the foreign-born population - West Indies (%)
Place of birth for the foreign-born population - Other Caribbean (%)
Place of birth for the foreign-born population - Belize (%)
Place of birth for the foreign-born population - Costa Rica (%)
Place of birth for the foreign-born population - El Salvador (%)
Place of birth for the foreign-born population - Guatemala (%)
Place of birth for the foreign-born population - Honduras (%)
Place of birth for the foreign-born population - Mexico (%)
Place of birth for the foreign-born population - Nicaragua (%)
Place of birth for the foreign-born population - Panama (%)
Place of birth for the foreign-born population - Other Central America (%)
Place of birth for the foreign-born population - Argentina (%)
Place of birth for the foreign-born population - Bolivia (%)
Place of birth for the foreign-born population - Brazil (%)
Place of birth for the foreign-born population - Chile (%)
Place of birth for the foreign-born population - Colombia (%)
Place of birth for the foreign-born population - Ecuador (%)
Place of birth for the foreign-born population - Guyana (%)
Place of birth for the foreign-born population - Peru (%)
Place of birth for the foreign-born population - Uruguay (%)
Place of birth for the foreign-born population - Venezuela (%)
Place of birth for the foreign-born population - Other South America (%)
Place of birth for the foreign-born population - Canada (%)
Place of birth for the foreign-born population - Other Northern America (%)
Place of birth for the foreign-born population - Other (%)
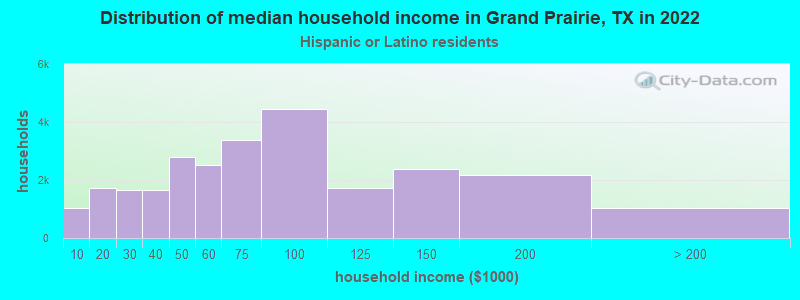
According to 2022 data, the most numerous races in Grand Prairie, TX are Hispanic (94,133 residents), White alone (38,377 residents), and Black alone (44,832 residents). 56.3% of Grand Prairie residents speak English at home. 25.1% of Grand Prairie, TX residents are foreign-born (16.0% born in Latin America, 4.6% born in Asia, 2.8% born in Africa), which is 32.3% greater than the foreign-born rate of 17.0% across the entire state of Texas.
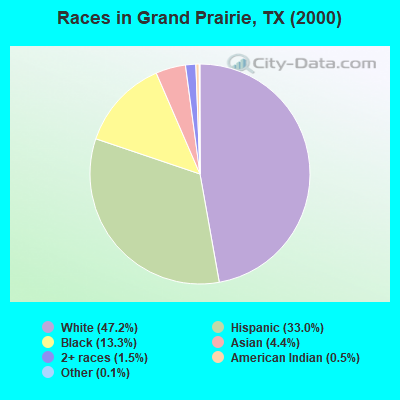
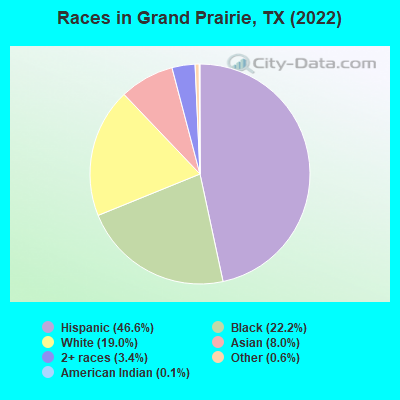
Race distribution in Grand Prairie
2000 2022
60,118 47.2% White alone 42,038 33.0% Hispanic 16,948 13.3% Black alone 5,574 4.4% Asian alone 1,855 1.5% Two or more races 678 0.5% American Indian alone 157 0.1% Other race alone 59 0.05% Native Hawaiian and Other
94,133 46.6% Hispanic 44,832 22.2% Black alone 38,377 19.0% White alone 16,117 8.0% Asian alone 6,933 3.4% Two or more races 1,167 0.6% Other race alone 232 0.1% American Indian alone
2000 2022
10,933,313 52.4% White alone 6,669,666 32.0% Hispanic 2,364,255 11.3% Black alone 554,445 2.7% Asian alone 230,567 1.1% Two or more races 68,859 0.3% American Indian alone 19,958 0.10% Other race alone 10,757 0.05% Native Hawaiian and Other
12,070,642 40.2% Hispanic 11,683,430 38.9% White alone 3,508,706 11.7% Black alone 1,608,173 5.4% Asian alone 956,560 3.2% Two or more races 125,763 0.4% Other race alone 47,023 0.2% American Indian alone 29,275 0.10% Native Hawaiian and Other
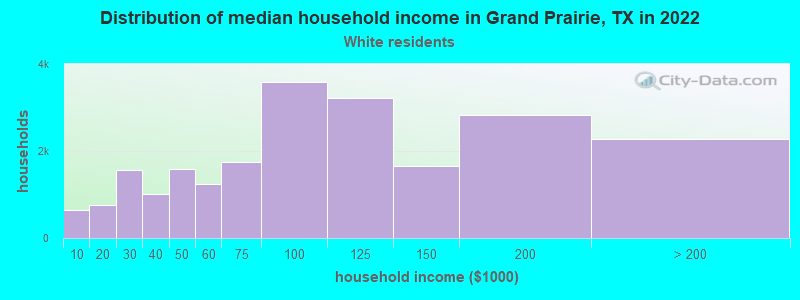
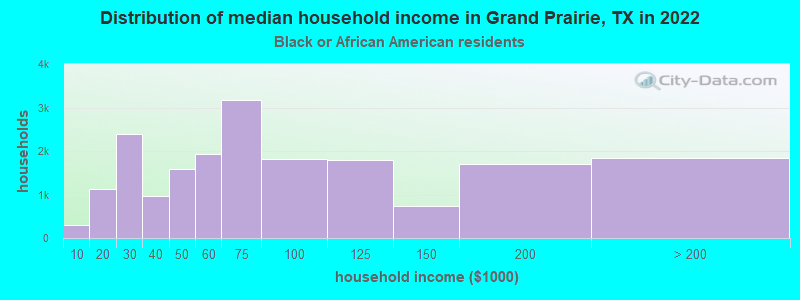
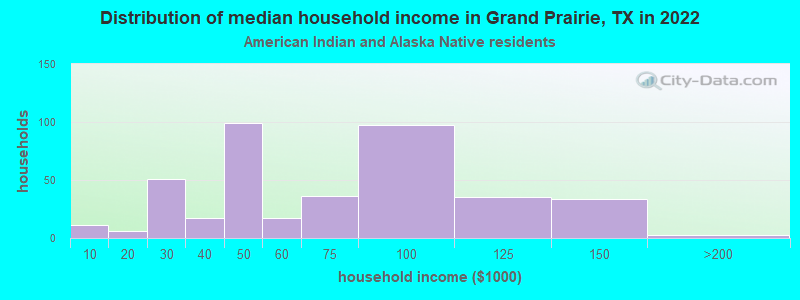
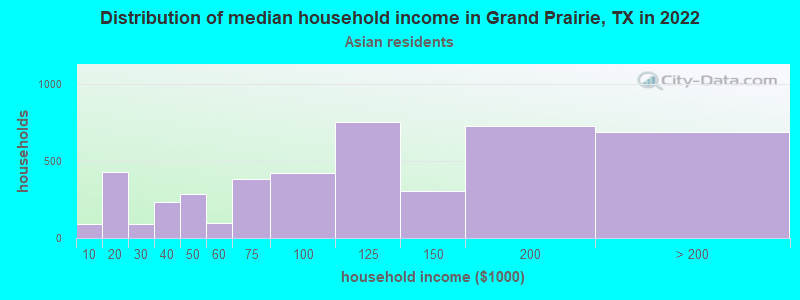
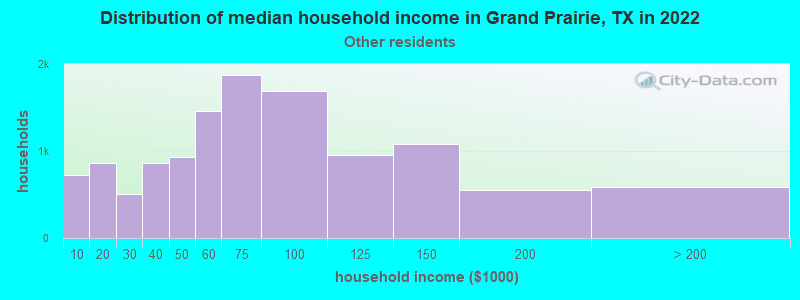
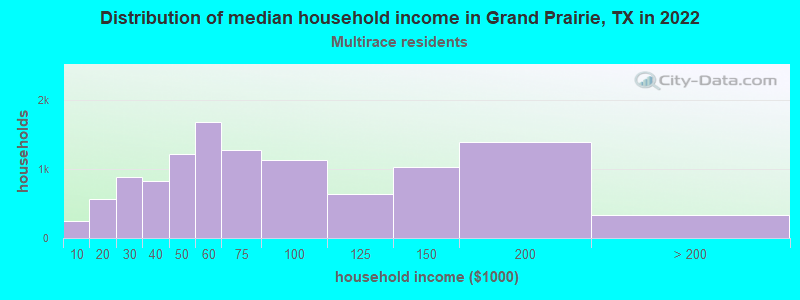
Income and house value in Grand Prairie Median household income in 2022 $100,845 White non-Hispanic householders$66,649 Black householders$109,240 American Indian and Alaska Native householders$115,833 Asian householders$63,868 Some other race householders$63,845 Two or more races householders$66,241 Hispanic or Latino race householdersMedian 2022 house value $295,656 White Non-Hispanic householders$327,138 Black or African American householders$199,499 American Indian or Alaska Native householders $356,225 Asian householders$325,085 Native Hawaiian and other Pacific Islander householders$227,217 Some other race householders$235,772 Two or more races householders$228,928 Hispanic or Latino householders
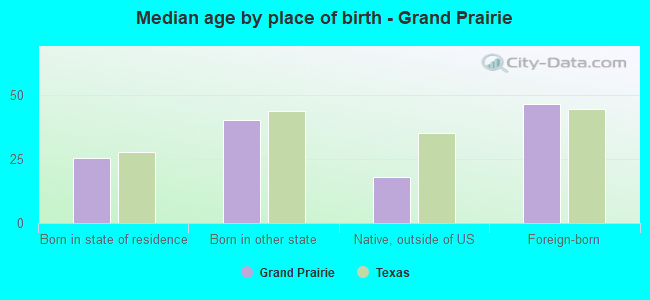
Median age by race in Grand Prairie
40.5 Median age for White residents40.2 40.8 35.9 Median age for Black or African American residents35.3 36.4 20.5 Median age for American Indian / Alaska Native residents19.2 24.2 36.5 Median age for Asian residents35.7 37.9 -666,666,666.0 Median age for Native Hawaiian / Pacific Islander residents-666,666,666.0 -666,666,666.0 33.6 Median age for Other race residents35.7 33.2 29.4 Median age for Two or more races residents26.7 30.9 48.3 Median age for White alone residents46.9 49.3 30.7 Median age for Hispanic or Latino residents30.5 30.9
Owner/renter occupied households by race in Grand Prairie
House owners and renters - White residents 14,507 65.6% Owner occupied7,592 34.4% Renter occupiedHouse owners and renters - Black or African American residents 9,828 50.7% Owner occupied9,547 49.3% Renter occupiedHouse owners and renters - American Indian / Alaska Native residents 321 75.4% Owner occupied105 24.6% Renter occupiedHouse owners and renters - Asian residents 4,178 89.3% Owner occupied498 10.7% Renter occupiedHouse owners and renters - Native Hawaiian / Pacific Islander residents 11 100.0% Owner occupiedHouse owners and renters - Other race residents 8,178 67.7% Owner occupied3,907 32.3% Renter occupiedHouse owners and renters - Two or more races residents 7,041 62.6% Owner occupied4,209 37.4% Renter occupiedHouse owners and renters - White alone residents 12,511 69.0% Owner occupied5,625 31.0% Renter occupiedHouse owners and renters - Hispanic or Latino residents 16,690 62.8% Owner occupied9,872 37.2% Renter occupied
Language usage in Grand Prairie
English speakers - Total 56.3% of residents of Grand Prairie speak English at home.
34.7% of residents speak Spanish at home 40,333 61.0% Speak English very well25,768 39.0% Speak English less than very well9.0% of residents speak other language at home 11,669 68.2% Speak English very well5,448 31.8% Speak English less than very well
English speakers - Born in the United States 83.2% of residents of Grand Prairie speak English at home.
15.7% of residents speak Spanish at home 3,947 61.3% Speak English very well2,497 38.7% Speak English less than very well1.0% of residents speak other language at home 255 60.0% Speak English very well170 40.0% Speak English less than very well
English speakers - Native, born elsewhere 59.7% of residents of Grand Prairie speak English at home.
15.8% of residents speak Spanish at home 331 66.6% Speak English very well166 33.4% Speak English less than very well24.5% of residents speak other language at home 645 83.4% Speak English very well128 16.6% Speak English less than very well
English speakers - Foreign-born 11.9% of residents of Grand Prairie speak English at home.
58.9% of residents speak Spanish at home 9,355 34.5% Speak English very well17,766 65.5% Speak English less than very well29.2% of residents speak other language at home 8,814 65.5% Speak English very well4,638 34.5% Speak English less than very well
White (Caucasian) - Speak only English Native:
78.2% (37,517)Foreign-born:
15.4% (637)
White (Caucasian) - Speak another language Native:
21.8% (10,437)Foreign-born:
84.6% (3,494)
Black or African American - Speak only English Native:
98.4% (37,147)Foreign-born:
32.1% (2,032)
Black or African American - Speak another language Native:
1.6% (598)Foreign-born:
67.9% (4,293)
American Indian / Alaska Native - Speak another language Native:
49.4% (414)Foreign-born:
100.0% (312)
Asian - Speak only English Native:
57.4% (3,880)Foreign-born:
11.5% (1,072)
Asian - Speak another language Native:
42.6% (2,881)Foreign-born:
88.5% (8,223)
Native Hawaiian / Pacific Islander - Speak only English Native:
41.2% (6)Foreign-born:
25.8% (15)
Native Hawaiian / Pacific Islander - Speak another language Native:
60.4% (9)Foreign-born:
58.7% (33)
Other race - Speak only English Native:
36.4% (9,020)Foreign-born:
5.3% (881)
Other race - Speak another language Native:
63.6% (15,767)Foreign-born:
94.7% (15,804)
Two or more races - Speak only English Native:
52.6% (13,535)Foreign-born:
9.6% (874)
Two or more races - Speak another language Native:
47.4% (12,183)Foreign-born:
90.4% (8,270)
White alone - Speak only English Native:
96.7% (34,945)Foreign-born:
44.6% (637)
White alone - Speak another language Native:
3.3% (1,199)Foreign-born:
55.4% (790)
Hispanic or Latino - Speak only English Native:
35.1% (20,469)Foreign-born:
5.4% (1,540)
Hispanic or Latino - Speak another language Native:
64.9% (37,835)Foreign-born:
94.6% (27,080)
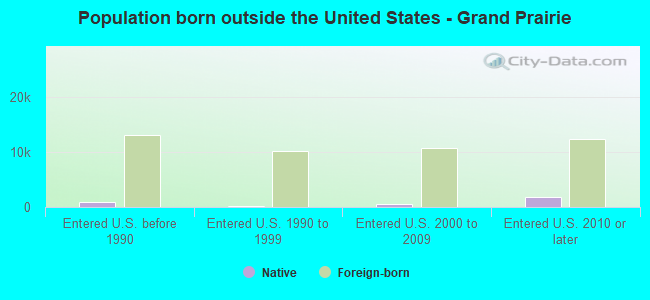
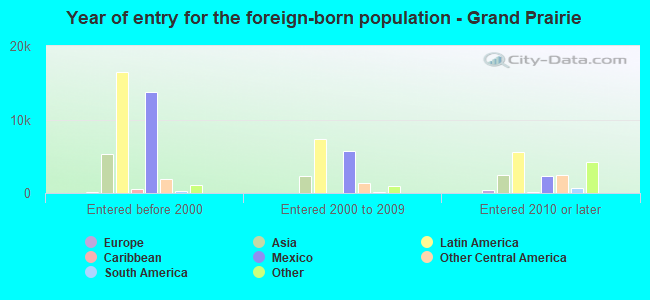
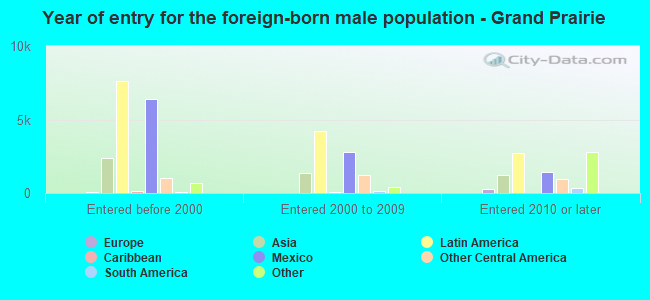
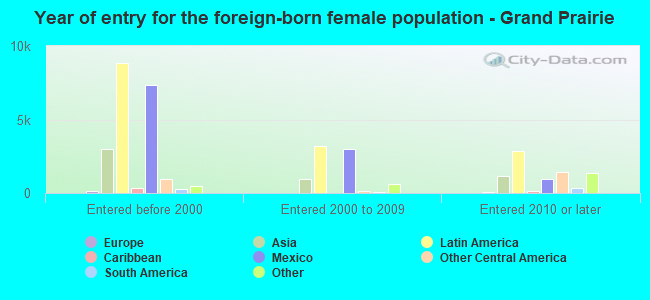
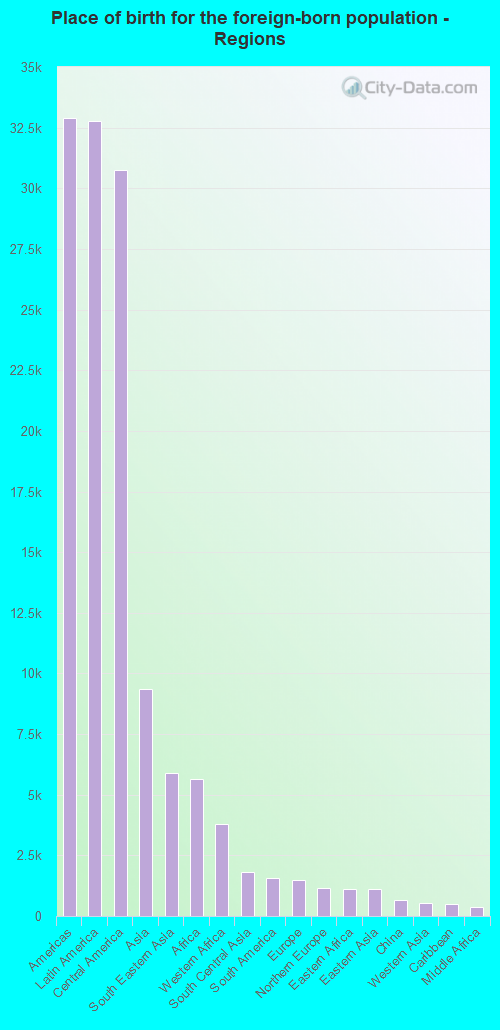
Foreign-born residents in Grand Prairie 49,449 residents are foreign born (16.0% Latin America , 4.6% Asia , 2.8% Africa ).
This city:
25.1%Texas:
17.1%
Marital status for residents in Grand Prairie Marital status - White (Caucasian) population 15 years and over
Males 31.7% Never married56.4% Now married2.0% Separated2.0% Widowed7.9% DivorcedFemales 24.4% Never married51.1% Now married0.8% Separated6.0% Widowed17.7% DivorcedWomen who gave birth in the past 12 months Now married:
45.8% (412)Unmarried:
54.2% (488)
Women who did not give birth in the past 12 months Now married:
47.3% (5,711)Unmarried:
52.7% (6,352)
Marital status - Black or African American population 15 years and over
Males 43.9% Never married46.1% Now married5.0% Separated0.0% Widowed5.0% DivorcedFemales 36.0% Never married41.5% Now married1.7% Separated5.8% Widowed14.9% DivorcedWomen who gave birth in the past 12 months Now married:
41.9% (372)Unmarried:
58.1% (515)
Women who did not give birth in the past 12 months Now married:
35.4% (4,019)Unmarried:
64.6% (7,344)
Marital status - American Indian / Alaska Native population 15 years and over
Males 47.8% Never married34.1% Now married1.3% Separated3.4% Widowed13.5% DivorcedFemales 38.9% Never married43.5% Now married0.0% Separated17.0% Widowed0.7% DivorcedWomen who gave birth in the past 12 months Now married:
0.0% (0)Unmarried:
100.0% (45)
Women who did not give birth in the past 12 months Now married:
51.0% (96)Unmarried:
49.0% (93)
Marital status - Asian population 15 years and over
Males 35.8% Never married59.5% Now married0.5% Separated1.8% Widowed2.3% DivorcedFemales 23.0% Never married61.6% Now married1.7% Separated7.2% Widowed6.5% DivorcedWomen who gave birth in the past 12 months Now married:
72.2% (130)Unmarried:
27.8% (50)
Women who did not give birth in the past 12 months Now married:
56.2% (2,293)Unmarried:
43.8% (1,788)
Marital status - Native Hawaiian / Pacific Islander population 15 years and over
Males 15.9% Never married29.5% Now married0.0% Separated0.0% Widowed54.5% DivorcedFemales 100.0% Never married0.0% Now married0.0% Separated0.0% Widowed0.0% DivorcedWomen who did not give birth in the past 12 months Now married:
0.0% (0)Unmarried:
100.0% (13)
Marital status - Other race population 15 years and over
Males 28.7% Never married62.5% Now married2.4% Separated2.5% Widowed3.9% DivorcedFemales 27.0% Never married52.9% Now married1.5% Separated5.5% Widowed13.1% DivorcedWomen who gave birth in the past 12 months Now married:
25.0% (51)Unmarried:
75.0% (153)
Women who did not give birth in the past 12 months Now married:
51.7% (6,266)Unmarried:
48.3% (5,843)
Marital status - Two or more races population 15 years and over
Males 44.3% Never married51.8% Now married1.6% Separated0.4% Widowed1.9% DivorcedFemales 37.7% Never married45.1% Now married2.8% Separated3.5% Widowed10.9% DivorcedWomen who gave birth in the past 12 months Now married:
66.6% (638)Unmarried:
33.4% (320)
Women who did not give birth in the past 12 months Now married:
37.3% (3,209)Unmarried:
62.7% (5,404)
Marital status - White alone, not Hispanic / Latino population 15 years and over
Males 26.0% Never married60.9% Now married2.6% Separated2.6% Widowed7.9% DivorcedFemales 20.8% Never married53.5% Now married0.8% Separated7.1% Widowed17.9% DivorcedWomen who gave birth in the past 12 months Now married:
58.0% (196)Unmarried:
42.0% (142)
Women who did not give birth in the past 12 months Now married:
50.5% (4,376)Unmarried:
49.5% (4,296)
Marital status - Hispanic or Latino population 15 years and over
Males 38.7% Never married54.9% Now married1.7% Separated1.3% Widowed3.3% DivorcedFemales 33.0% Never married48.2% Now married1.9% Separated4.2% Widowed12.7% DivorcedWomen who gave birth in the past 12 months Now married:
48.9% (905)Unmarried:
51.1% (944)
Women who did not give birth in the past 12 months Now married:
45.2% (10,923)Unmarried:
54.8% (13,227)
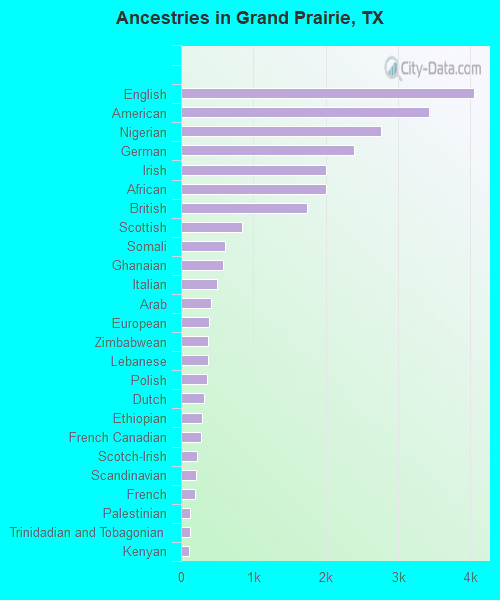
Ancestries in Grand Prairie
4,053 3.2% English3,426 2.7% American2,761 2.1% Nigerian2,391 1.9% German2,009 1.6% Irish2,005 1.6% African1,744 1.4% British847 0.7% Scottish611 0.5% Somali578 0.5% Ghanaian500 0.4% Italian421 0.3% Arab388 0.3% European377 0.3% Zimbabwean373 0.3% Lebanese355 0.3% Polish316 0.2% Dutch292 0.2% Ethiopian278 0.2% French Canadian219 0.2% Scotch-Irish208 0.2% Scandinavian199 0.2% French122 0.10% Palestinian118 0.09% Trinidadian and Tobagonian115 0.09% Kenyan108 0.08% Welsh97 0.08% Norwegian94 0.07% Greek94 0.07% Swedish86 0.07% Czech75 0.06% Portuguese74 0.06% Liberian63 0.05% Romanian62 0.05% Russian58 0.05% Belizean51 0.04% British West Indian48 0.04% Jamaican47 0.04% Canadian46 0.04% Belgian46 0.04% Czechoslovakian40 0.03% Jordanian37 0.03% Turkish35 0.03% Bermudan31 0.02% Lithuanian30 0.02% Finnish27 0.02% Guyanese25 0.02% Moroccan23 0.02% Iraqi18 0.01% Egyptian16 0.01% Northern European16 0.01% Iranian12 0.01% Austrian12 0.01% Croatian11 0.01% Eastern European10 0.01% Danish8 0.01% Hungarian
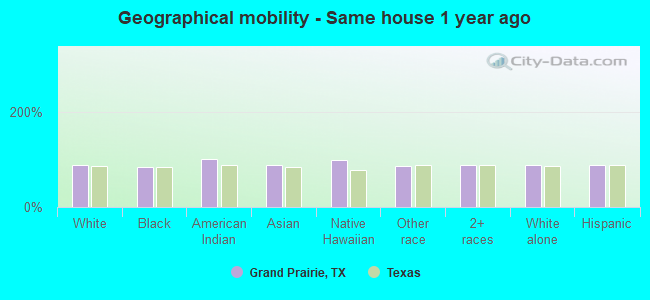
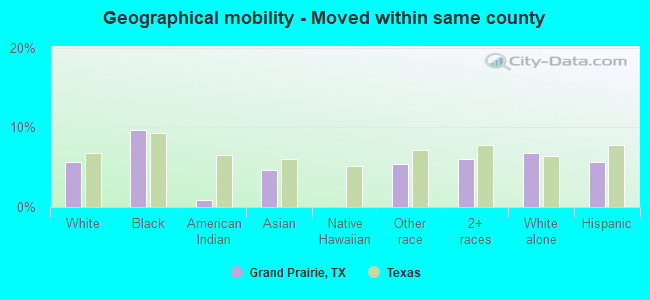
Geographical mobility in Grand Prairie Same house 1 year ago 47,497 87.9% White (Caucasian)37,903 83.6% Black or African American1,198 100.0% American Indian / Alaska Native14,430 88.9% Asian75 98.2% Native Hawaiian / Pacific Islander37,318 85.7% Other race33,448 88.2% Two or more races33,147 86.7% White alone, not Hispanic / Latino80,799 87.7% Hispanic or LatinoMoved within same county 3,082 5.7% White / Caucasian4,377 9.7% Black or African American10 0.8% American Indian / Alaska Native747 4.6% Asian2,371 5.4% Other race2,299 6.1% Two or more races2,578 6.7% White alone, not Hispanic / Latino5,180 5.6% Hispanic or LatinoMoved within same state 2,736 5.1% White / Caucasian2,259 5.0% Black or African American750 4.6% Asian2,518 5.8% Other race1,394 3.7% Two or more races1,999 5.2% White alone, not Hispanic / Latino4,051 4.4% Hispanic or LatinoMoved from different state 704 1.3% White / Caucasian790 1.7% Black or African American4 0.4% American Indian / Alaska Native304 1.9% Asian310 0.7% Other race734 1.9% Two or more races510 1.3% White alone, not Hispanic / Latino1,070 1.2% Hispanic or LatinoMoved from abroad 1,004 2.3% Other race33 0.1% Two or more races1,037 1.1% Hispanic or Latino
Children Nativity (place of birth) in Grand Prairie
Children under 6 years - Living with two parents Both parents native 2,764 100.0% NativeBoth parents foreign-born 2,526 88.3% Native336 11.7% Foreign-bornOne native, one foreign-born parent 1,813 100.0% NativeChildren under 6 years - Living with one parent Native parent 4,557 100.0% NativeForeign-born parent 1,480 100.0% NativeChildren 6 to 17 years - Living with two parents Both parents native 11,622 100.0% NativeBoth parents foreign-born 9,275 94.4% Native546 5.6% Foreign-bornOne native, one foreign-born parent 5,674 79.1% Native1,501 20.9% Foreign-bornChildren 6 to 17 years - Living with one parent Native parent 6,958 100.0% NativeForeign-born parent 2,729 50.5% Native2,671 49.5% Foreign-born
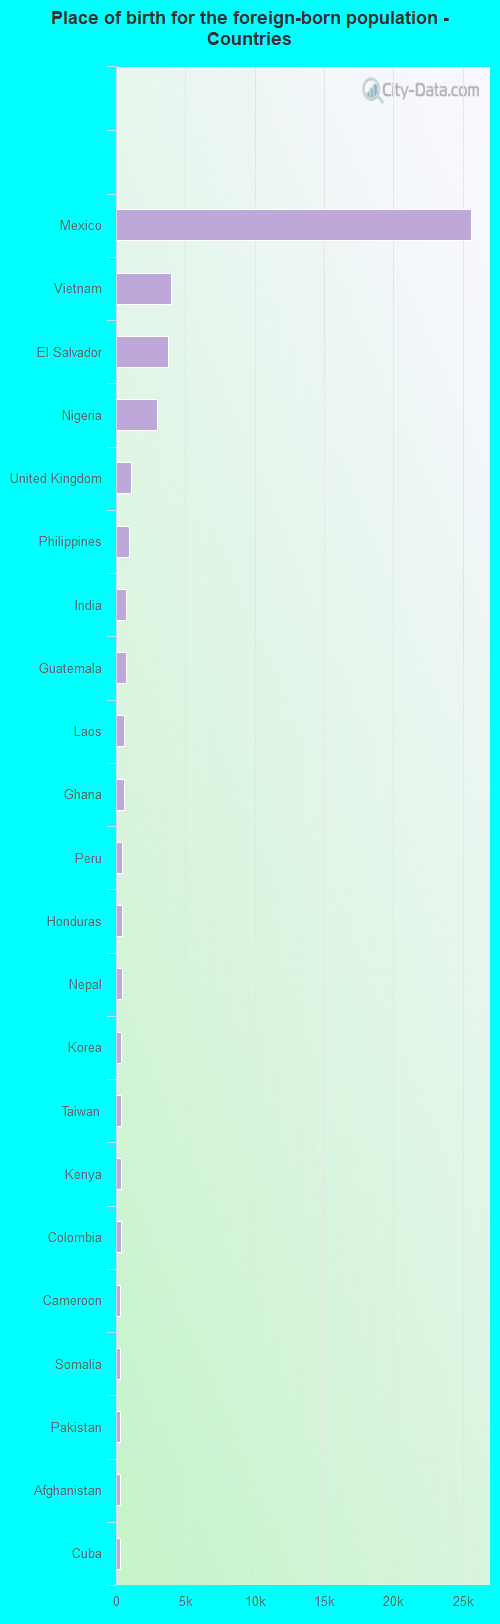
Place of birth for residents in Grand Prairie 32,917 Americas32,781 Latin America30,746 Central America9,367 Asia5,890 South Eastern Asia5,629 Africa3,800 Western Africa1,803 South Central Asia1,552 South America1,477 Europe1,151 Northern Europe1,128 Eastern Africa1,119 Eastern Asia651 China526 Western Asia482 Caribbean379 Middle Africa191 Eastern Europe135 Northern America120 Western Europe87 Northern Africa56 Oceania14 Southern Europe10 Southern Africa7 Australia and New Zealand Subregion25,618 Mexico3,933 Vietnam3,783 El Salvador2,939 Nigeria1,058 United Kingdom956 Philippines742 India701 Guatemala588 Laos566 Ghana454 Peru433 Honduras418 Nepal372 Korea350 Taiwan331 Kenya331 Colombia306 Cameroon297 Somalia295 Pakistan287 Afghanistan262 Cuba226 China223 Ecuador203 Zimbabwe197 Kuwait193 Liberia179 Guyana172 Ethiopia129 Iraq123 Canada121 Venezuela120 Brazil119 Thailand118 Cambodia115 Russia110 Germany99 Dominican Republic95 Japan88 Nicaragua84 Malaysia83 Panama81 Saudi Arabia74 Hong Kong71 Argentina70 Israel60 England58 Bangladesh53 Indonesia50 Romania50 Ivory Coast46 Congo46 Trinidad and Tobago44 Algeria37 Belize36 Tanzania35 Morocco35 Burma (Myanmar)31 Eritrea29 Jamaica26 Uganda25 Democratic Republic of Congo (Zaire)23 Jordan23 Senegal14 Moldova14 Portugal13 Chile11 Lebanon11 United Arab Emirates11 Bosnia and Herzegovina10 South Africa9 France7 New Zealand5 Sudan5 Ireland2 Iran2 Egypt
Grandparents responsible for own grandchildren in Grand Prairie
Grandparents (30 to 59 years) White / Caucasian 113 17.1% Responsible for grandchildren551 82.9% Not responsible for grandchildrenBlack or African American 178 59.1% Responsible for grandchildren123 40.9% Not responsible for grandchildrenAmerican Indian / Alaska Native 56 100.0% Not responsible for grandchildrenAsian 106 71.5% Responsible for grandchildren42 28.5% Not responsible for grandchildrenNative Hawaiian / Pacific Islander 12 100.0% Not responsible for grandchildrenOther race 174 21.2% Responsible for grandchildren645 78.8% Not responsible for grandchildrenTwo or more races 782 47.3% Responsible for grandchildren873 52.7% Not responsible for grandchildrenWhite alone, not Hispanic / Latino 181 49.3% Responsible for grandchildren187 50.7% Not responsible for grandchildrenHispanic or Latino 956 40.0% Responsible for grandchildren1,434 60.0% Not responsible for grandchildrenGrandparents (60 years and over) White / Caucasian 287 42.4% Responsible for grandchildren389 57.6% Not responsible for grandchildrenBlack or African American 74 14.0% Responsible for grandchildren455 86.0% Not responsible for grandchildrenAmerican Indian / Alaska Native 11 100.0% Responsible for grandchildrenAsian 87 47.4% Responsible for grandchildren97 52.6% Not responsible for grandchildrenOther race 248 21.2% Responsible for grandchildren924 78.8% Not responsible for grandchildrenTwo or more races 266 100.0% Not responsible for grandchildrenWhite alone, not Hispanic / Latino 221 37.6% Responsible for grandchildren366 62.4% Not responsible for grandchildrenHispanic or Latino 432 40.8% Responsible for grandchildren627 59.2% Not responsible for grandchildren