Races in Grandview, Wisconsin (WI) Detailed Stats
Ancestries, Foreign-born residents, place of birth
0.8% of Grandview, WI residents are foreign-born , which is 503.7% less than the foreign-born rate of 5.0% across the entire state of Wisconsin.
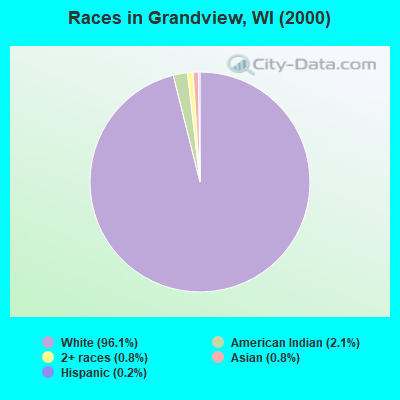
Race distribution in Grandview

- 46496.1%White alone
- 102.1%American Indian alone
- 40.8%Two or more races
- 40.8%Asian alone
- 10.2%Hispanic
2000
2022
-
- 4,681,63087.3%White alone
- 300,2455.6%Black alone
- 192,9213.6%Hispanic
- 87,9951.6%Asian alone
- 51,9211.0%Two or more races
- 43,9800.8%American Indian alone
- 3,6370.07%Other race alone
- 1,3460.03%Native Hawaiian and Other
Pacific Islander alone

-
- 4,654,03179.0%White alone
- 447,0227.6%Hispanic
- 345,6785.9%Black alone
- 217,5323.7%Two or more races
- 172,2422.9%Asian alone
- 33,7620.6%American Indian alone
- 19,6800.3%Other race alone
- 2,5920.04%Native Hawaiian and Other
Pacific Islander alone

Income and house value in Grandview
- Median household income in 2022
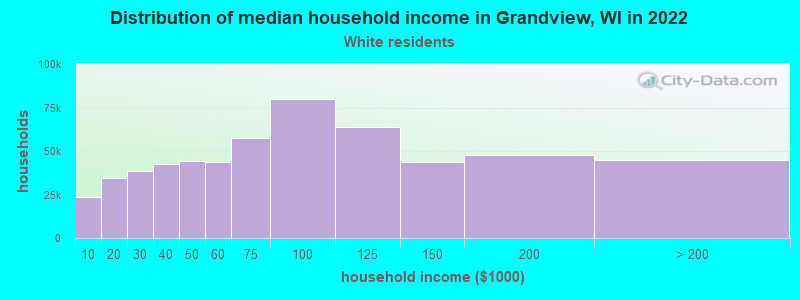
- $40,966White non-Hispanic householders
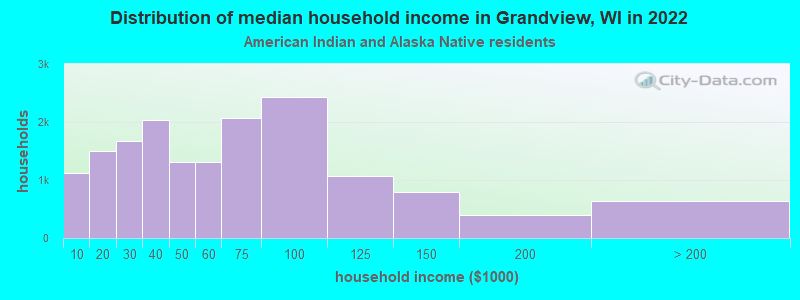
- $107,743American Indian and Alaska Native householders
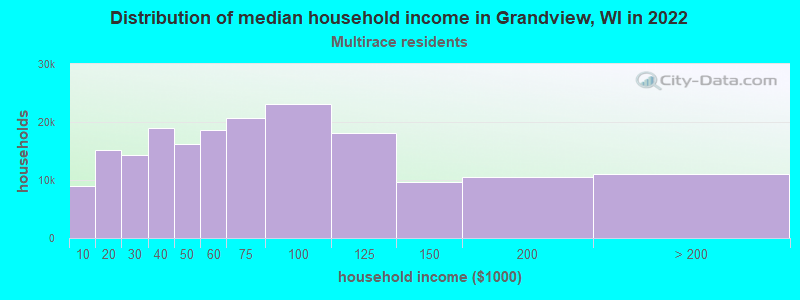
- $172,838Two or more races householders
- Median 2022 house value
- $196,222White Non-Hispanic householders
- $73,717American Indian or Alaska Native householders
- $227,853Two or more races householders
Household income for White non-Hispanic householders
Household income for American Indian and Alaska Native householders
Household income for Two or more races householders
Foreign-born residents in Grandview
4 residents are foreign born
| This city: | 0.8% |
| Wisconsin: | 3.6% |
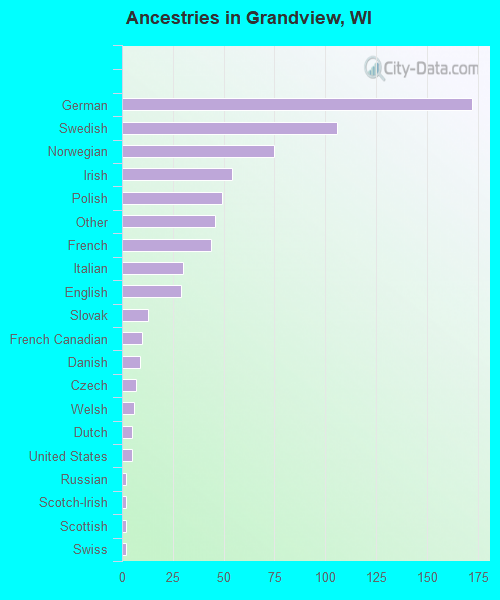
Ancestries in Grandview

- 17225.7%German
- 10615.9%Swedish
- 7511.2%Norwegian
- 548.1%Irish
- 497.3%Polish
- 466.9%Other
- 446.6%French
- 304.5%Italian
- 294.3%English
- 131.9%Slovak
- 101.5%French Canadian
- 91.3%Danish
- 71.0%Czech
- 60.9%Welsh
- 50.7%Dutch
- 50.7%United States
- 20.3%Russian
- 20.3%Scotch-Irish
- 20.3%Scottish
- 20.3%Swiss
Zip codes: 54821.