Races in Greater Northdale, Florida (FL) Detailed Stats
Ancestries, Foreign-born residents, place of birth

Recent posts about races in Greater Northdale, Florida on our local forum with over 2,400,000 registered users:
 | Best Tampa suburbs that have excellent schools? (11 replies) |
| Neighborhoods 30-45 min Commute (15 replies) |
| Tampa-St. Petersberg is nation's worst for commuting, Forbes says. (29 replies) |
| Moving from Jacksonville Fl to Tampa (4 replies) |
11.9% of Greater Northdale, FL residents are foreign-born (6.0% born in Latin America, 3.2% born in Asia, 1.9% born in Europe), which is 76.0% less than the foreign-born rate of 21.0% across the entire state of Florida.
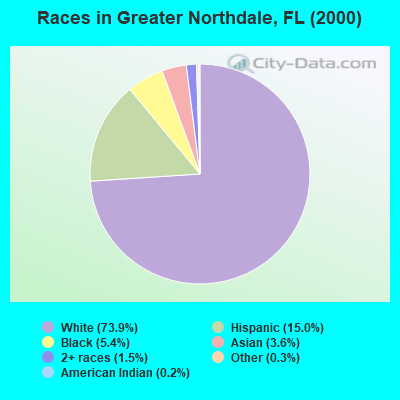
Race distribution in Greater Northdale

- 15,12573.9%White alone
- 3,07415.0%Hispanic
- 1,1065.4%Black alone
- 7453.6%Asian alone
- 2971.5%Two or more races
- 600.3%Other race alone
- 360.2%American Indian alone
- 180.09%Native Hawaiian and Other
Pacific Islander alone
2000
2022
-
- 10,458,50965.4%White alone
- 2,682,71516.8%Hispanic
- 2,264,26814.2%Black alone
- 261,6931.6%Asian alone
- 236,9541.5%Two or more races
- 42,3580.3%American Indian alone
- 28,9940.2%Other race alone
- 6,8870.04%Native Hawaiian and Other
Pacific Islander alone

-
- 11,309,40350.8%White alone
- 6,025,03927.1%Hispanic
- 3,241,01514.6%Black alone
- 861,6303.9%Two or more races
- 623,6922.8%Asian alone
- 152,0540.7%Other race alone
- 22,5040.1%American Indian alone
- 9,4860.04%Native Hawaiian and Other
Pacific Islander alone

Income and house value in Greater Northdale
- Median household income in 2022
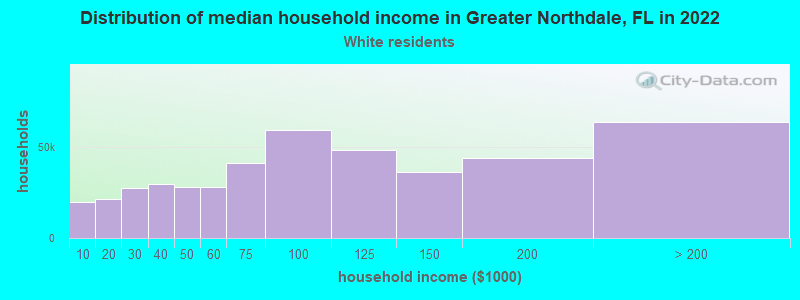
- $116,859White non-Hispanic householders
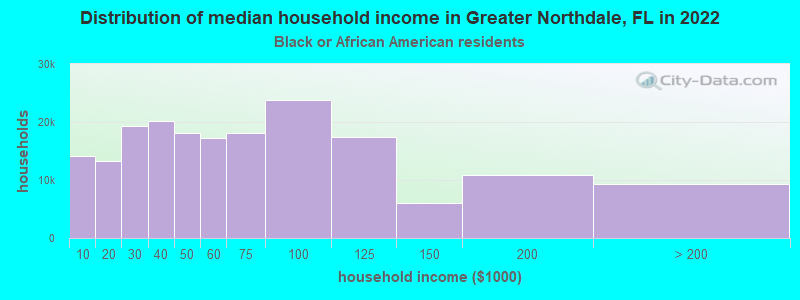
- $109,360Black householders
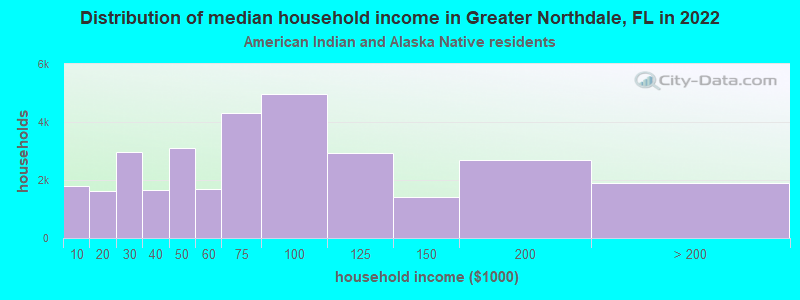
- $73,594American Indian and Alaska Native householders
- $128,894Asian householders
- $66,347Some other race householders
- $102,025Two or more races householders
- $93,642Hispanic or Latino race householders
- Median 2022 house value
- $462,421White Non-Hispanic householders
- $423,653Black or African American householders
- $275,774American Indian or Alaska Native householders
- $486,402Asian householders
- $523,571Some other race householders
- $442,837Two or more races householders
- $464,819Hispanic or Latino householders
Household income for White non-Hispanic householders
Household income for Black householders
Household income for American Indian and Alaska Native householders
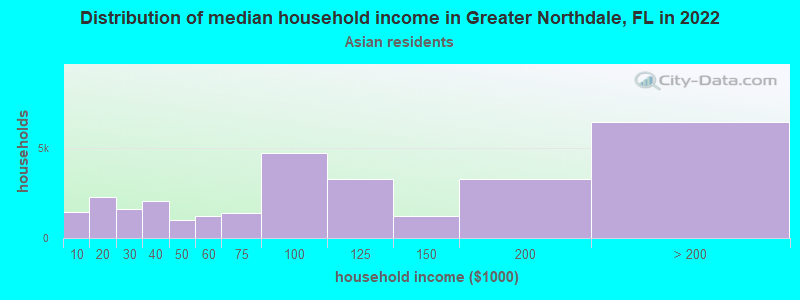
Household income for Asian householders
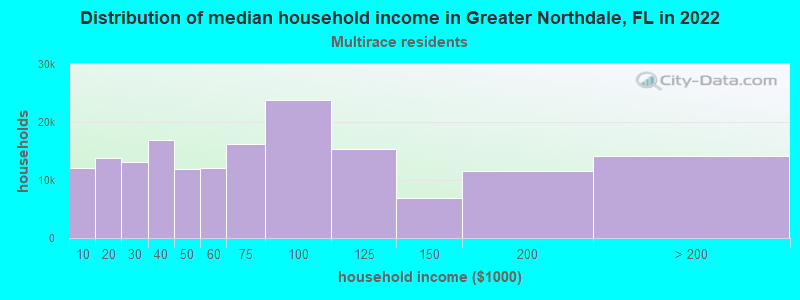
Household income for Two or more races householders
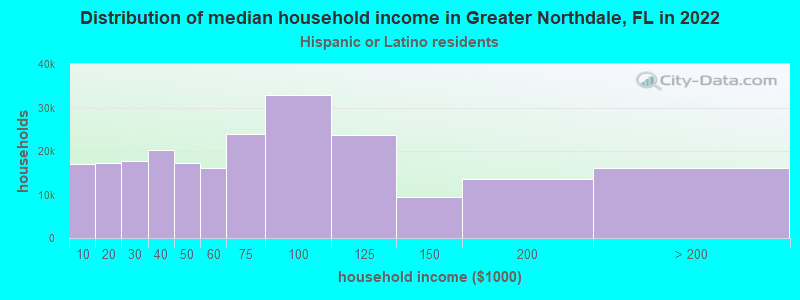
Household income for Hispanic or Latino race householders
Foreign-born residents in Greater Northdale
2,442 residents are foreign born (6.0% Latin America, 3.2% Asia, 1.9% Europe).
| This city: | 11.9% |
| Florida: | 16.7% |
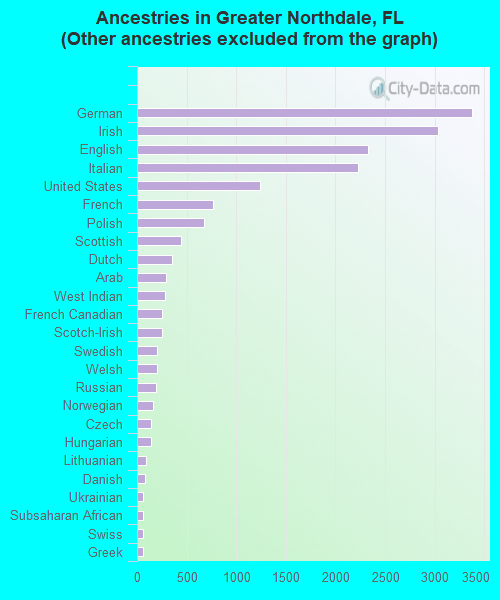
Ancestries in Greater Northdale

- 6,27326.9%Other
- 3,37814.5%German
- 3,03813.0%Irish
- 2,32810.0%English
- 2,2239.5%Italian
- 1,2445.3%United States
- 7663.3%French
- 6802.9%Polish
- 4481.9%Scottish
- 3571.5%Dutch
- 2921.3%Arab
- 2781.2%West Indian
- 2521.1%French Canadian
- 2521.1%Scotch-Irish
- 2050.9%Swedish
- 2030.9%Welsh
- 1930.8%Russian
- 1620.7%Norwegian
- 1400.6%Czech
- 1370.6%Hungarian
- 910.4%Lithuanian
- 810.3%Danish
- 620.3%Ukrainian
- 610.3%Subsaharan African
- 600.3%Swiss
- 570.2%Greek
- 450.2%Portuguese
- 430.2%Slovak
Zip codes: 33624.