Races in Greenfield, California (CA) Detailed Stats
Data:
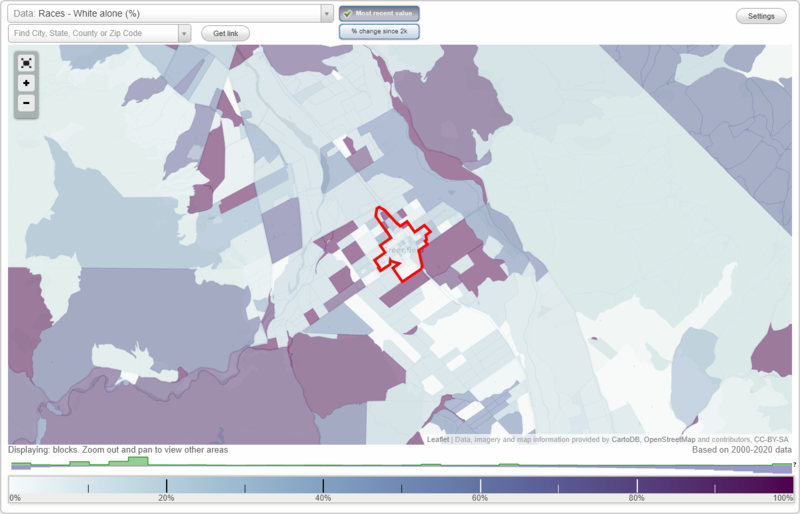
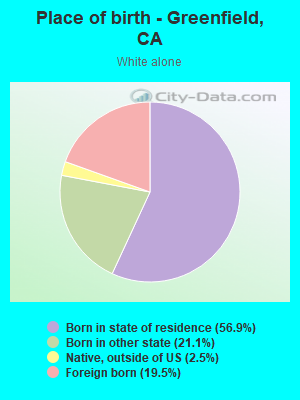
Races - White alone (%)
Races - White alone (% change since 2000)
Races - Black alone (%)
Races - Black alone (% change since 2000)
Races - American Indian alone (%)
Races - American Indian alone (% change since 2000)
Races - Asian alone (%)
Races - Asian alone (% change since 2000)
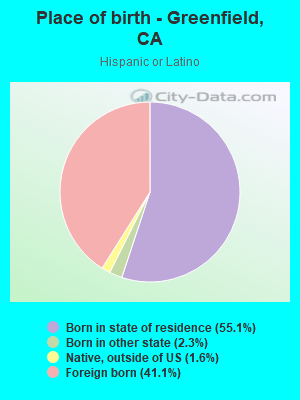
Races - Hispanic (%)
Races - Hispanic (% change since 2000)
Races - Native Hawaiian and Other Pacific Islander alone (%)
Races - Native Hawaiian and Other Pacific Islander alone (% change since 2000)
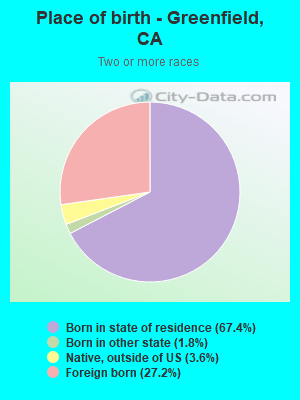
Races - Two or more races(%)
Races - Two or more races(% change since 2000)
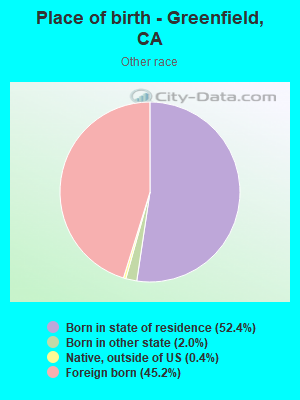
Races - Other race alone (%)
Races - Other race alone (% change since 2000)
Racial diversity
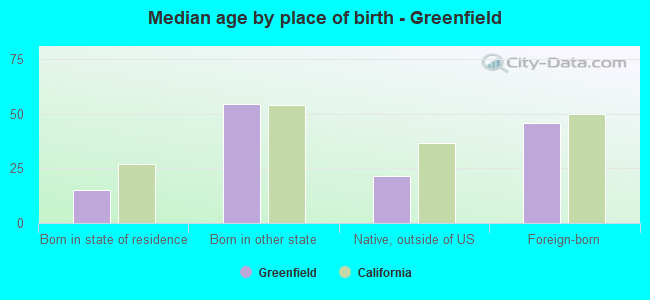
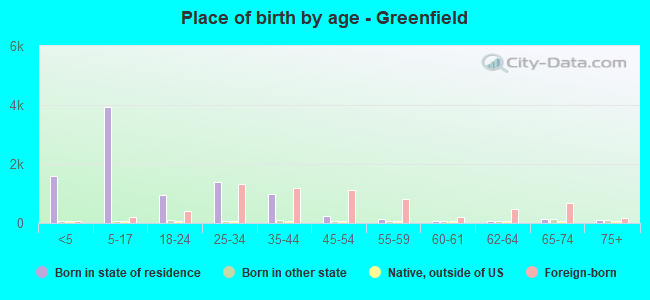
Place of birth - Born in state of residence (%)
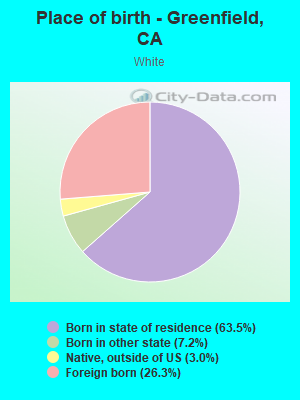
Place of birth - Born in state of residence (%) - White
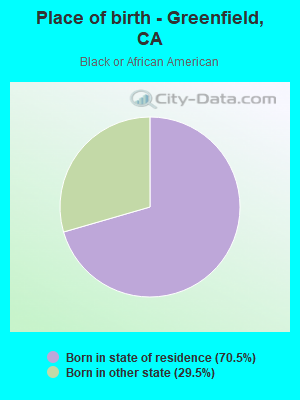
Place of birth - Born in state of residence (%) - Black or African American
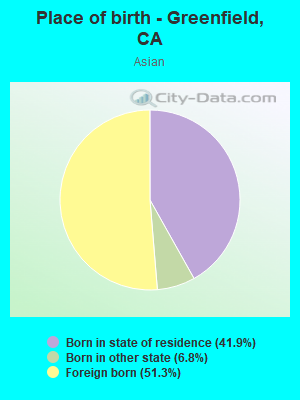
Place of birth - Born in state of residence (%) - Asian
Place of birth - Born in state of residence (%) - Hispanic or Latino
Place of birth - Born in state of residence (%) - American Indian and Alaska Native
Place of birth - Born in state of residence (%) - Multirace
Place of birth - Born in state of residence (%) - Other Race
Place of birth - Born in other state (%)
Place of birth - Born in other state (%) - White
Place of birth - Born in other state (%) - Black or African American
Place of birth - Born in other state (%) - Asian
Place of birth - Born in other state (%) - Hispanic or Latino
Place of birth - Born in other state (%) - American Indian and Alaska Native
Place of birth - Born in other state (%) - Multirace
Place of birth - Born in other state (%) - Other Race
Place of birth - Native, outside of US (%)
Place of birth - Native, outside of US (%) - White
Place of birth - Native, outside of US (%) - Black or African American
Place of birth - Native, outside of US (%) - Asian
Place of birth - Native, outside of US (%) - Hispanic or Latino
Place of birth - Native, outside of US (%) - American Indian and Alaska Native
Place of birth - Native, outside of US (%) - Multirace
Place of birth - Native, outside of US (%) - Other Race
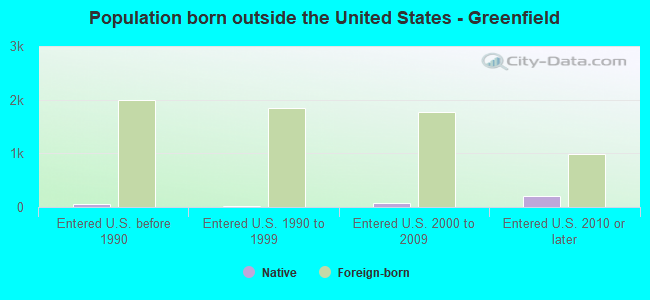
Place of birth - Foreign born (%)
Place of birth - Foreign born (%) - White
Place of birth - Foreign born (%) - Black or African American
Place of birth - Foreign born (%) - Asian
Place of birth - Foreign born (%) - Hispanic or Latino
Place of birth - Foreign born (%) - American Indian and Alaska Native
Place of birth - Foreign born (%) - Multirace
Place of birth - Foreign born (%) - Other Race
Residents speaking English at home (%)
Residents speaking English at home - Born in the United States (%)
Residents speaking English at home - Native, born elsewhere (%)
Residents speaking English at home - Foreign born (%)
Residents speaking Spanish at home (%)
Residents speaking Spanish at home - Born in the United States (%)
Residents speaking Spanish at home - Native, born elsewhere (%)
Residents speaking Spanish at home - Foreign born (%)
Residents speaking other language at home (%)
Residents speaking other language at home - Born in the United States (%)
Residents speaking other language at home - Native, born elsewhere (%)
Residents speaking other language at home - Foreign born (%)
Marital status - Never married (%)
Marital status - Now married (%)
Marital status - Separated (%)
Marital status - Widowed (%)
Marital status - Divorced (%)
Ancestries Reported - Arab (%)
Ancestries Reported - Czech (%)
Ancestries Reported - Danish (%)
Ancestries Reported - Dutch (%)
Ancestries Reported - English (%)
Ancestries Reported - French (%)
Ancestries Reported - French Canadian (%)
Ancestries Reported - German (%)
Ancestries Reported - Greek (%)
Ancestries Reported - Hungarian (%)
Ancestries Reported - Irish (%)
Ancestries Reported - Italian (%)
Ancestries Reported - Lithuanian (%)
Ancestries Reported - Norwegian (%)
Ancestries Reported - Polish (%)
Ancestries Reported - Portuguese (%)
Ancestries Reported - Russian (%)
Ancestries Reported - Scotch-Irish (%)
Ancestries Reported - Scottish (%)
Ancestries Reported - Slovak (%)
Ancestries Reported - Subsaharan African (%)
Ancestries Reported - Swedish (%)
Ancestries Reported - Swiss (%)
Ancestries Reported - Ukrainian (%)
Ancestries Reported - United States (%)
Ancestries Reported - Welsh (%)
Ancestries Reported - West Indian (%)
Ancestries Reported - Other (%)
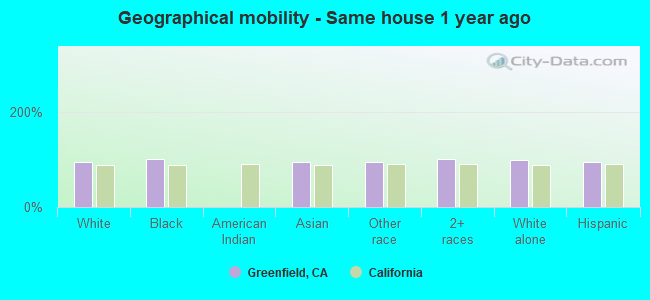
Geographical mobility - Same house 1 year ago (%)
Geographical mobility - Same house 1 year ago (%) - White
Geographical mobility - Same house 1 year ago (%) - Black or African American
Geographical mobility - Same house 1 year ago (%) - Asian
Geographical mobility - Same house 1 year ago (%) - Hispanic or Latino
Geographical mobility - Same house 1 year ago (%) - American Indian and Alaska Native
Geographical mobility - Same house 1 year ago (%) - Multirace
Geographical mobility - Same house 1 year ago (%) - Other Race
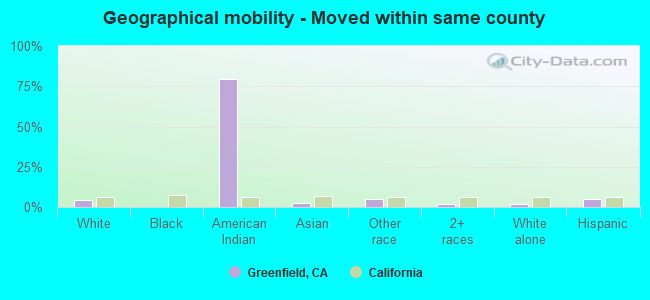
Geographical mobility - Moved within same county (%)
Geographical mobility - Moved within same county (%) - White
Geographical mobility - Moved within same county (%) - Black or African American
Geographical mobility - Moved within same county (%) - Asian
Geographical mobility - Moved within same county (%) - Hispanic or Latino
Geographical mobility - Moved within same county (%) - American Indian and Alaska Native
Geographical mobility - Moved within same county (%) - Multirace
Geographical mobility - Moved within same county (%) - Other Race
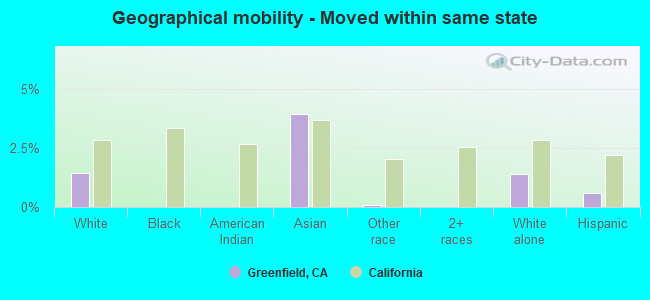
Geographical mobility - Moved from different county within same state (%)
Geographical mobility - Moved from different county within same state (%) - White
Geographical mobility - Moved from different county within same state (%) - Black or African American
Geographical mobility - Moved from different county within same state (%) - Asian
Geographical mobility - Moved from different county within same state (%) - Hispanic or Latino
Geographical mobility - Moved from different county within same state (%) - American Indian and Alaska Native
Geographical mobility - Moved from different county within same state (%) - Multirace
Geographical mobility - Moved from different county within same state (%) - Other Race
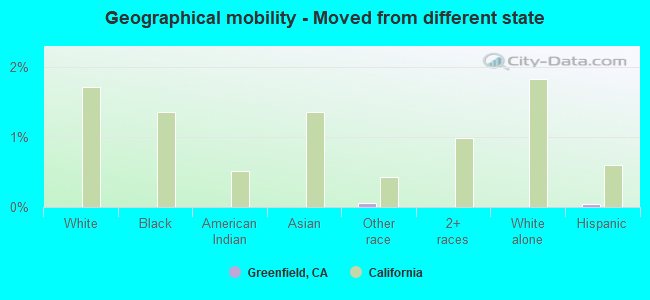
Geographical mobility - Moved from different state (%)
Geographical mobility - Moved from different state (%) - White
Geographical mobility - Moved from different state (%) - Black or African American
Geographical mobility - Moved from different state (%) - Asian
Geographical mobility - Moved from different state (%) - Hispanic or Latino
Geographical mobility - Moved from different state (%) - American Indian and Alaska Native
Geographical mobility - Moved from different state (%) - Multirace
Geographical mobility - Moved from different state (%) - Other Race
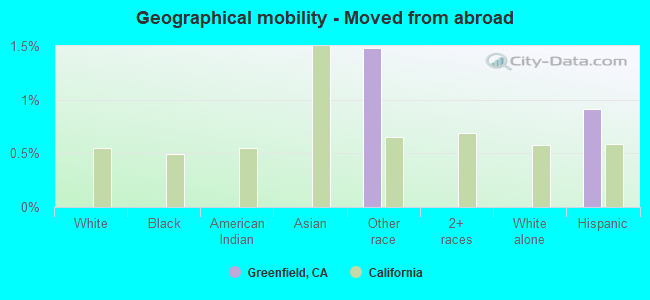
Geographical mobility - Moved from abroad (%)
Geographical mobility - Moved from abroad (%) - White
Geographical mobility - Moved from abroad (%) - Black or African American
Geographical mobility - Moved from abroad (%) - Asian
Geographical mobility - Moved from abroad (%) - Hispanic or Latino
Geographical mobility - Moved from abroad (%) - American Indian and Alaska Native
Geographical mobility - Moved from abroad (%) - Multirace
Geographical mobility - Moved from abroad (%) - Other Race
Place of birth for the foreign-born population - Ireland (%)
Place of birth for the foreign-born population - Denmark (%)
Place of birth for the foreign-born population - Norway (%)
Place of birth for the foreign-born population - Sweden (%)
Place of birth for the foreign-born population - United Kingdom (%)
Place of birth for the foreign-born population - England (%)
Place of birth for the foreign-born population - Scotland (%)
Place of birth for the foreign-born population - Other Northern Europe (%)
Place of birth for the foreign-born population - Austria (%)
Place of birth for the foreign-born population - Belgium (%)
Place of birth for the foreign-born population - France (%)
Place of birth for the foreign-born population - Germany (%)
Place of birth for the foreign-born population - Netherlands (%)
Place of birth for the foreign-born population - Switzerland (%)
Place of birth for the foreign-born population - Other Western Europe (%)
Place of birth for the foreign-born population - Greece (%)
Place of birth for the foreign-born population - Italy (%)
Place of birth for the foreign-born population - Portugal (%)
Place of birth for the foreign-born population - Spain (%)
Place of birth for the foreign-born population - Other Southern Europe (%)
Place of birth for the foreign-born population - Albania (%)
Place of birth for the foreign-born population - Belarus (%)
Place of birth for the foreign-born population - Bosnia and Herzegovina (%)
Place of birth for the foreign-born population - Bulgaria (%)
Place of birth for the foreign-born population - Croatia (%)
Place of birth for the foreign-born population - Czechoslovakia (%)
Place of birth for the foreign-born population - Hungary (%)
Place of birth for the foreign-born population - Latvia (%)
Place of birth for the foreign-born population - Lithuania (%)
Place of birth for the foreign-born population - North Macedonia (Macedonia) (%)
Place of birth for the foreign-born population - Moldova (%)
Place of birth for the foreign-born population - Poland (%)
Place of birth for the foreign-born population - Romania (%)
Place of birth for the foreign-born population - Russia (%)
Place of birth for the foreign-born population - Serbia (%)
Place of birth for the foreign-born population - Ukraine (%)
Place of birth for the foreign-born population - Other Eastern Europe (%)
Place of birth for the foreign-born population - China (%)
Place of birth for the foreign-born population - Hong Kong (%)
Place of birth for the foreign-born population - Taiwan (%)
Place of birth for the foreign-born population - Japan (%)
Place of birth for the foreign-born population - Korea (%)
Place of birth for the foreign-born population - Other Eastern Asia (%)
Place of birth for the foreign-born population - Afghanistan (%)
Place of birth for the foreign-born population - Bangladesh (%)
Place of birth for the foreign-born population - India (%)
Place of birth for the foreign-born population - Iran (%)
Place of birth for the foreign-born population - Kazakhstan (%)
Place of birth for the foreign-born population - Nepal (%)
Place of birth for the foreign-born population - Pakistan (%)
Place of birth for the foreign-born population - Sri Lanka (%)
Place of birth for the foreign-born population - Uzbekistan (%)
Place of birth for the foreign-born population - Other South Central Asia (%)
Place of birth for the foreign-born population - Burma (%)
Place of birth for the foreign-born population - Cambodia (%)
Place of birth for the foreign-born population - Indonesia (%)
Place of birth for the foreign-born population - Laos (%)
Place of birth for the foreign-born population - Malaysia (%)
Place of birth for the foreign-born population - Philippines (%)
Place of birth for the foreign-born population - Singapore (%)
Place of birth for the foreign-born population - Thailand (%)
Place of birth for the foreign-born population - Vietnam (%)
Place of birth for the foreign-born population - Other South Eastern Asia (%)
Place of birth for the foreign-born population - Armenia (%)
Place of birth for the foreign-born population - Iraq (%)
Place of birth for the foreign-born population - Israel (%)
Place of birth for the foreign-born population - Jordan (%)
Place of birth for the foreign-born population - Kuwait (%)
Place of birth for the foreign-born population - Lebanon (%)
Place of birth for the foreign-born population - Saudi Arabia (%)
Place of birth for the foreign-born population - Syria (%)
Place of birth for the foreign-born population - Turkey (%)
Place of birth for the foreign-born population - Yemen (%)
Place of birth for the foreign-born population - Other Western Asia (%)
Place of birth for the foreign-born population - Eritrea (%)
Place of birth for the foreign-born population - Ethiopia (%)
Place of birth for the foreign-born population - Kenya (%)
Place of birth for the foreign-born population - Somalia (%)
Place of birth for the foreign-born population - Uganda (%)
Place of birth for the foreign-born population - Zimbabwe (%)
Place of birth for the foreign-born population - Other Eastern Africa (%)
Place of birth for the foreign-born population - Cameroon (%)
Place of birth for the foreign-born population - Congo (%)
Place of birth for the foreign-born population - Democratic Republic of Congo (Zaire) (%)
Place of birth for the foreign-born population - Other Middle Africa (%)
Place of birth for the foreign-born population - Egypt (%)
Place of birth for the foreign-born population - Morocco (%)
Place of birth for the foreign-born population - Sudan (%)
Place of birth for the foreign-born population - Other Northern Africa (%)
Place of birth for the foreign-born population - South Africa (%)
Place of birth for the foreign-born population - Other Southern Africa (%)
Place of birth for the foreign-born population - Cabo Verde (%)
Place of birth for the foreign-born population - Ghana (%)
Place of birth for the foreign-born population - Liberia (%)
Place of birth for the foreign-born population - Nigeria (%)
Place of birth for the foreign-born population - Senegal (%)
Place of birth for the foreign-born population - Sierra Leone (%)
Place of birth for the foreign-born population - Other Western Africa (%)
Place of birth for the foreign-born population - Australia (%)
Place of birth for the foreign-born population - New Zealand (%)
Place of birth for the foreign-born population - Fiji (%)
Place of birth for the foreign-born population - Micronesia (%)
Place of birth for the foreign-born population - Bahamas (%)
Place of birth for the foreign-born population - Barbados (%)
Place of birth for the foreign-born population - Cuba (%)
Place of birth for the foreign-born population - Dominica (%)
Place of birth for the foreign-born population - Dominican Republic (%)
Place of birth for the foreign-born population - Grenada (%)
Place of birth for the foreign-born population - Haiti (%)
Place of birth for the foreign-born population - Jamaica (%)
Place of birth for the foreign-born population - St. Vincent and the Grenadines (%)
Place of birth for the foreign-born population - Trinidad and Tobago (%)
Place of birth for the foreign-born population - West Indies (%)
Place of birth for the foreign-born population - Other Caribbean (%)
Place of birth for the foreign-born population - Belize (%)
Place of birth for the foreign-born population - Costa Rica (%)
Place of birth for the foreign-born population - El Salvador (%)
Place of birth for the foreign-born population - Guatemala (%)
Place of birth for the foreign-born population - Honduras (%)
Place of birth for the foreign-born population - Mexico (%)
Place of birth for the foreign-born population - Nicaragua (%)
Place of birth for the foreign-born population - Panama (%)
Place of birth for the foreign-born population - Other Central America (%)
Place of birth for the foreign-born population - Argentina (%)
Place of birth for the foreign-born population - Bolivia (%)
Place of birth for the foreign-born population - Brazil (%)
Place of birth for the foreign-born population - Chile (%)
Place of birth for the foreign-born population - Colombia (%)
Place of birth for the foreign-born population - Ecuador (%)
Place of birth for the foreign-born population - Guyana (%)
Place of birth for the foreign-born population - Peru (%)
Place of birth for the foreign-born population - Uruguay (%)
Place of birth for the foreign-born population - Venezuela (%)
Place of birth for the foreign-born population - Other South America (%)
Place of birth for the foreign-born population - Canada (%)
Place of birth for the foreign-born population - Other Northern America (%)
Place of birth for the foreign-born population - Other (%)
Latest news about races in Greenfield, CA collected exclusively by city-data.com from local newspapers, TV, and radio stations
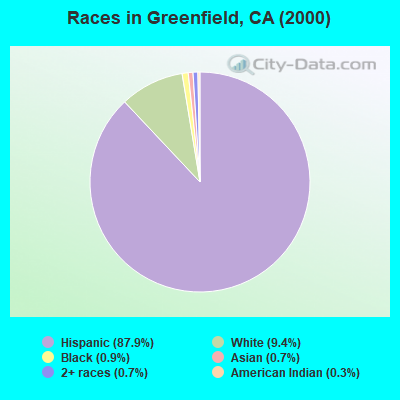
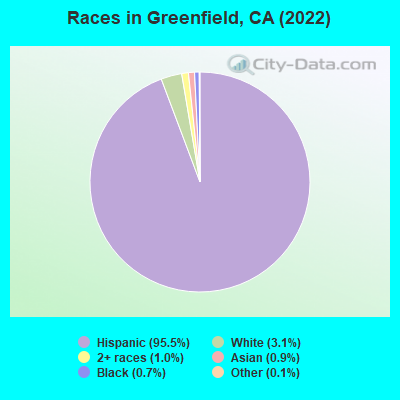
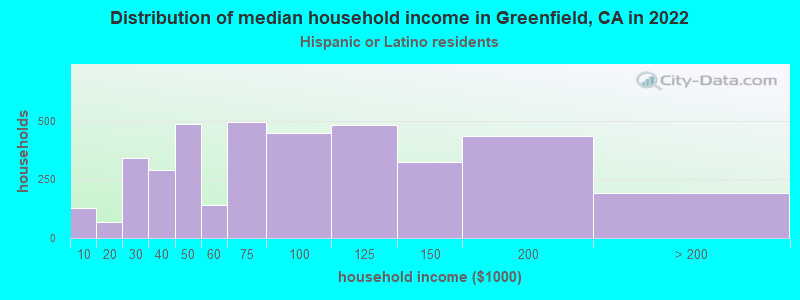
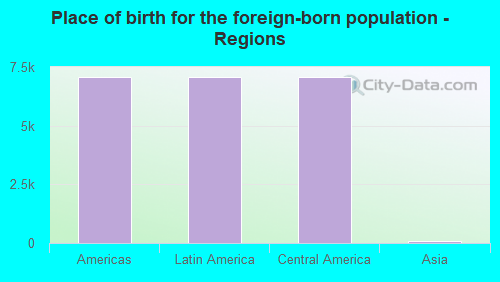
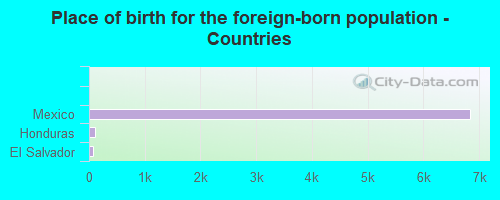
According to 2022 data, the most numerous races in Greenfield, CA are Hispanic (16,380 residents), White alone (986 residents), and Asian alone (149 residents). 17.3% of Greenfield residents speak English at home. 41.1% of Greenfield, CA residents are foreign-born (40.1% born in Latin America), which is 36.7% greater than the foreign-born rate of 26.0% across the entire state of California.
Race distribution in Greenfield
2000 2022
15,816,790 46.7% White alone 10,966,556 32.4% Hispanic 3,648,860 10.8% Asian alone 2,181,926 6.4% Black alone 903,115 2.7% Two or more races 178,984 0.5% American Indian alone 103,736 0.3% Native Hawaiian and Other 71,681 0.2% Other race alone
15,732,184 40.3% Hispanic 13,160,426 33.7% White alone 5,957,867 15.3% Asian alone 2,025,218 5.2% Black alone 1,663,222 4.3% Two or more races 251,618 0.6% Other race alone 135,777 0.3% Native Hawaiian and Other 103,030 0.3% American Indian alone
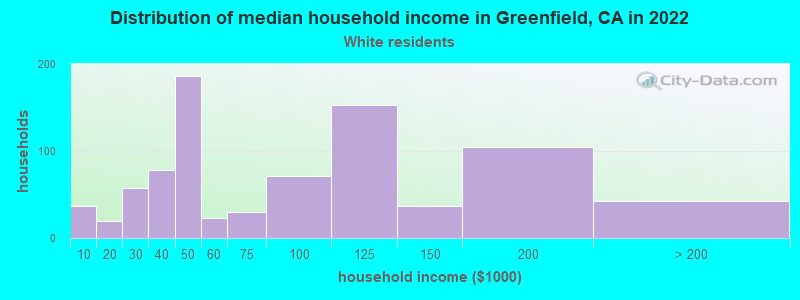
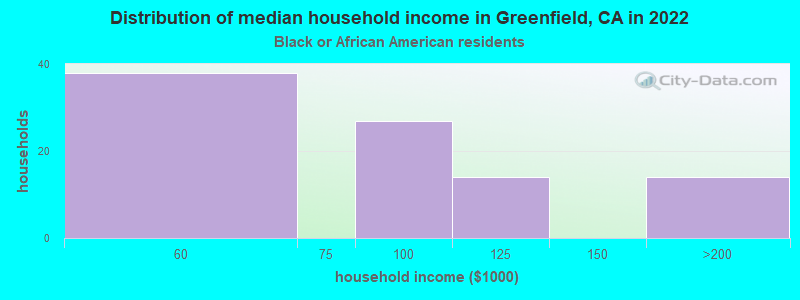
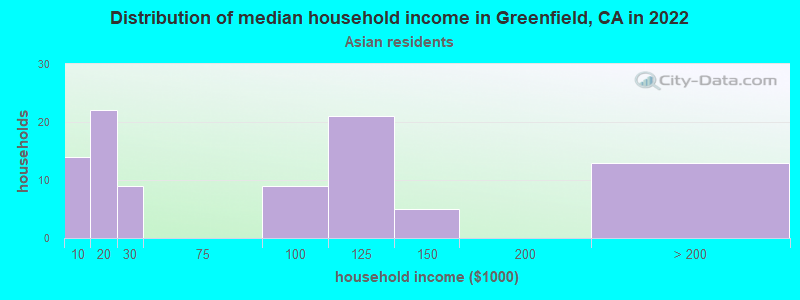
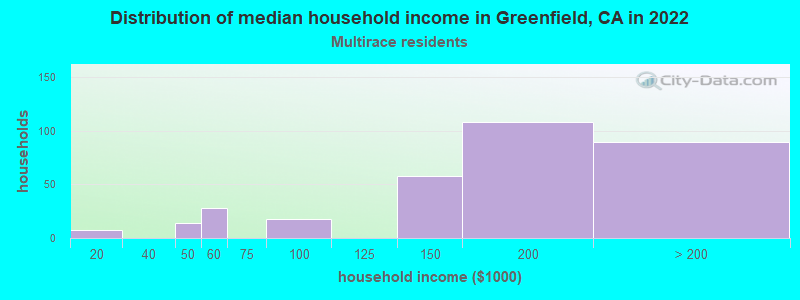
Income and house value in Greenfield Median household income in 2022 $62,831 White non-Hispanic householders$88,812 Black householders$94,109 American Indian and Alaska Native householders$129,980 Asian householders$87,058 Some other race householders$113,764 Two or more races householders$83,018 Hispanic or Latino race householdersMedian 2022 house value $467,188 White Non-Hispanic householders$494,903 Black or African American householders$636,355 American Indian or Alaska Native householders $305,940 Asian householders$452,791 Some other race householders$469,708 Two or more races householders$445,232 Hispanic or Latino householders
Median age by race in Greenfield
32.0 Median age for White residents32.0 32.2 33.2 Median age for Black or African American residents36.8 18.4 41.3 Median age for American Indian / Alaska Native residents47.4 Median age for Asian residents29.4 Median age for Other race residents30.3 28.1 20.7 Median age for Two or more races residents20.2 23.8 42.5 Median age for White alone residents44.2 40.2 28.8 Median age for Hispanic or Latino residents29.1 28.3
Owner/renter occupied households by race in Greenfield
House owners and renters - White residents 793 55.6% Owner occupied633 44.4% Renter occupiedHouse owners and renters - Black or African American residents 33 38.2% Owner occupied53 61.8% Renter occupiedHouse owners and renters - American Indian / Alaska Native residents 14 100.0% Renter occupiedHouse owners and renters - Asian residents 26 65.1% Owner occupied14 34.9% Renter occupiedHouse owners and renters - Other race residents 1,390 52.8% Owner occupied1,243 47.2% Renter occupiedHouse owners and renters - Two or more races residents 115 62.2% Owner occupied70 37.8% Renter occupiedHouse owners and renters - White alone residents 192 54.4% Owner occupied161 45.6% Renter occupiedHouse owners and renters - Hispanic or Latino residents 1,849 52.3% Owner occupied1,686 47.7% Renter occupied
Language usage in Greenfield
English speakers - Total 17.3% of residents of Greenfield speak English at home.
79.4% of residents speak Spanish at home 5,416 43.9% Speak English very well6,919 56.1% Speak English less than very well1.2% of residents speak other language at home 49 25.7% Speak English very well142 74.3% Speak English less than very well
English speakers - Born in the United States 57.3% of residents of Greenfield speak English at home.
41.6% of residents speak Spanish at home 205 78.5% Speak English very well56 21.5% Speak English less than very well0.8% of residents speak other language at home 5 100.0% Speak English very well
English speakers - Native, born elsewhere 33.8% of residents of Greenfield speak English at home.
68.0% of residents speak Spanish at home 64 43.0% Speak English very well85 57.0% Speak English less than very well
English speakers - Foreign-born 3.2% of residents of Greenfield speak English at home.
90.3% of residents speak Spanish at home 1,073 17.0% Speak English very well5,228 83.0% Speak English less than very well2.4% of residents speak other language at home 27 16.1% Speak English very well141 83.9% Speak English less than very well
White (Caucasian) - Speak only English Native:
46.9% (1,529)Foreign-born:
8.7% (114)
White (Caucasian) - Speak another language Native:
36.4% (1,186)Foreign-born:
85.4% (1,121)
Asian - Speak only English Native:
100.0% (95)Foreign-born:
78.1% (56)
Other race - Speak only English Native:
9.1% (427)Foreign-born:
0.5% (21)
Other race - Speak another language Native:
87.4% (4,077)Foreign-born:
97.9% (4,360)
Two or more races - Speak another language Native:
4.7% (19)Foreign-born:
100.0% (208)
White alone - Speak only English Native:
94.7% (634)Foreign-born:
5.2% (10)
White alone - Speak another language Native:
5.3% (35)Foreign-born:
91.7% (171)
Hispanic or Latino - Speak only English Native:
21.4% (1,787)Foreign-born:
3.7% (230)
Hispanic or Latino - Speak another language Native:
76.7% (6,393)Foreign-born:
95.5% (6,007)
Foreign-born residents in Greenfield 7,161 residents are foreign born (40.1% Latin America ).
This city:
41.1%California:
100.0%
Marital status for residents in Greenfield Marital status - White (Caucasian) population 15 years and over
Males 40.0% Never married51.3% Now married0.8% Separated3.6% Widowed4.4% DivorcedFemales 39.5% Never married45.8% Now married2.2% Separated4.9% Widowed7.6% DivorcedWomen who gave birth in the past 12 months Now married:
53.0% (22)Unmarried:
47.0% (20)
Women who did not give birth in the past 12 months Now married:
42.4% (537)Unmarried:
57.6% (729)
Marital status - Black or African American population 15 years and over
Males 21.6% Never married33.3% Now married0.0% Separated0.0% Widowed45.1% DivorcedFemales 79.5% Never married20.5% Now married0.0% Separated0.0% Widowed0.0% DivorcedWomen who gave birth in the past 12 months Now married:
0.0% (0)Unmarried:
100.0% (17)
Women who did not give birth in the past 12 months Now married:
45.5% (14)Unmarried:
54.5% (17)
Marital status - Asian population 15 years and over
Males 79.5% Never married20.5% Now married0.0% Separated0.0% Widowed0.0% DivorcedFemales 22.1% Never married56.8% Now married0.0% Separated4.2% Widowed16.8% DivorcedWomen who did not give birth in the past 12 months Now married:
66.7% (48)Unmarried:
33.3% (24)
Marital status - Other race population 15 years and over
Males 53.0% Never married42.9% Now married2.3% Separated1.2% Widowed0.6% DivorcedFemales 40.6% Never married48.6% Now married2.5% Separated5.8% Widowed2.5% DivorcedWomen who gave birth in the past 12 months Now married:
49.4% (58)Unmarried:
50.6% (60)
Women who did not give birth in the past 12 months Now married:
43.5% (1,195)Unmarried:
56.5% (1,553)
Marital status - Two or more races population 15 years and over
Males 61.4% Never married38.6% Now married0.0% Separated0.0% Widowed0.0% DivorcedFemales 48.1% Never married43.0% Now married0.0% Separated0.0% Widowed8.9% DivorcedWomen who did not give birth in the past 12 months Now married:
38.7% (55)Unmarried:
61.3% (87)
Marital status - White alone, not Hispanic / Latino population 15 years and over
Males 28.4% Never married49.2% Now married0.0% Separated17.0% Widowed5.4% DivorcedFemales 27.9% Never married43.2% Now married2.0% Separated21.4% Widowed5.4% DivorcedWomen who gave birth in the past 12 months Now married:
100.0% (31)Unmarried:
0.0% (0)
Women who did not give birth in the past 12 months Now married:
53.7% (109)Unmarried:
46.3% (94)
Marital status - Hispanic or Latino population 15 years and over
Males 48.5% Never married46.6% Now married1.8% Separated1.1% Widowed2.0% DivorcedFemales 41.1% Never married47.7% Now married2.3% Separated3.9% Widowed5.0% DivorcedWomen who gave birth in the past 12 months Now married:
36.2% (43)Unmarried:
63.8% (76)
Women who did not give birth in the past 12 months Now married:
42.3% (1,628)Unmarried:
57.7% (2,220)
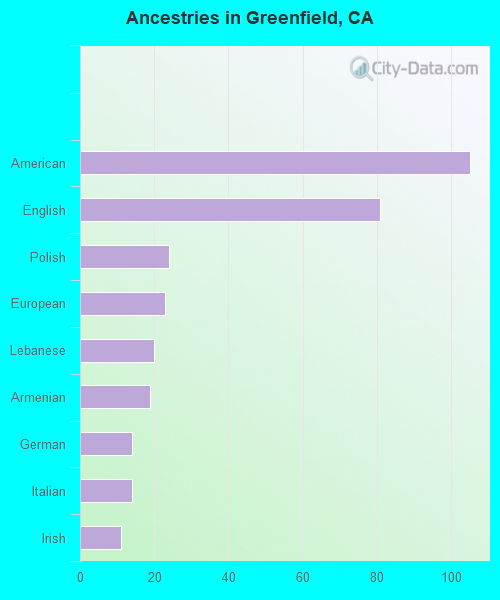
Ancestries in Greenfield
169 1.2% English47 0.3% German47 0.3% Italian42 0.3% European41 0.3% American40 0.3% French27 0.2% Dutch16 0.1% Northern European11 0.08% Polish6 0.04% Lebanese5 0.04% Armenian5 0.04% Irish
Children Nativity (place of birth) in Greenfield
Children under 6 years - Living with two parents Both parents native 414 100.0% NativeBoth parents foreign-born 299 100.0% NativeOne native, one foreign-born parent 110 100.0% NativeChildren under 6 years - Living with one parent Native parent 595 100.0% Native0 0.0% Foreign-bornForeign-born parent 433 93.8% Native29 6.2% Foreign-bornChildren 6 to 17 years - Living with two parents Both parents native 316 99.7% Native1 0.3% Foreign-bornBoth parents foreign-born 998 87.8% Native139 12.2% Foreign-bornOne native, one foreign-born parent 310 100.0% NativeChildren 6 to 17 years - Living with one parent Native parent 817 100.0% NativeForeign-born parent 1,048 51.1% Native1,002 48.9% Foreign-born
Grandparents responsible for own grandchildren in Greenfield
Grandparents (30 to 59 years) White / Caucasian 35 21.3% Responsible for grandchildren129 78.7% Not responsible for grandchildrenBlack or African American 17 100.0% Not responsible for grandchildrenAsian 10 100.0% Responsible for grandchildrenOther race 65 23.4% Responsible for grandchildren214 76.6% Not responsible for grandchildrenTwo or more races 11 100.0% Responsible for grandchildrenWhite alone, not Hispanic / Latino 6 9.6% Responsible for grandchildren59 90.4% Not responsible for grandchildrenHispanic or Latino 103 24.5% Responsible for grandchildren318 75.5% Not responsible for grandchildrenGrandparents (60 years and over) White / Caucasian 26 11.3% Responsible for grandchildren205 88.7% Not responsible for grandchildrenAsian 15 100.0% Not responsible for grandchildrenOther race 30 7.3% Responsible for grandchildren382 92.7% Not responsible for grandchildrenWhite alone, not Hispanic / Latino 49 100.0% Not responsible for grandchildrenHispanic or Latino 61 10.3% Responsible for grandchildren528 89.7% Not responsible for grandchildren