Races in Greenlawn, New York (NY) Detailed Stats
Data:
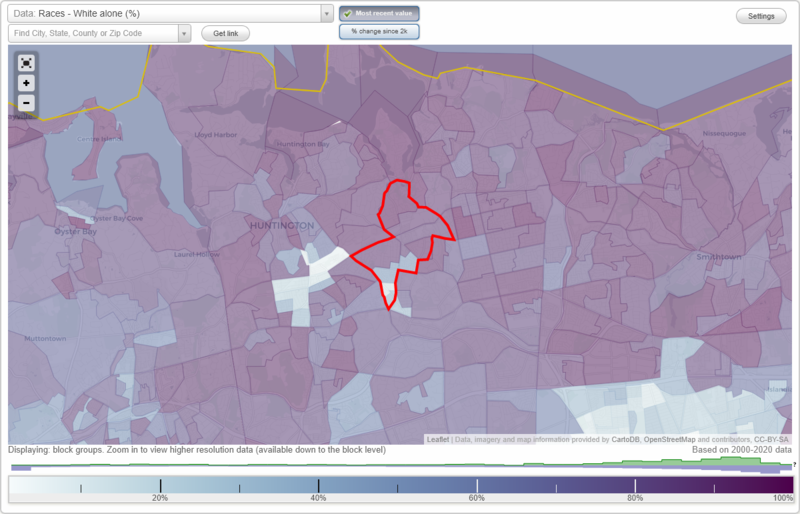
Races - White alone (%)
Races - White alone (% change since 2000)
Races - Black alone (%)
Races - Black alone (% change since 2000)
Races - American Indian alone (%)
Races - American Indian alone (% change since 2000)
Races - Asian alone (%)
Races - Asian alone (% change since 2000)
Races - Hispanic (%)
Races - Hispanic (% change since 2000)
Races - Native Hawaiian and Other Pacific Islander alone (%)
Races - Native Hawaiian and Other Pacific Islander alone (% change since 2000)
Races - Two or more races(%)
Races - Two or more races(% change since 2000)
Races - Other race alone (%)
Races - Other race alone (% change since 2000)
Racial diversity
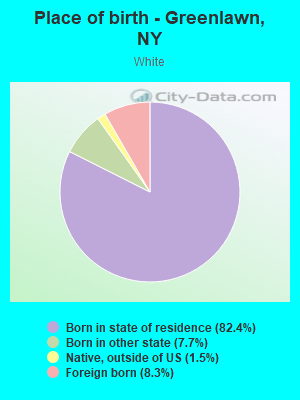
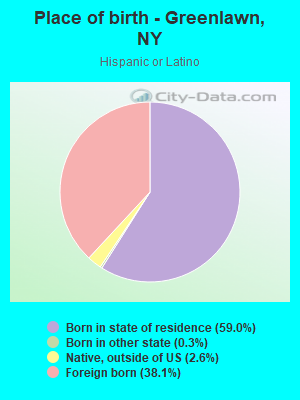
Place of birth - Born in state of residence (%)
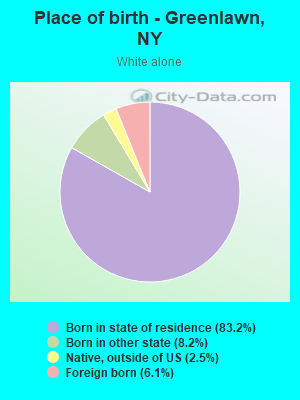
Place of birth - Born in state of residence (%) - White
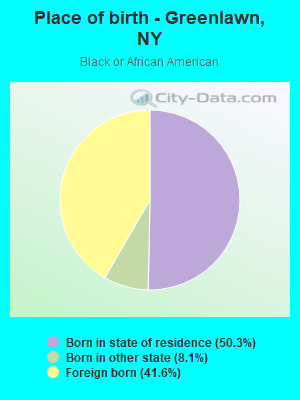
Place of birth - Born in state of residence (%) - Black or African American
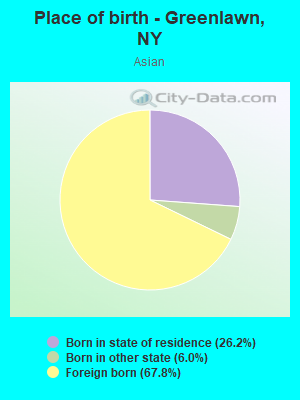
Place of birth - Born in state of residence (%) - Asian
Place of birth - Born in state of residence (%) - Hispanic or Latino
Place of birth - Born in state of residence (%) - American Indian and Alaska Native
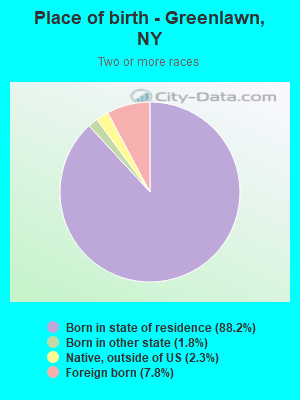
Place of birth - Born in state of residence (%) - Multirace
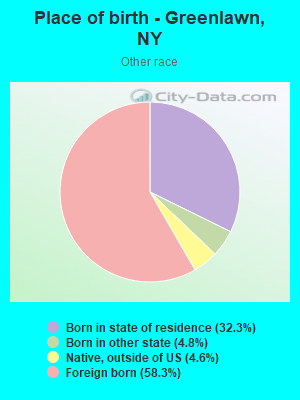
Place of birth - Born in state of residence (%) - Other Race
Place of birth - Born in other state (%)
Place of birth - Born in other state (%) - White
Place of birth - Born in other state (%) - Black or African American
Place of birth - Born in other state (%) - Asian
Place of birth - Born in other state (%) - Hispanic or Latino
Place of birth - Born in other state (%) - American Indian and Alaska Native
Place of birth - Born in other state (%) - Multirace
Place of birth - Born in other state (%) - Other Race
Place of birth - Native, outside of US (%)
Place of birth - Native, outside of US (%) - White
Place of birth - Native, outside of US (%) - Black or African American
Place of birth - Native, outside of US (%) - Asian
Place of birth - Native, outside of US (%) - Hispanic or Latino
Place of birth - Native, outside of US (%) - American Indian and Alaska Native
Place of birth - Native, outside of US (%) - Multirace
Place of birth - Native, outside of US (%) - Other Race
Place of birth - Foreign born (%)
Place of birth - Foreign born (%) - White
Place of birth - Foreign born (%) - Black or African American
Place of birth - Foreign born (%) - Asian
Place of birth - Foreign born (%) - Hispanic or Latino
Place of birth - Foreign born (%) - American Indian and Alaska Native
Place of birth - Foreign born (%) - Multirace
Place of birth - Foreign born (%) - Other Race
Residents speaking English at home (%)
Residents speaking English at home - Born in the United States (%)
Residents speaking English at home - Native, born elsewhere (%)
Residents speaking English at home - Foreign born (%)
Residents speaking Spanish at home (%)
Residents speaking Spanish at home - Born in the United States (%)
Residents speaking Spanish at home - Native, born elsewhere (%)
Residents speaking Spanish at home - Foreign born (%)
Residents speaking other language at home (%)
Residents speaking other language at home - Born in the United States (%)
Residents speaking other language at home - Native, born elsewhere (%)
Residents speaking other language at home - Foreign born (%)
Marital status - Never married (%)
Marital status - Now married (%)
Marital status - Separated (%)
Marital status - Widowed (%)
Marital status - Divorced (%)
Ancestries Reported - Arab (%)
Ancestries Reported - Czech (%)
Ancestries Reported - Danish (%)
Ancestries Reported - Dutch (%)
Ancestries Reported - English (%)
Ancestries Reported - French (%)
Ancestries Reported - French Canadian (%)
Ancestries Reported - German (%)
Ancestries Reported - Greek (%)
Ancestries Reported - Hungarian (%)
Ancestries Reported - Irish (%)
Ancestries Reported - Italian (%)
Ancestries Reported - Lithuanian (%)
Ancestries Reported - Norwegian (%)
Ancestries Reported - Polish (%)
Ancestries Reported - Portuguese (%)
Ancestries Reported - Russian (%)
Ancestries Reported - Scotch-Irish (%)
Ancestries Reported - Scottish (%)
Ancestries Reported - Slovak (%)
Ancestries Reported - Subsaharan African (%)
Ancestries Reported - Swedish (%)
Ancestries Reported - Swiss (%)
Ancestries Reported - Ukrainian (%)
Ancestries Reported - United States (%)
Ancestries Reported - Welsh (%)
Ancestries Reported - West Indian (%)
Ancestries Reported - Other (%)
Geographical mobility - Same house 1 year ago (%)
Geographical mobility - Same house 1 year ago (%) - White
Geographical mobility - Same house 1 year ago (%) - Black or African American
Geographical mobility - Same house 1 year ago (%) - Asian
Geographical mobility - Same house 1 year ago (%) - Hispanic or Latino
Geographical mobility - Same house 1 year ago (%) - American Indian and Alaska Native
Geographical mobility - Same house 1 year ago (%) - Multirace
Geographical mobility - Same house 1 year ago (%) - Other Race
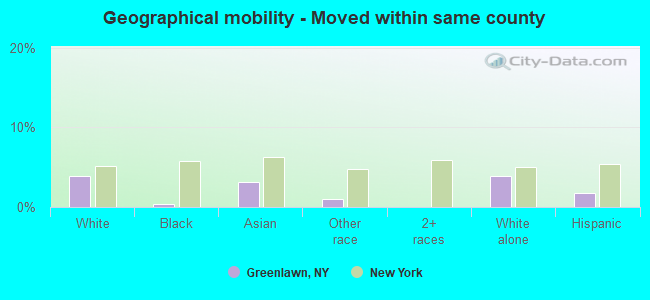
Geographical mobility - Moved within same county (%)
Geographical mobility - Moved within same county (%) - White
Geographical mobility - Moved within same county (%) - Black or African American
Geographical mobility - Moved within same county (%) - Asian
Geographical mobility - Moved within same county (%) - Hispanic or Latino
Geographical mobility - Moved within same county (%) - American Indian and Alaska Native
Geographical mobility - Moved within same county (%) - Multirace
Geographical mobility - Moved within same county (%) - Other Race
Geographical mobility - Moved from different county within same state (%)
Geographical mobility - Moved from different county within same state (%) - White
Geographical mobility - Moved from different county within same state (%) - Black or African American
Geographical mobility - Moved from different county within same state (%) - Asian
Geographical mobility - Moved from different county within same state (%) - Hispanic or Latino
Geographical mobility - Moved from different county within same state (%) - American Indian and Alaska Native
Geographical mobility - Moved from different county within same state (%) - Multirace
Geographical mobility - Moved from different county within same state (%) - Other Race
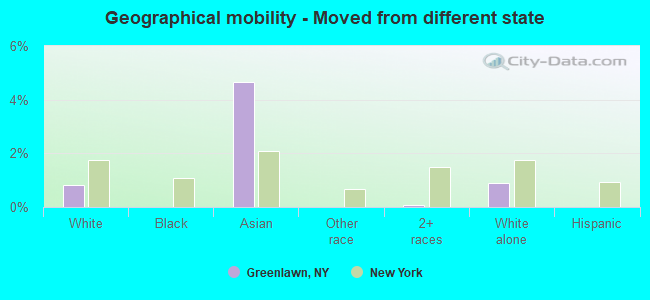
Geographical mobility - Moved from different state (%)
Geographical mobility - Moved from different state (%) - White
Geographical mobility - Moved from different state (%) - Black or African American
Geographical mobility - Moved from different state (%) - Asian
Geographical mobility - Moved from different state (%) - Hispanic or Latino
Geographical mobility - Moved from different state (%) - American Indian and Alaska Native
Geographical mobility - Moved from different state (%) - Multirace
Geographical mobility - Moved from different state (%) - Other Race
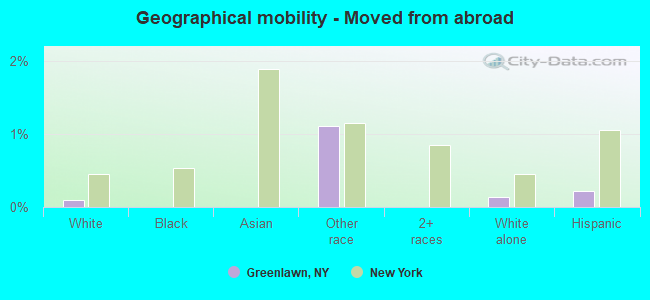
Geographical mobility - Moved from abroad (%)
Geographical mobility - Moved from abroad (%) - White
Geographical mobility - Moved from abroad (%) - Black or African American
Geographical mobility - Moved from abroad (%) - Asian
Geographical mobility - Moved from abroad (%) - Hispanic or Latino
Geographical mobility - Moved from abroad (%) - American Indian and Alaska Native
Geographical mobility - Moved from abroad (%) - Multirace
Geographical mobility - Moved from abroad (%) - Other Race
Place of birth for the foreign-born population - Ireland (%)
Place of birth for the foreign-born population - Denmark (%)
Place of birth for the foreign-born population - Norway (%)
Place of birth for the foreign-born population - Sweden (%)
Place of birth for the foreign-born population - United Kingdom (%)
Place of birth for the foreign-born population - England (%)
Place of birth for the foreign-born population - Scotland (%)
Place of birth for the foreign-born population - Other Northern Europe (%)
Place of birth for the foreign-born population - Austria (%)
Place of birth for the foreign-born population - Belgium (%)
Place of birth for the foreign-born population - France (%)
Place of birth for the foreign-born population - Germany (%)
Place of birth for the foreign-born population - Netherlands (%)
Place of birth for the foreign-born population - Switzerland (%)
Place of birth for the foreign-born population - Other Western Europe (%)
Place of birth for the foreign-born population - Greece (%)
Place of birth for the foreign-born population - Italy (%)
Place of birth for the foreign-born population - Portugal (%)
Place of birth for the foreign-born population - Spain (%)
Place of birth for the foreign-born population - Other Southern Europe (%)
Place of birth for the foreign-born population - Albania (%)
Place of birth for the foreign-born population - Belarus (%)
Place of birth for the foreign-born population - Bosnia and Herzegovina (%)
Place of birth for the foreign-born population - Bulgaria (%)
Place of birth for the foreign-born population - Croatia (%)
Place of birth for the foreign-born population - Czechoslovakia (%)
Place of birth for the foreign-born population - Hungary (%)
Place of birth for the foreign-born population - Latvia (%)
Place of birth for the foreign-born population - Lithuania (%)
Place of birth for the foreign-born population - North Macedonia (Macedonia) (%)
Place of birth for the foreign-born population - Moldova (%)
Place of birth for the foreign-born population - Poland (%)
Place of birth for the foreign-born population - Romania (%)
Place of birth for the foreign-born population - Russia (%)
Place of birth for the foreign-born population - Serbia (%)
Place of birth for the foreign-born population - Ukraine (%)
Place of birth for the foreign-born population - Other Eastern Europe (%)
Place of birth for the foreign-born population - China (%)
Place of birth for the foreign-born population - Hong Kong (%)
Place of birth for the foreign-born population - Taiwan (%)
Place of birth for the foreign-born population - Japan (%)
Place of birth for the foreign-born population - Korea (%)
Place of birth for the foreign-born population - Other Eastern Asia (%)
Place of birth for the foreign-born population - Afghanistan (%)
Place of birth for the foreign-born population - Bangladesh (%)
Place of birth for the foreign-born population - India (%)
Place of birth for the foreign-born population - Iran (%)
Place of birth for the foreign-born population - Kazakhstan (%)
Place of birth for the foreign-born population - Nepal (%)
Place of birth for the foreign-born population - Pakistan (%)
Place of birth for the foreign-born population - Sri Lanka (%)
Place of birth for the foreign-born population - Uzbekistan (%)
Place of birth for the foreign-born population - Other South Central Asia (%)
Place of birth for the foreign-born population - Burma (%)
Place of birth for the foreign-born population - Cambodia (%)
Place of birth for the foreign-born population - Indonesia (%)
Place of birth for the foreign-born population - Laos (%)
Place of birth for the foreign-born population - Malaysia (%)
Place of birth for the foreign-born population - Philippines (%)
Place of birth for the foreign-born population - Singapore (%)
Place of birth for the foreign-born population - Thailand (%)
Place of birth for the foreign-born population - Vietnam (%)
Place of birth for the foreign-born population - Other South Eastern Asia (%)
Place of birth for the foreign-born population - Armenia (%)
Place of birth for the foreign-born population - Iraq (%)
Place of birth for the foreign-born population - Israel (%)
Place of birth for the foreign-born population - Jordan (%)
Place of birth for the foreign-born population - Kuwait (%)
Place of birth for the foreign-born population - Lebanon (%)
Place of birth for the foreign-born population - Saudi Arabia (%)
Place of birth for the foreign-born population - Syria (%)
Place of birth for the foreign-born population - Turkey (%)
Place of birth for the foreign-born population - Yemen (%)
Place of birth for the foreign-born population - Other Western Asia (%)
Place of birth for the foreign-born population - Eritrea (%)
Place of birth for the foreign-born population - Ethiopia (%)
Place of birth for the foreign-born population - Kenya (%)
Place of birth for the foreign-born population - Somalia (%)
Place of birth for the foreign-born population - Uganda (%)
Place of birth for the foreign-born population - Zimbabwe (%)
Place of birth for the foreign-born population - Other Eastern Africa (%)
Place of birth for the foreign-born population - Cameroon (%)
Place of birth for the foreign-born population - Congo (%)
Place of birth for the foreign-born population - Democratic Republic of Congo (Zaire) (%)
Place of birth for the foreign-born population - Other Middle Africa (%)
Place of birth for the foreign-born population - Egypt (%)
Place of birth for the foreign-born population - Morocco (%)
Place of birth for the foreign-born population - Sudan (%)
Place of birth for the foreign-born population - Other Northern Africa (%)
Place of birth for the foreign-born population - South Africa (%)
Place of birth for the foreign-born population - Other Southern Africa (%)
Place of birth for the foreign-born population - Cabo Verde (%)
Place of birth for the foreign-born population - Ghana (%)
Place of birth for the foreign-born population - Liberia (%)
Place of birth for the foreign-born population - Nigeria (%)
Place of birth for the foreign-born population - Senegal (%)
Place of birth for the foreign-born population - Sierra Leone (%)
Place of birth for the foreign-born population - Other Western Africa (%)
Place of birth for the foreign-born population - Australia (%)
Place of birth for the foreign-born population - New Zealand (%)
Place of birth for the foreign-born population - Fiji (%)
Place of birth for the foreign-born population - Micronesia (%)
Place of birth for the foreign-born population - Bahamas (%)
Place of birth for the foreign-born population - Barbados (%)
Place of birth for the foreign-born population - Cuba (%)
Place of birth for the foreign-born population - Dominica (%)
Place of birth for the foreign-born population - Dominican Republic (%)
Place of birth for the foreign-born population - Grenada (%)
Place of birth for the foreign-born population - Haiti (%)
Place of birth for the foreign-born population - Jamaica (%)
Place of birth for the foreign-born population - St. Vincent and the Grenadines (%)
Place of birth for the foreign-born population - Trinidad and Tobago (%)
Place of birth for the foreign-born population - West Indies (%)
Place of birth for the foreign-born population - Other Caribbean (%)
Place of birth for the foreign-born population - Belize (%)
Place of birth for the foreign-born population - Costa Rica (%)
Place of birth for the foreign-born population - El Salvador (%)
Place of birth for the foreign-born population - Guatemala (%)
Place of birth for the foreign-born population - Honduras (%)
Place of birth for the foreign-born population - Mexico (%)
Place of birth for the foreign-born population - Nicaragua (%)
Place of birth for the foreign-born population - Panama (%)
Place of birth for the foreign-born population - Other Central America (%)
Place of birth for the foreign-born population - Argentina (%)
Place of birth for the foreign-born population - Bolivia (%)
Place of birth for the foreign-born population - Brazil (%)
Place of birth for the foreign-born population - Chile (%)
Place of birth for the foreign-born population - Colombia (%)
Place of birth for the foreign-born population - Ecuador (%)
Place of birth for the foreign-born population - Guyana (%)
Place of birth for the foreign-born population - Peru (%)
Place of birth for the foreign-born population - Uruguay (%)
Place of birth for the foreign-born population - Venezuela (%)
Place of birth for the foreign-born population - Other South America (%)
Place of birth for the foreign-born population - Canada (%)
Place of birth for the foreign-born population - Other Northern America (%)
Place of birth for the foreign-born population - Other (%)
Latest news about races in Greenlawn, NY collected exclusively by city-data.com from local newspapers, TV, and radio stations
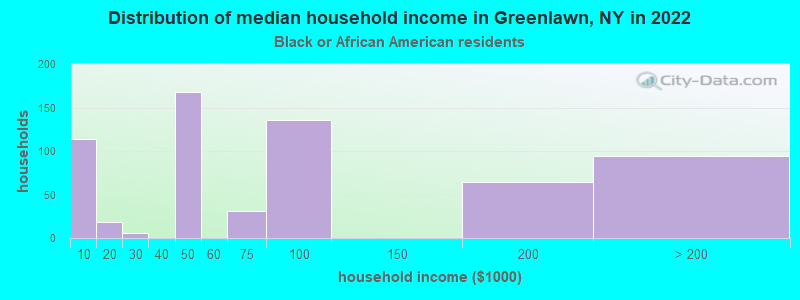
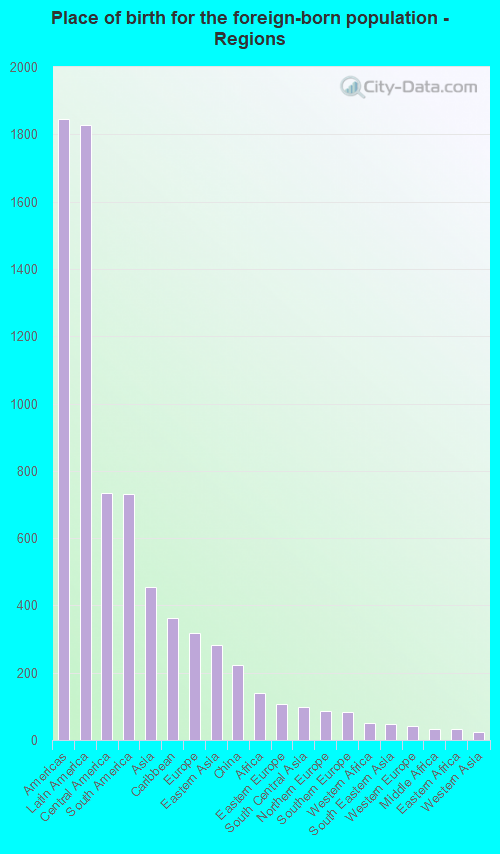
According to 2022 data, the most numerous races in Greenlawn, NY are White alone (8,529 residents), Hispanic (3,651 residents), and Black alone (1,630 residents). 70.5% of Greenlawn residents speak English at home. 18.2% of Greenlawn, NY residents are foreign-born (12.2% born in Latin America, 3.0% born in Asia, 2.1% born in Europe), which is 20.9% less than the foreign-born rate of 22.0% across the entire state of New York.
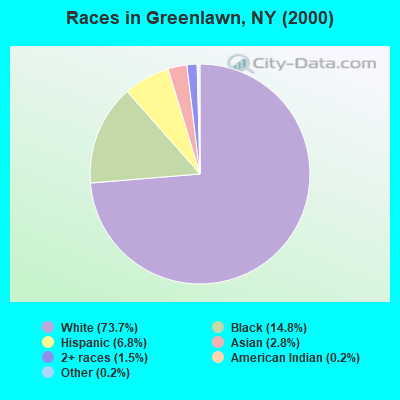
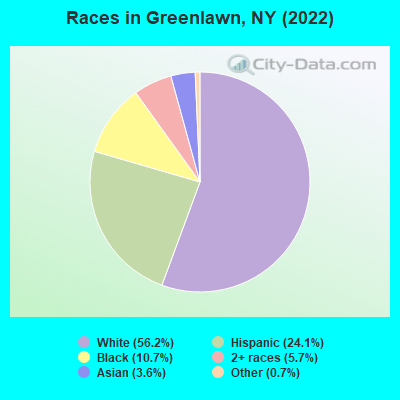
Race distribution in Greenlawn
2000 2022
11,760,981 62.0% White alone 2,867,583 15.1% Hispanic 2,812,623 14.8% Black alone 1,035,926 5.5% Asian alone 366,116 1.9% Two or more races 75,499 0.4% Other race alone 52,499 0.3% American Indian alone 5,230 0.03% Native Hawaiian and Other
10,408,933 52.9% White alone 3,867,299 19.7% Hispanic 2,633,840 13.4% Black alone 1,776,286 9.0% Asian alone 732,670 3.7% Two or more races 216,110 1.1% Other race alone 35,082 0.2% American Indian alone 6,931 0.04% Native Hawaiian and Other
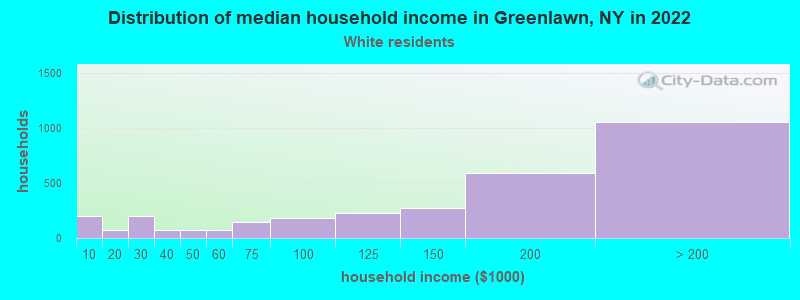
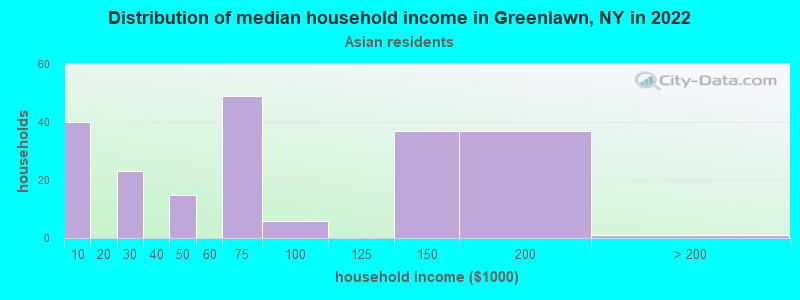
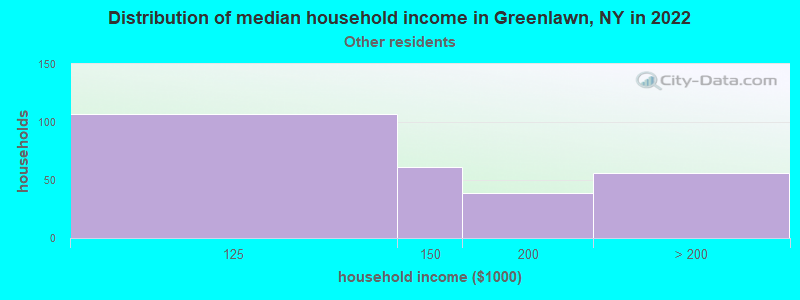
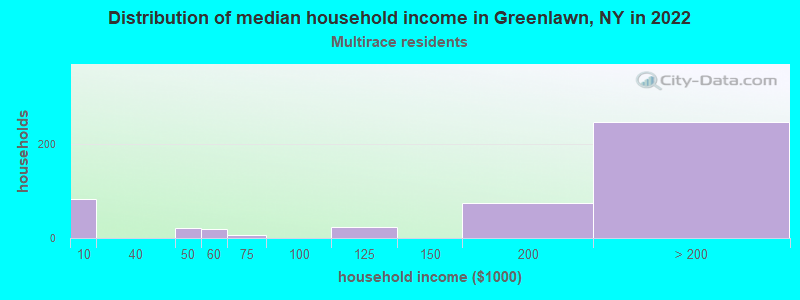
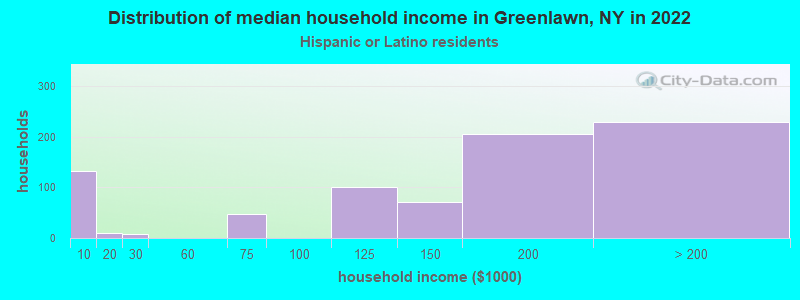
Income and house value in Greenlawn Median household income in 2022 $151,453 White non-Hispanic householders$81,800 Black householders$67,592 Asian householders$127,617 Some other race householdersover $200,000 Two or more races householders$172,577 Hispanic or Latino race householdersMedian 2022 house value $666,761 White Non-Hispanic householders$491,675 Black or African American householders $702,066 Asian householders$462,399 Some other race householders$512,628 Two or more races householders$514,924 Hispanic or Latino householders
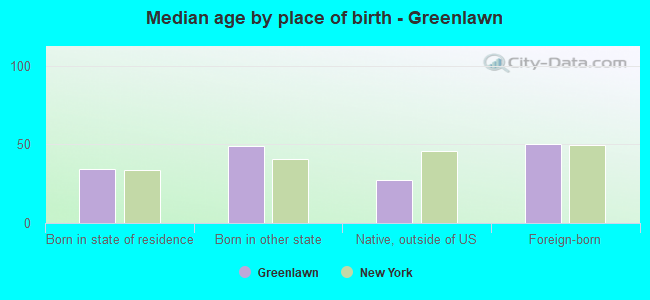
Median age by race in Greenlawn
47.7 Median age for White residents44.3 50.3 39.2 Median age for Black or African American residents30.0 40.7 -748,832,865.7 Median age for American Indian / Alaska Native residents-807,017,543.1 -513,692,161.9 38.9 Median age for Asian residents38.7 40.4 -742,816,091.2 Median age for Native Hawaiian / Pacific Islander residents-831,187,409.8 -771,300,447.7 39.8 Median age for Other race residents20.2 45.7 21.8 Median age for Two or more races residents21.3 19.0 48.2 Median age for White alone residents44.5 49.4 35.8 Median age for Hispanic or Latino residents21.8 36.3
Owner/renter occupied households by race in Greenlawn
House owners and renters - White residents 2,768 86.8% Owner occupied420 13.2% Renter occupiedHouse owners and renters - Black or African American residents 488 83.9% Owner occupied93 16.1% Renter occupiedHouse owners and renters - Asian residents 121 73.2% Owner occupied44 26.8% Renter occupiedHouse owners and renters - Other race residents 199 78.8% Owner occupied53 21.2% Renter occupiedHouse owners and renters - Two or more races residents 408 88.6% Owner occupied53 11.4% Renter occupiedHouse owners and renters - White alone residents 2,624 87.8% Owner occupied366 12.2% Renter occupiedHouse owners and renters - Hispanic or Latino residents 613 78.2% Owner occupied171 21.8% Renter occupied
Language usage in Greenlawn
English speakers - Total 70.5% of residents of Greenlawn speak English at home.
21.0% of residents speak Spanish at home 1,801 59.0% Speak English very well1,252 41.0% Speak English less than very well8.6% of residents speak other language at home 900 71.8% Speak English very well353 28.2% Speak English less than very well
English speakers - Born in the United States 89.8% of residents of Greenlawn speak English at home.
4.2% of residents speak Spanish at home 42 100.0% Speak English very well6.9% of residents speak other language at home 41 59.4% Speak English very well28 40.6% Speak English less than very well
English speakers - Native, born elsewhere 68.5% of residents of Greenlawn speak English at home.
18.2% of residents speak Spanish at home 41 71.9% Speak English very well16 28.1% Speak English less than very well19.4% of residents speak other language at home 45 73.8% Speak English very well16 26.2% Speak English less than very well
English speakers - Foreign-born 23.3% of residents of Greenlawn speak English at home.
52.6% of residents speak Spanish at home 458 29.0% Speak English very well1,119 71.0% Speak English less than very well24.6% of residents speak other language at home 511 69.3% Speak English very well226 30.7% Speak English less than very well
White (Caucasian) - Speak only English Native:
96.6% (7,430)Foreign-born:
33.9% (248)
White (Caucasian) - Speak another language Native:
3.9% (299)Foreign-born:
67.4% (493)
Black or African American - Speak only English Native:
83.7% (863)Foreign-born:
52.0% (392)
Black or African American - Speak another language Native:
17.8% (184)Foreign-born:
47.5% (358)
Asian - Speak only English Native:
53.3% (83)Foreign-born:
6.5% (24)
Asian - Speak another language Native:
45.3% (71)Foreign-born:
96.9% (355)
Other race - Speak only English Native:
23.5% (127)Foreign-born:
2.6% (20)
Other race - Speak another language Native:
74.7% (402)Foreign-born:
98.4% (737)
Two or more races - Speak only English Native:
46.2% (1,249)Foreign-born:
22.7% (53)
Two or more races - Speak another language Native:
53.1% (1,433)Foreign-born:
75.9% (177)
White alone - Speak only English Native:
95.9% (7,298)Foreign-born:
37.1% (196)
White alone - Speak another language Native:
4.2% (316)Foreign-born:
62.9% (331)
Hispanic or Latino - Speak only English Native:
38.3% (818)Foreign-born:
7.5% (105)
Hispanic or Latino - Speak another language Native:
61.0% (1,302)Foreign-born:
92.4% (1,285)
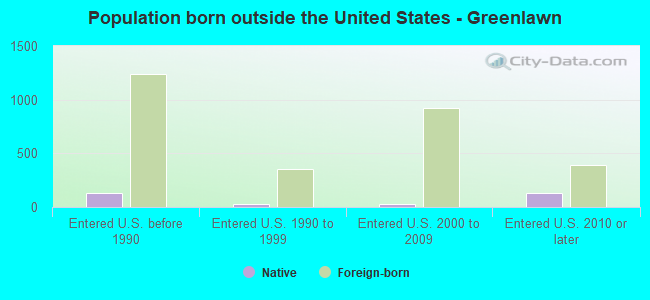
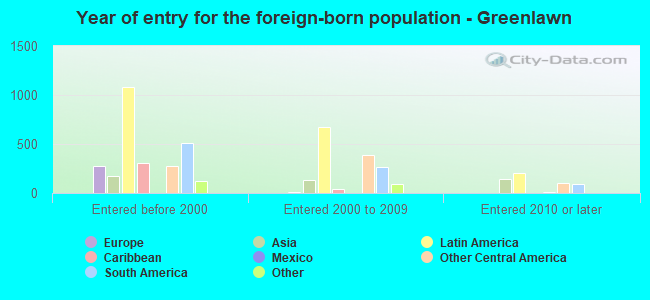
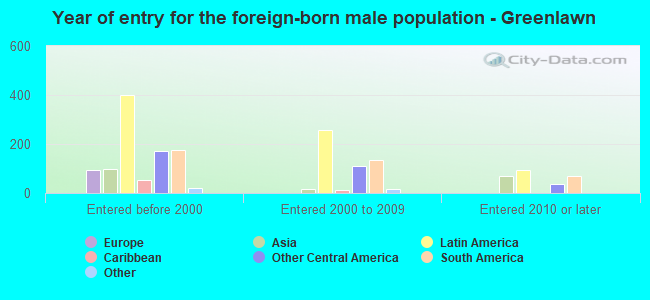
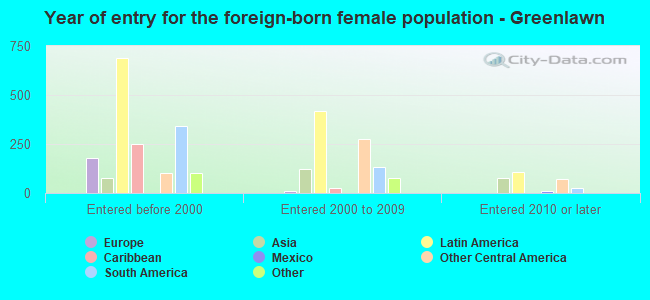
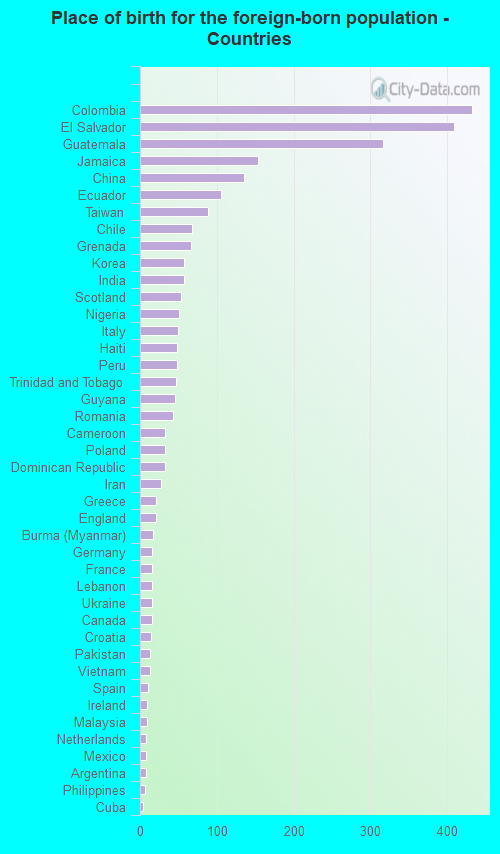
Foreign-born residents in Greenlawn 2,761 residents are foreign born (12.2% Latin America , 3.0% Asia , 2.1% Europe ).
This city:
18.2%New York:
22.6%
Marital status for residents in Greenlawn Marital status - White (Caucasian) population 15 years and over
Males 35.1% Never married56.3% Now married0.7% Separated2.0% Widowed6.0% DivorcedFemales 24.5% Never married50.6% Now married2.7% Separated11.6% Widowed10.6% DivorcedWomen who gave birth in the past 12 months Now married:
86.9% (75)Unmarried:
13.1% (11)
Women who did not give birth in the past 12 months Now married:
54.4% (896)Unmarried:
45.6% (752)
Marital status - Black or African American population 15 years and over
Males 51.0% Never married43.9% Now married2.9% Separated1.4% Widowed0.8% DivorcedFemales 33.6% Never married20.9% Now married4.3% Separated27.9% Widowed13.3% DivorcedWomen who did not give birth in the past 12 months Now married:
21.1% (92)Unmarried:
78.9% (344)
Marital status - Asian population 15 years and over
Males 25.9% Never married69.0% Now married0.0% Separated0.0% Widowed5.2% DivorcedFemales 31.5% Never married57.0% Now married0.0% Separated0.0% Widowed11.5% DivorcedWomen who gave birth in the past 12 months Now married:
100.0% (17)Unmarried:
0.0% (0)
Women who did not give birth in the past 12 months Now married:
51.5% (104)Unmarried:
48.5% (98)
Marital status - Other race population 15 years and over
Males 47.5% Never married52.5% Now married0.0% Separated0.0% Widowed0.0% DivorcedFemales 36.8% Never married29.4% Now married12.5% Separated8.3% Widowed13.0% DivorcedWomen who did not give birth in the past 12 months Now married:
36.8% (159)Unmarried:
63.2% (273)
Marital status - Two or more races population 15 years and over
Males 50.1% Never married47.4% Now married0.0% Separated0.0% Widowed2.5% DivorcedFemales 12.4% Never married85.6% Now married0.0% Separated2.0% Widowed0.0% DivorcedWomen who gave birth in the past 12 months Now married:
100.0% (38)Unmarried:
0.0% (0)
Women who did not give birth in the past 12 months Now married:
83.3% (509)Unmarried:
16.7% (102)
Marital status - White alone, not Hispanic / Latino population 15 years and over
Males 37.3% Never married53.5% Now married0.7% Separated2.1% Widowed6.4% DivorcedFemales 25.1% Never married51.4% Now married0.8% Separated12.9% Widowed9.8% DivorcedWomen who gave birth in the past 12 months Now married:
86.9% (81)Unmarried:
13.1% (12)
Women who did not give birth in the past 12 months Now married:
53.1% (808)Unmarried:
46.9% (715)
Marital status - Hispanic or Latino population 15 years and over
Males 44.6% Never married54.3% Now married0.0% Separated0.8% Widowed0.4% DivorcedFemales 18.0% Never married55.4% Now married10.3% Separated3.4% Widowed12.9% DivorcedWomen who did not give birth in the past 12 months Now married:
66.4% (651)Unmarried:
33.6% (329)
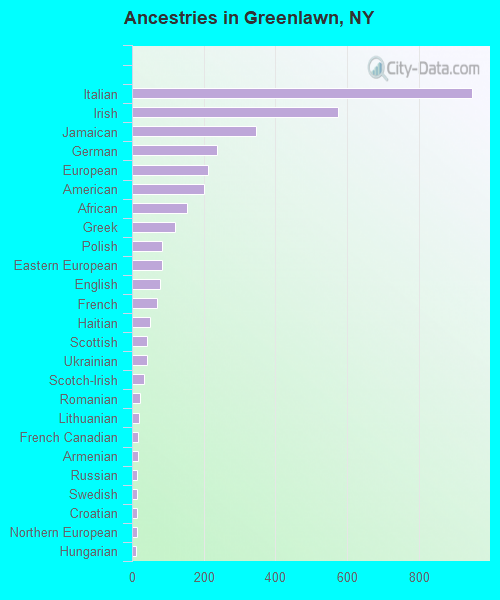
Ancestries in Greenlawn
949 14.2% Italian575 8.6% Irish346 5.2% Jamaican236 3.5% German212 3.2% European201 3.0% American153 2.3% African121 1.8% Greek85 1.3% Polish83 1.2% Eastern European79 1.2% English71 1.1% French50 0.7% Haitian42 0.6% Scottish41 0.6% Ukrainian34 0.5% Scotch-Irish21 0.3% Romanian20 0.3% Lithuanian18 0.3% French Canadian16 0.2% Armenian14 0.2% Russian14 0.2% Swedish13 0.2% Croatian13 0.2% Northern European12 0.2% Hungarian11 0.2% Portuguese10 0.1% Austrian9 0.1% Lebanese9 0.1% Pennsylvania German7 0.1% Norwegian5 0.07% Czech5 0.07% Danish4 0.06% British
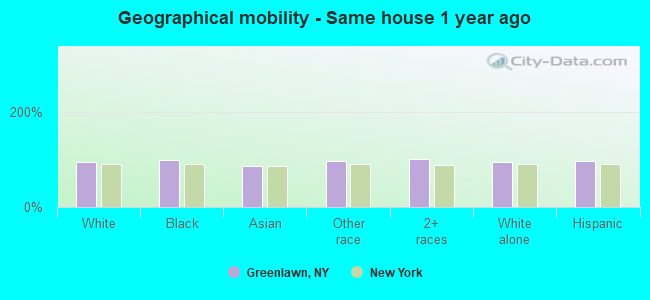
Geographical mobility in Greenlawn Same house 1 year ago 8,341 94.0% White (Caucasian)1,764 98.5% Black or African American476 86.2% Asian1,224 95.6% Other race3,067 100.0% Two or more races7,952 93.8% White alone, not Hispanic / Latino3,542 97.3% Hispanic or LatinoMoved within same county 347 3.9% White / Caucasian8 0.4% Black or African American17 3.1% Asian12 1.0% Other race333 3.9% White alone, not Hispanic / Latino64 1.8% Hispanic or LatinoMoved within same state 92 1.0% White / Caucasian4 0.2% Black or African American18 3.2% Asian92 1.1% White alone, not Hispanic / Latino6 0.2% Hispanic or LatinoMoved from different state 73 0.8% White / Caucasian26 4.7% Asian2 0.1% Two or more races77 0.9% White alone, not Hispanic / Latino0 0.0% Hispanic or LatinoMoved from abroad 9 0.1% White14 1.1% Other race12 0.1% White alone, not Hispanic / Latino8 0.2% Hispanic or Latino
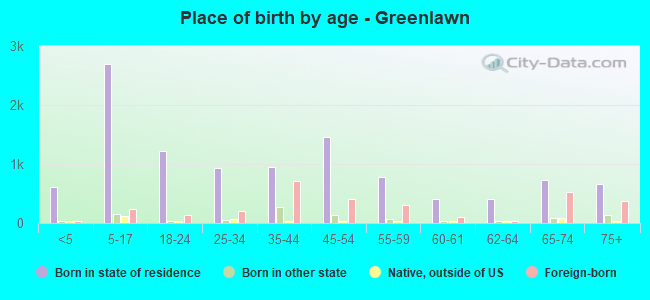
Children Nativity (place of birth) in Greenlawn
Children under 6 years - Living with two parents Both parents native 525 100.0% NativeBoth parents foreign-born 89 100.0% NativeOne native, one foreign-born parent 69 100.0% NativeChildren under 6 years - Living with one parent Native parent 78 100.0% NativeForeign-born parent 11 100.0% NativeChildren 6 to 17 years - Living with two parents Both parents native 1,164 100.0% Native0 0.0% Foreign-bornBoth parents foreign-born 379 99.1% Native4 0.9% Foreign-bornOne native, one foreign-born parent 139 100.0% NativeChildren 6 to 17 years - Living with one parent Native parent 689 85.8% Native114 14.2% Foreign-bornForeign-born parent 252 68.8% Native114 31.2% Foreign-born
Grandparents responsible for own grandchildren in Greenlawn
Grandparents (30 to 59 years) White / Caucasian 118 100.0% Not responsible for grandchildrenWhite alone, not Hispanic / Latino 35 100.0% Not responsible for grandchildrenHispanic or Latino 122 100.0% Not responsible for grandchildrenGrandparents (60 years and over) White / Caucasian 36 25.2% Responsible for grandchildren107 74.8% Not responsible for grandchildrenWhite alone, not Hispanic / Latino 44 27.2% Responsible for grandchildren117 72.8% Not responsible for grandchildrenHispanic or Latino 39 100.0% Not responsible for grandchildren