Races in Groton, New Hampshire (NH) Detailed Stats
Ancestries, Foreign-born residents, place of birth

Recent posts about races in Groton, New Hampshire on our local forum with over 2,400,000 registered users:
 | Yet Another Guy Looking to Relocate to Southern NH (27 replies) |
| should I move from Los Angeles to New Hampshire? (42 replies) |
| Pros and cons of Shifting to New Hampshire from Massachusetts (21 replies) |
| Thinking of retiring to NH (67 replies) |
| NH for retirement - Insight Please... (65 replies) |
| Milford NH (2 replies) |
2.9% of Groton, NH residents are foreign-born (1.5% born in Asia, 1.3% born in North America), which is 75.4% less than the foreign-born rate of 5.0% across the entire state of New Hampshire.
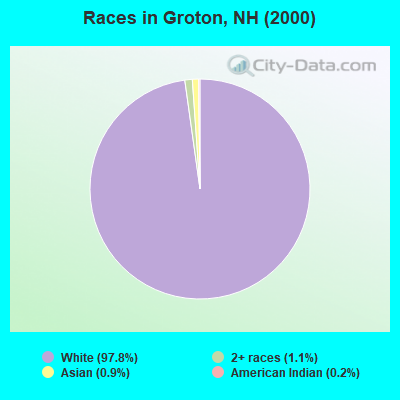
Race distribution in Groton

- 44697.8%White alone
- 51.1%Two or more races
- 40.9%Asian alone
- 10.2%American Indian alone
2000
2022
-
- 1,175,25295.1%White alone
- 20,4891.7%Hispanic
- 15,8031.3%Asian alone
- 11,6060.9%Two or more races
- 8,3540.7%Black alone
- 2,6980.2%American Indian alone
- 1,2540.1%Other race alone
- 3300.03%Native Hawaiian and Other
Pacific Islander alone

-
- 1,208,10186.6%White alone
- 63,4794.5%Hispanic
- 60,7244.4%Two or more races
- 36,5192.6%Asian alone
- 17,9311.3%Black alone
- 6,6150.5%Other race alone
- 1,0140.07%American Indian alone
- 8480.06%Native Hawaiian and Other
Pacific Islander alone

Income and house value in Groton
- Median household income in 2022
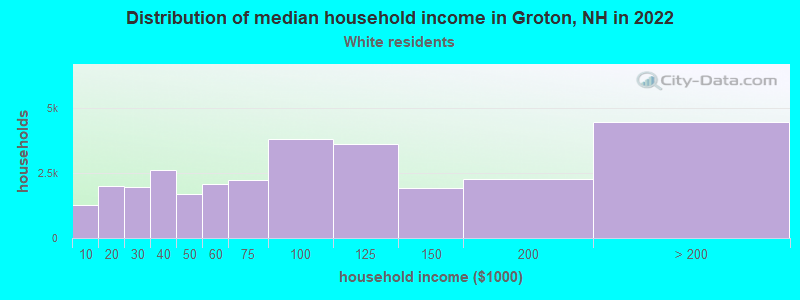
- $71,051White non-Hispanic householders
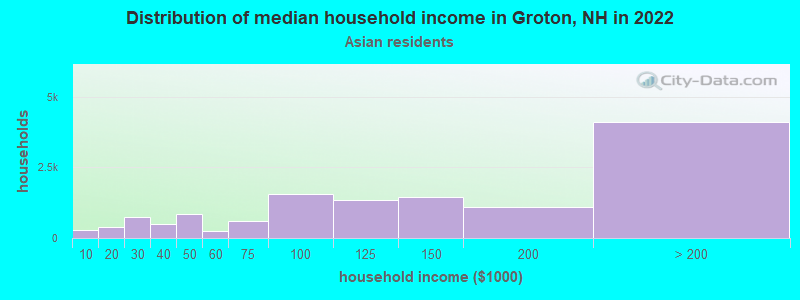
- over $200,000Asian householders
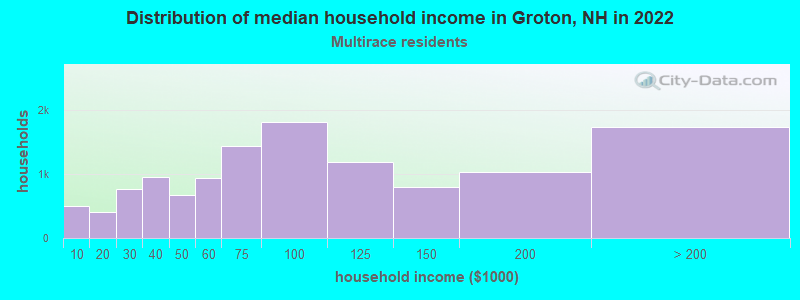
- $106,996Two or more races householders
- Median 2022 house value
- $262,410White Non-Hispanic householders
- $519,386Asian householders
- $207,754Two or more races householders
Household income for White non-Hispanic householders
Household income for Asian householders
Household income for Two or more races householders
Foreign-born residents in Groton
13 residents are foreign born (1.5% Asia, 1.3% North America).
| This city: | 2.9% |
| New Hampshire: | 4.4% |
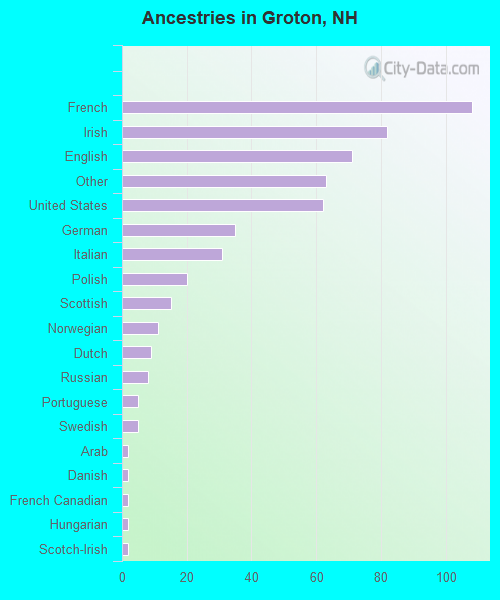
Ancestries in Groton

- 10820.2%French
- 8215.3%Irish
- 7113.3%English
- 6311.8%Other
- 6211.6%United States
- 356.5%German
- 315.8%Italian
- 203.7%Polish
- 152.8%Scottish
- 112.1%Norwegian
- 91.7%Dutch
- 81.5%Russian
- 50.9%Portuguese
- 50.9%Swedish
- 20.4%Arab
- 20.4%Danish
- 20.4%French Canadian
- 20.4%Hungarian
- 20.4%Scotch-Irish
Zip codes: 03241.