Races in Hadley, Massachusetts (MA) Detailed Stats
Ancestries, Foreign-born residents, place of birth

Recent posts about races in Hadley, Massachusetts on our local forum with over 2,400,000 registered users:
 | 2021 Real Estate Observations (1729 replies) |
| Job transfer to Hadley Ma via Florida ISO 1,2 bedroom home (7 replies) |
| Oklahoma to (likely Western) Massachusetts - Beginning Research (274 replies) |
| Buying house in Roslindale vs Medford (26 replies) |
| Big MA Ancestry Data Thread by Town (31 replies) |
| Good and affordable Western Mass school districts? Where should we live? (37 replies) |
Latest news about races in Hadley, MA collected exclusively by city-data.com from local newspapers, TV, and radio stations
4.4% of Hadley, MA residents are foreign-born (2.2% born in Europe, 1.5% born in Asia), which is 310.8% less than the foreign-born rate of 18.0% across the entire state of Massachusetts.
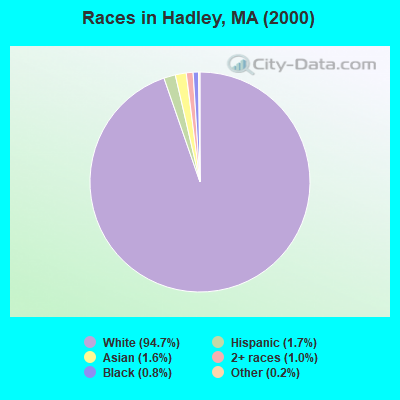
Race distribution in Hadley

- 4,54094.7%White alone
- 801.7%Hispanic
- 751.6%Asian alone
- 501.0%Two or more races
- 360.8%Black alone
- 90.2%Other race alone
- 30.06%American Indian alone
2000
2022
-
- 5,198,35981.9%White alone
- 428,7296.8%Hispanic
- 318,3295.0%Black alone
- 236,7863.7%Asian alone
- 110,3381.7%Two or more races
- 43,5860.7%Other race alone
- 11,2640.2%American Indian alone
- 1,7060.03%Native Hawaiian and Other
Pacific Islander alone

-
- 4,676,62767.0%White alone
- 911,03813.0%Hispanic
- 501,4637.2%Asian alone
- 459,7406.6%Black alone
- 341,8894.9%Two or more races
- 84,4031.2%Other race alone
- 5,8380.08%American Indian alone
- 9760.01%Native Hawaiian and Other
Pacific Islander alone

Income and house value in Hadley
- Median household income in 2022
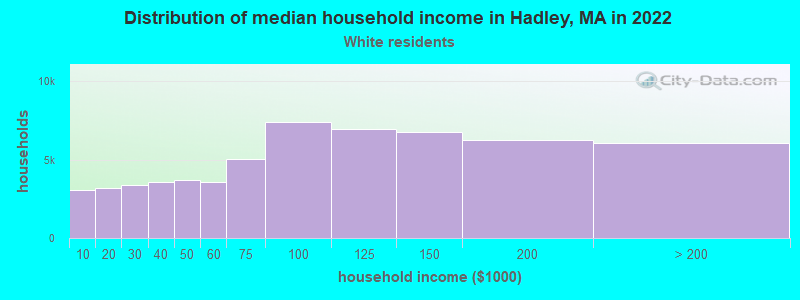
- $94,616White non-Hispanic householders
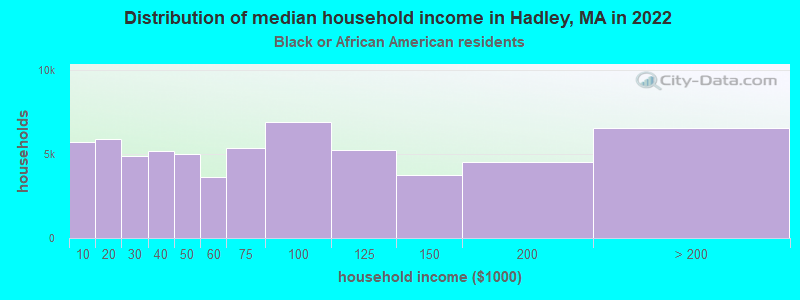
- $19,622Black householders
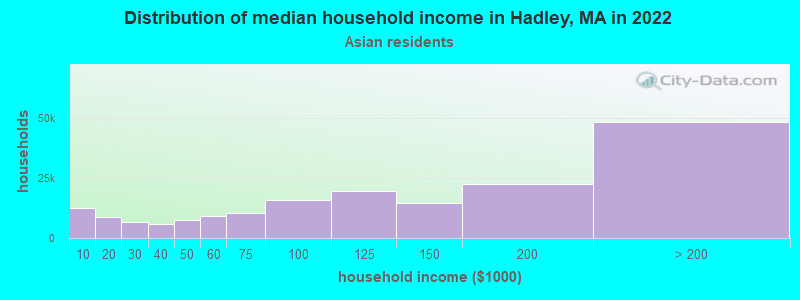
- $121,295Asian householders
- $92,651Some other race householders
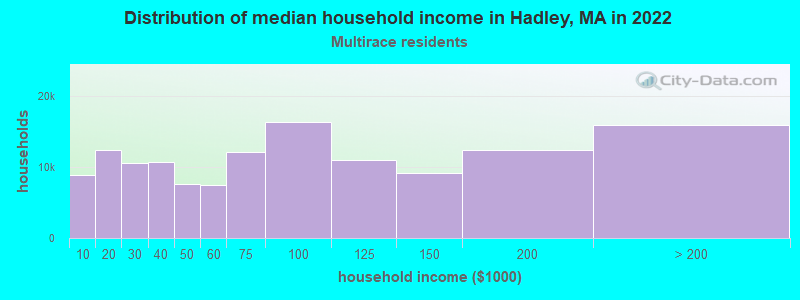
- $56,859Two or more races householders
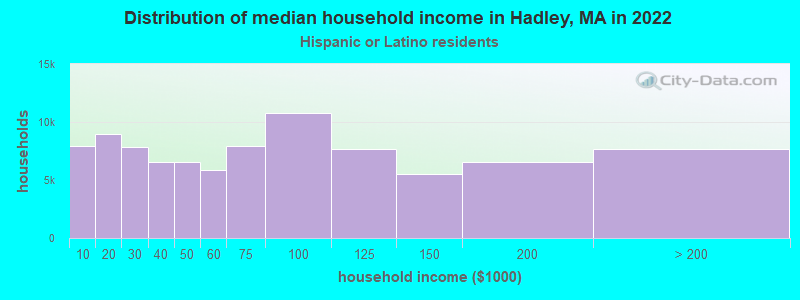
- $15,176Hispanic or Latino race householders
- Median 2022 house value
- $445,707White Non-Hispanic householders
- $584,747Black or African American householders
- $63,672Asian householders
- $422,317Some other race householders
- $376,837Two or more races householders
- $357,345Hispanic or Latino householders
Household income for White non-Hispanic householders
Household income for Black householders
Household income for Asian householders
Household income for Two or more races householders
Household income for Hispanic or Latino race householders
Foreign-born residents in Hadley
210 residents are foreign born (2.2% Europe, 1.5% Asia).
| This city: | 4.4% |
| Massachusetts: | 12.2% |
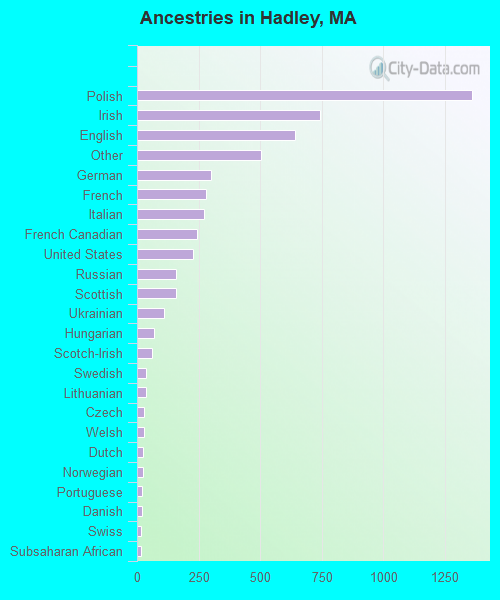
Ancestries in Hadley

- 1,36125.2%Polish
- 74413.8%Irish
- 64211.9%English
- 5029.3%Other
- 3015.6%German
- 2795.2%French
- 2705.0%Italian
- 2434.5%French Canadian
- 2284.2%United States
- 1603.0%Russian
- 1603.0%Scottish
- 1112.1%Ukrainian
- 691.3%Hungarian
- 611.1%Scotch-Irish
- 380.7%Swedish
- 370.7%Lithuanian
- 280.5%Czech
- 270.5%Welsh
- 260.5%Dutch
- 250.5%Norwegian
- 200.4%Portuguese
- 190.4%Danish
- 180.3%Swiss
- 170.3%Subsaharan African
- 50.09%Arab
- 40.07%West Indian
Zip codes: 01035.