Races in Hagerstown, Maryland (MD) Detailed Stats
Data:
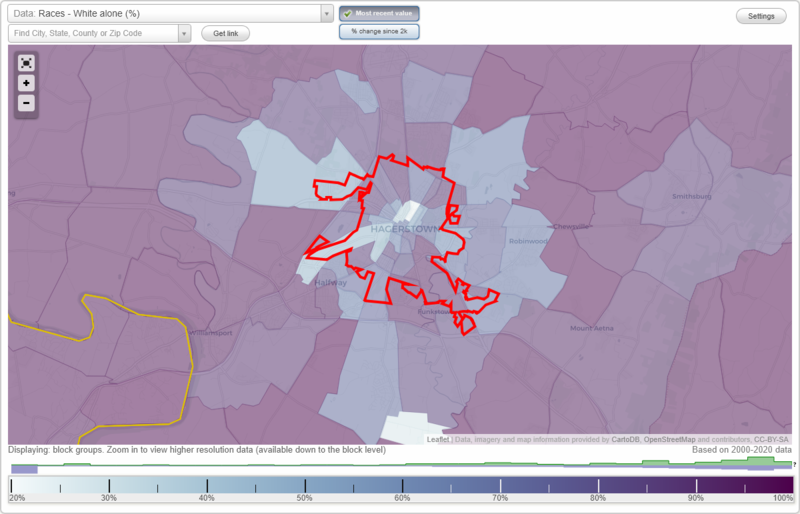
Races - White alone (%)
Races - White alone (% change since 2000)
Races - Black alone (%)
Races - Black alone (% change since 2000)
Races - American Indian alone (%)
Races - American Indian alone (% change since 2000)
Races - Asian alone (%)
Races - Asian alone (% change since 2000)
Races - Hispanic (%)
Races - Hispanic (% change since 2000)
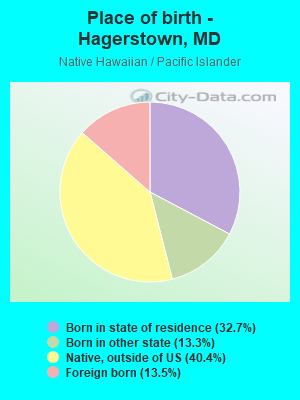
Races - Native Hawaiian and Other Pacific Islander alone (%)
Races - Native Hawaiian and Other Pacific Islander alone (% change since 2000)
Races - Two or more races(%)
Races - Two or more races(% change since 2000)
Races - Other race alone (%)
Races - Other race alone (% change since 2000)
Racial diversity
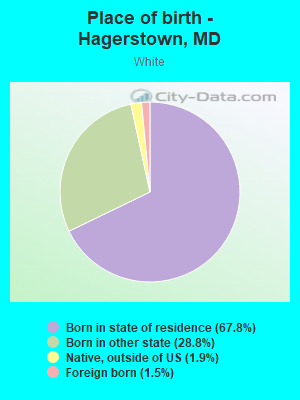
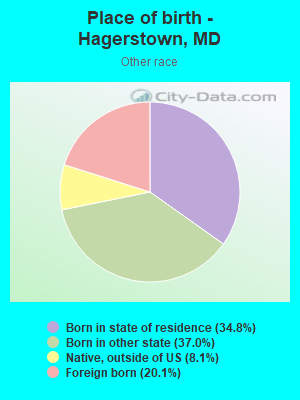
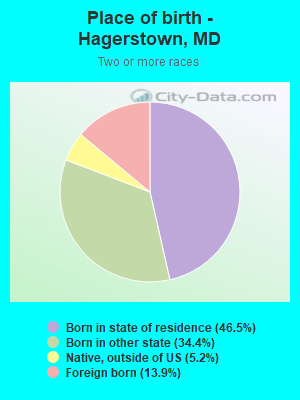
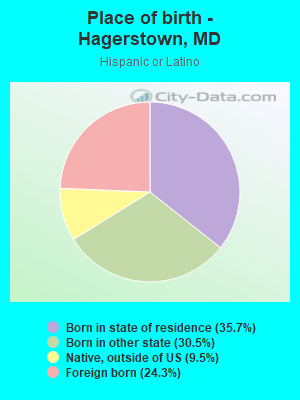
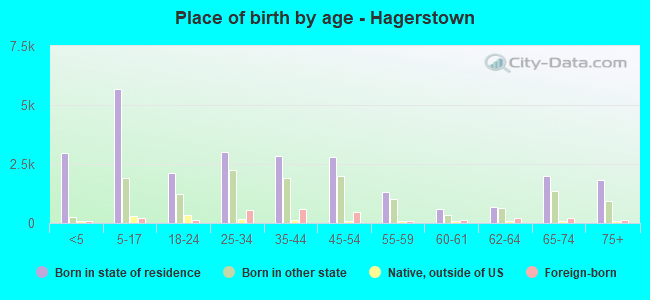
Place of birth - Born in state of residence (%)
Place of birth - Born in state of residence (%) - White
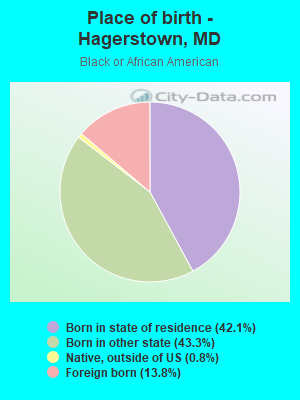
Place of birth - Born in state of residence (%) - Black or African American
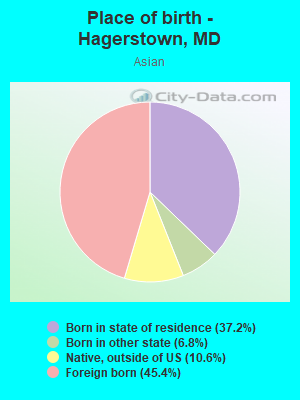
Place of birth - Born in state of residence (%) - Asian
Place of birth - Born in state of residence (%) - Hispanic or Latino
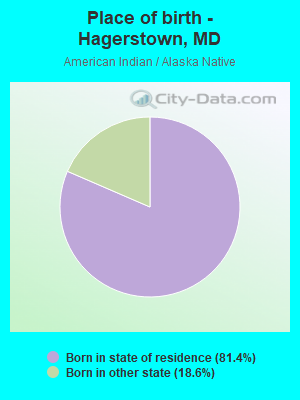
Place of birth - Born in state of residence (%) - American Indian and Alaska Native
Place of birth - Born in state of residence (%) - Multirace
Place of birth - Born in state of residence (%) - Other Race
Place of birth - Born in other state (%)
Place of birth - Born in other state (%) - White
Place of birth - Born in other state (%) - Black or African American
Place of birth - Born in other state (%) - Asian
Place of birth - Born in other state (%) - Hispanic or Latino
Place of birth - Born in other state (%) - American Indian and Alaska Native
Place of birth - Born in other state (%) - Multirace
Place of birth - Born in other state (%) - Other Race
Place of birth - Native, outside of US (%)
Place of birth - Native, outside of US (%) - White
Place of birth - Native, outside of US (%) - Black or African American
Place of birth - Native, outside of US (%) - Asian
Place of birth - Native, outside of US (%) - Hispanic or Latino
Place of birth - Native, outside of US (%) - American Indian and Alaska Native
Place of birth - Native, outside of US (%) - Multirace
Place of birth - Native, outside of US (%) - Other Race
Place of birth - Foreign born (%)
Place of birth - Foreign born (%) - White
Place of birth - Foreign born (%) - Black or African American
Place of birth - Foreign born (%) - Asian
Place of birth - Foreign born (%) - Hispanic or Latino
Place of birth - Foreign born (%) - American Indian and Alaska Native
Place of birth - Foreign born (%) - Multirace
Place of birth - Foreign born (%) - Other Race
Residents speaking English at home (%)
Residents speaking English at home - Born in the United States (%)
Residents speaking English at home - Native, born elsewhere (%)
Residents speaking English at home - Foreign born (%)
Residents speaking Spanish at home (%)
Residents speaking Spanish at home - Born in the United States (%)
Residents speaking Spanish at home - Native, born elsewhere (%)
Residents speaking Spanish at home - Foreign born (%)
Residents speaking other language at home (%)
Residents speaking other language at home - Born in the United States (%)
Residents speaking other language at home - Native, born elsewhere (%)
Residents speaking other language at home - Foreign born (%)
Marital status - Never married (%)
Marital status - Now married (%)
Marital status - Separated (%)
Marital status - Widowed (%)
Marital status - Divorced (%)
Ancestries Reported - Arab (%)
Ancestries Reported - Czech (%)
Ancestries Reported - Danish (%)
Ancestries Reported - Dutch (%)
Ancestries Reported - English (%)
Ancestries Reported - French (%)
Ancestries Reported - French Canadian (%)
Ancestries Reported - German (%)
Ancestries Reported - Greek (%)
Ancestries Reported - Hungarian (%)
Ancestries Reported - Irish (%)
Ancestries Reported - Italian (%)
Ancestries Reported - Lithuanian (%)
Ancestries Reported - Norwegian (%)
Ancestries Reported - Polish (%)
Ancestries Reported - Portuguese (%)
Ancestries Reported - Russian (%)
Ancestries Reported - Scotch-Irish (%)
Ancestries Reported - Scottish (%)
Ancestries Reported - Slovak (%)
Ancestries Reported - Subsaharan African (%)
Ancestries Reported - Swedish (%)
Ancestries Reported - Swiss (%)
Ancestries Reported - Ukrainian (%)
Ancestries Reported - United States (%)
Ancestries Reported - Welsh (%)
Ancestries Reported - West Indian (%)
Ancestries Reported - Other (%)
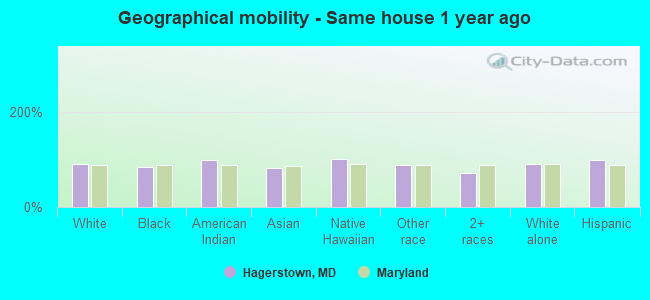
Geographical mobility - Same house 1 year ago (%)
Geographical mobility - Same house 1 year ago (%) - White
Geographical mobility - Same house 1 year ago (%) - Black or African American
Geographical mobility - Same house 1 year ago (%) - Asian
Geographical mobility - Same house 1 year ago (%) - Hispanic or Latino
Geographical mobility - Same house 1 year ago (%) - American Indian and Alaska Native
Geographical mobility - Same house 1 year ago (%) - Multirace
Geographical mobility - Same house 1 year ago (%) - Other Race
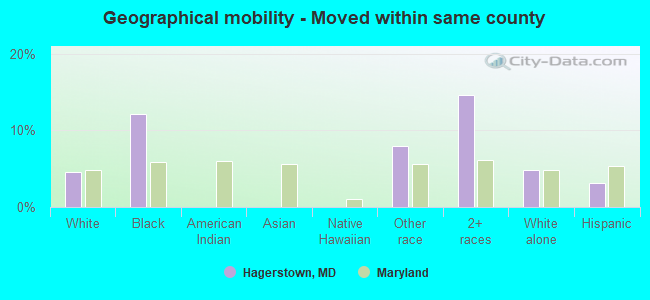
Geographical mobility - Moved within same county (%)
Geographical mobility - Moved within same county (%) - White
Geographical mobility - Moved within same county (%) - Black or African American
Geographical mobility - Moved within same county (%) - Asian
Geographical mobility - Moved within same county (%) - Hispanic or Latino
Geographical mobility - Moved within same county (%) - American Indian and Alaska Native
Geographical mobility - Moved within same county (%) - Multirace
Geographical mobility - Moved within same county (%) - Other Race
Geographical mobility - Moved from different county within same state (%)
Geographical mobility - Moved from different county within same state (%) - White
Geographical mobility - Moved from different county within same state (%) - Black or African American
Geographical mobility - Moved from different county within same state (%) - Asian
Geographical mobility - Moved from different county within same state (%) - Hispanic or Latino
Geographical mobility - Moved from different county within same state (%) - American Indian and Alaska Native
Geographical mobility - Moved from different county within same state (%) - Multirace
Geographical mobility - Moved from different county within same state (%) - Other Race
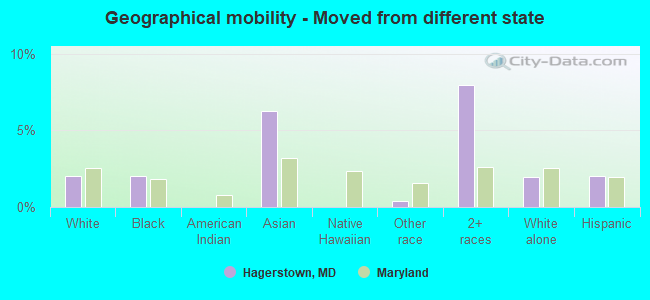
Geographical mobility - Moved from different state (%)
Geographical mobility - Moved from different state (%) - White
Geographical mobility - Moved from different state (%) - Black or African American
Geographical mobility - Moved from different state (%) - Asian
Geographical mobility - Moved from different state (%) - Hispanic or Latino
Geographical mobility - Moved from different state (%) - American Indian and Alaska Native
Geographical mobility - Moved from different state (%) - Multirace
Geographical mobility - Moved from different state (%) - Other Race
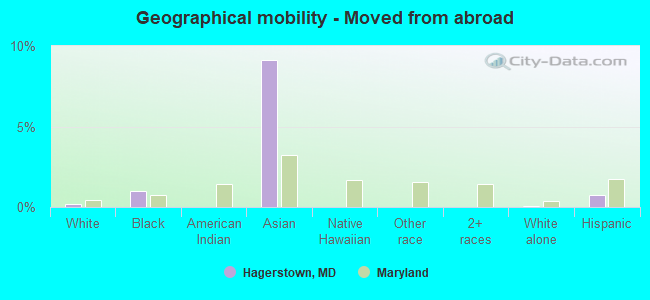
Geographical mobility - Moved from abroad (%)
Geographical mobility - Moved from abroad (%) - White
Geographical mobility - Moved from abroad (%) - Black or African American
Geographical mobility - Moved from abroad (%) - Asian
Geographical mobility - Moved from abroad (%) - Hispanic or Latino
Geographical mobility - Moved from abroad (%) - American Indian and Alaska Native
Geographical mobility - Moved from abroad (%) - Multirace
Geographical mobility - Moved from abroad (%) - Other Race
Place of birth for the foreign-born population - Ireland (%)
Place of birth for the foreign-born population - Denmark (%)
Place of birth for the foreign-born population - Norway (%)
Place of birth for the foreign-born population - Sweden (%)
Place of birth for the foreign-born population - United Kingdom (%)
Place of birth for the foreign-born population - England (%)
Place of birth for the foreign-born population - Scotland (%)
Place of birth for the foreign-born population - Other Northern Europe (%)
Place of birth for the foreign-born population - Austria (%)
Place of birth for the foreign-born population - Belgium (%)
Place of birth for the foreign-born population - France (%)
Place of birth for the foreign-born population - Germany (%)
Place of birth for the foreign-born population - Netherlands (%)
Place of birth for the foreign-born population - Switzerland (%)
Place of birth for the foreign-born population - Other Western Europe (%)
Place of birth for the foreign-born population - Greece (%)
Place of birth for the foreign-born population - Italy (%)
Place of birth for the foreign-born population - Portugal (%)
Place of birth for the foreign-born population - Spain (%)
Place of birth for the foreign-born population - Other Southern Europe (%)
Place of birth for the foreign-born population - Albania (%)
Place of birth for the foreign-born population - Belarus (%)
Place of birth for the foreign-born population - Bosnia and Herzegovina (%)
Place of birth for the foreign-born population - Bulgaria (%)
Place of birth for the foreign-born population - Croatia (%)
Place of birth for the foreign-born population - Czechoslovakia (%)
Place of birth for the foreign-born population - Hungary (%)
Place of birth for the foreign-born population - Latvia (%)
Place of birth for the foreign-born population - Lithuania (%)
Place of birth for the foreign-born population - North Macedonia (Macedonia) (%)
Place of birth for the foreign-born population - Moldova (%)
Place of birth for the foreign-born population - Poland (%)
Place of birth for the foreign-born population - Romania (%)
Place of birth for the foreign-born population - Russia (%)
Place of birth for the foreign-born population - Serbia (%)
Place of birth for the foreign-born population - Ukraine (%)
Place of birth for the foreign-born population - Other Eastern Europe (%)
Place of birth for the foreign-born population - China (%)
Place of birth for the foreign-born population - Hong Kong (%)
Place of birth for the foreign-born population - Taiwan (%)
Place of birth for the foreign-born population - Japan (%)
Place of birth for the foreign-born population - Korea (%)
Place of birth for the foreign-born population - Other Eastern Asia (%)
Place of birth for the foreign-born population - Afghanistan (%)
Place of birth for the foreign-born population - Bangladesh (%)
Place of birth for the foreign-born population - India (%)
Place of birth for the foreign-born population - Iran (%)
Place of birth for the foreign-born population - Kazakhstan (%)
Place of birth for the foreign-born population - Nepal (%)
Place of birth for the foreign-born population - Pakistan (%)
Place of birth for the foreign-born population - Sri Lanka (%)
Place of birth for the foreign-born population - Uzbekistan (%)
Place of birth for the foreign-born population - Other South Central Asia (%)
Place of birth for the foreign-born population - Burma (%)
Place of birth for the foreign-born population - Cambodia (%)
Place of birth for the foreign-born population - Indonesia (%)
Place of birth for the foreign-born population - Laos (%)
Place of birth for the foreign-born population - Malaysia (%)
Place of birth for the foreign-born population - Philippines (%)
Place of birth for the foreign-born population - Singapore (%)
Place of birth for the foreign-born population - Thailand (%)
Place of birth for the foreign-born population - Vietnam (%)
Place of birth for the foreign-born population - Other South Eastern Asia (%)
Place of birth for the foreign-born population - Armenia (%)
Place of birth for the foreign-born population - Iraq (%)
Place of birth for the foreign-born population - Israel (%)
Place of birth for the foreign-born population - Jordan (%)
Place of birth for the foreign-born population - Kuwait (%)
Place of birth for the foreign-born population - Lebanon (%)
Place of birth for the foreign-born population - Saudi Arabia (%)
Place of birth for the foreign-born population - Syria (%)
Place of birth for the foreign-born population - Turkey (%)
Place of birth for the foreign-born population - Yemen (%)
Place of birth for the foreign-born population - Other Western Asia (%)
Place of birth for the foreign-born population - Eritrea (%)
Place of birth for the foreign-born population - Ethiopia (%)
Place of birth for the foreign-born population - Kenya (%)
Place of birth for the foreign-born population - Somalia (%)
Place of birth for the foreign-born population - Uganda (%)
Place of birth for the foreign-born population - Zimbabwe (%)
Place of birth for the foreign-born population - Other Eastern Africa (%)
Place of birth for the foreign-born population - Cameroon (%)
Place of birth for the foreign-born population - Congo (%)
Place of birth for the foreign-born population - Democratic Republic of Congo (Zaire) (%)
Place of birth for the foreign-born population - Other Middle Africa (%)
Place of birth for the foreign-born population - Egypt (%)
Place of birth for the foreign-born population - Morocco (%)
Place of birth for the foreign-born population - Sudan (%)
Place of birth for the foreign-born population - Other Northern Africa (%)
Place of birth for the foreign-born population - South Africa (%)
Place of birth for the foreign-born population - Other Southern Africa (%)
Place of birth for the foreign-born population - Cabo Verde (%)
Place of birth for the foreign-born population - Ghana (%)
Place of birth for the foreign-born population - Liberia (%)
Place of birth for the foreign-born population - Nigeria (%)
Place of birth for the foreign-born population - Senegal (%)
Place of birth for the foreign-born population - Sierra Leone (%)
Place of birth for the foreign-born population - Other Western Africa (%)
Place of birth for the foreign-born population - Australia (%)
Place of birth for the foreign-born population - New Zealand (%)
Place of birth for the foreign-born population - Fiji (%)
Place of birth for the foreign-born population - Micronesia (%)
Place of birth for the foreign-born population - Bahamas (%)
Place of birth for the foreign-born population - Barbados (%)
Place of birth for the foreign-born population - Cuba (%)
Place of birth for the foreign-born population - Dominica (%)
Place of birth for the foreign-born population - Dominican Republic (%)
Place of birth for the foreign-born population - Grenada (%)
Place of birth for the foreign-born population - Haiti (%)
Place of birth for the foreign-born population - Jamaica (%)
Place of birth for the foreign-born population - St. Vincent and the Grenadines (%)
Place of birth for the foreign-born population - Trinidad and Tobago (%)
Place of birth for the foreign-born population - West Indies (%)
Place of birth for the foreign-born population - Other Caribbean (%)
Place of birth for the foreign-born population - Belize (%)
Place of birth for the foreign-born population - Costa Rica (%)
Place of birth for the foreign-born population - El Salvador (%)
Place of birth for the foreign-born population - Guatemala (%)
Place of birth for the foreign-born population - Honduras (%)
Place of birth for the foreign-born population - Mexico (%)
Place of birth for the foreign-born population - Nicaragua (%)
Place of birth for the foreign-born population - Panama (%)
Place of birth for the foreign-born population - Other Central America (%)
Place of birth for the foreign-born population - Argentina (%)
Place of birth for the foreign-born population - Bolivia (%)
Place of birth for the foreign-born population - Brazil (%)
Place of birth for the foreign-born population - Chile (%)
Place of birth for the foreign-born population - Colombia (%)
Place of birth for the foreign-born population - Ecuador (%)
Place of birth for the foreign-born population - Guyana (%)
Place of birth for the foreign-born population - Peru (%)
Place of birth for the foreign-born population - Uruguay (%)
Place of birth for the foreign-born population - Venezuela (%)
Place of birth for the foreign-born population - Other South America (%)
Place of birth for the foreign-born population - Canada (%)
Place of birth for the foreign-born population - Other Northern America (%)
Place of birth for the foreign-born population - Other (%)
Latest news about races in Hagerstown, MD collected exclusively by city-data.com from local newspapers, TV, and radio stations
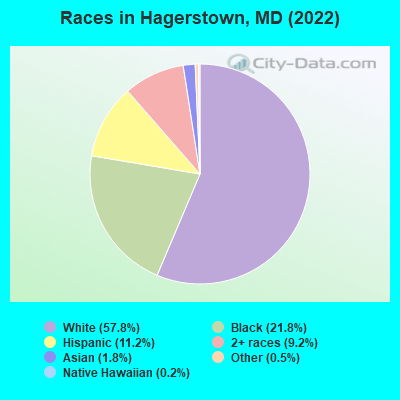
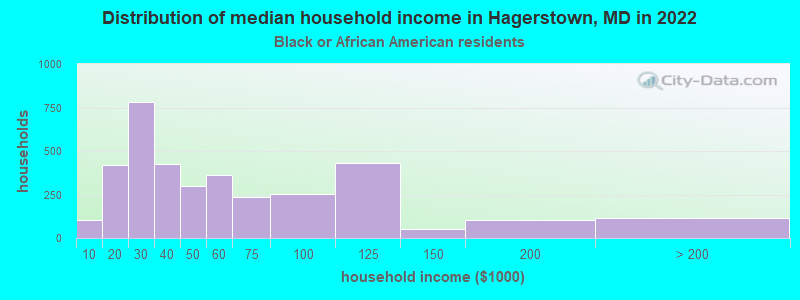
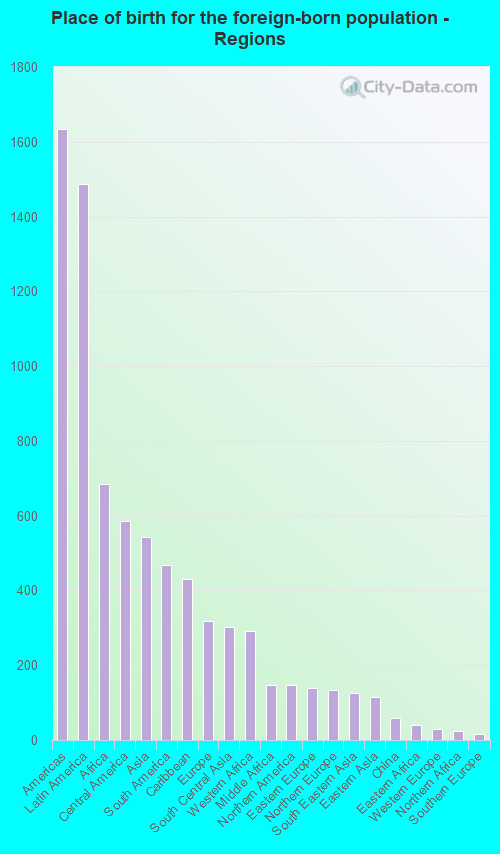
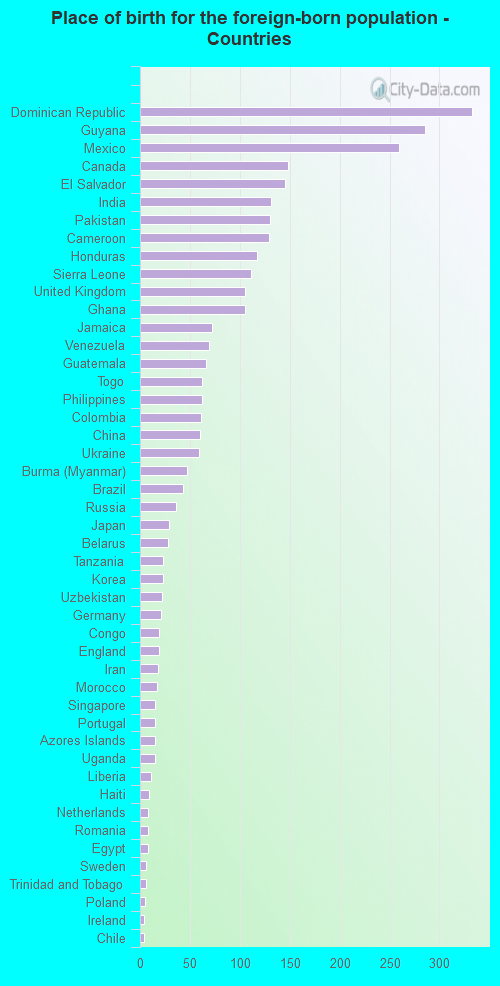
According to 2022 data, the most numerous races in Hagerstown, MD are White alone (25,203 residents), Black alone (9,527 residents), and Hispanic (4,885 residents). 86.7% of Hagerstown residents speak English at home. 7.3% of Hagerstown, MD residents are foreign-born (3.2% born in Latin America, 1.5% born in Africa, 1.2% born in Asia), which is 119.4% less than the foreign-born rate of 16.0% across the entire state of Maryland.
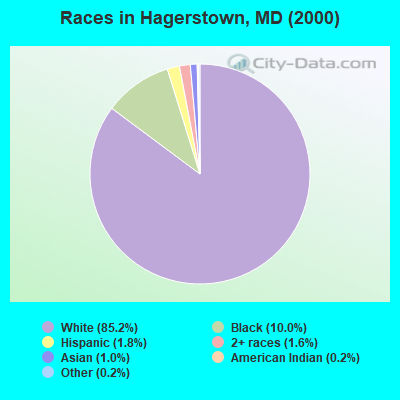
Race distribution in Hagerstown
2000 2022
3,286,547 62.1% White alone 1,464,735 27.7% Black alone 227,916 4.3% Hispanic 209,738 4.0% Asian alone 82,946 1.6% Two or more races 13,312 0.3% American Indian alone 9,379 0.2% Other race alone 1,913 0.04% Native Hawaiian and Other
2,906,492 47.1% White alone 1,800,914 29.2% Black alone 705,842 11.4% Hispanic 401,818 6.5% Asian alone 291,317 4.7% Two or more races 46,930 0.8% Other race alone 8,930 0.1% American Indian alone 2,417 0.04% Native Hawaiian and Other
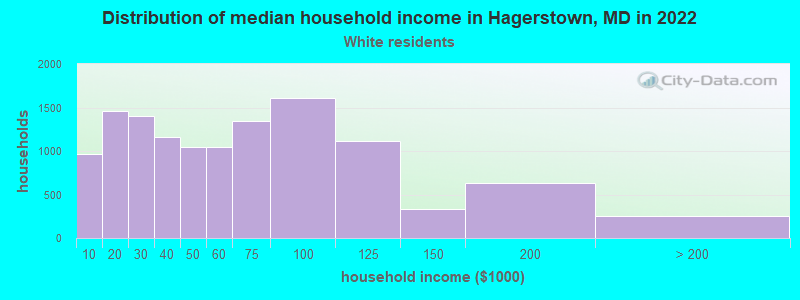
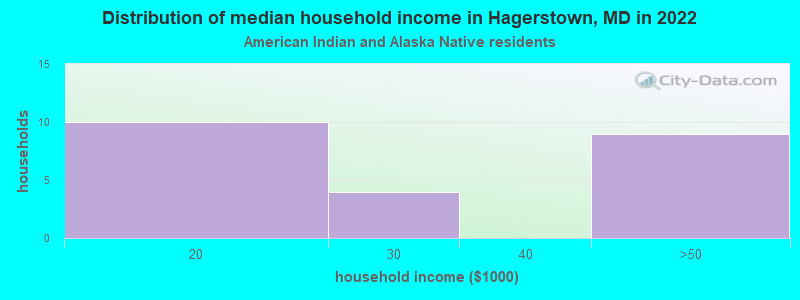
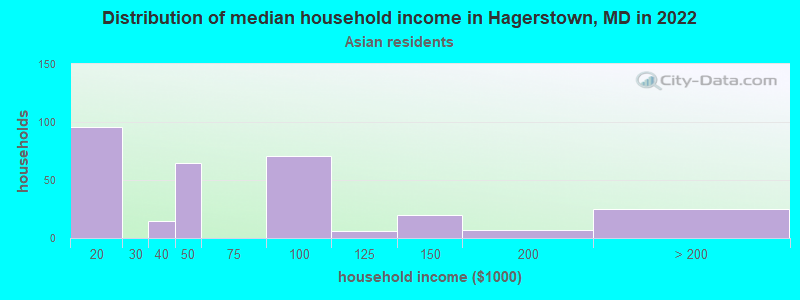
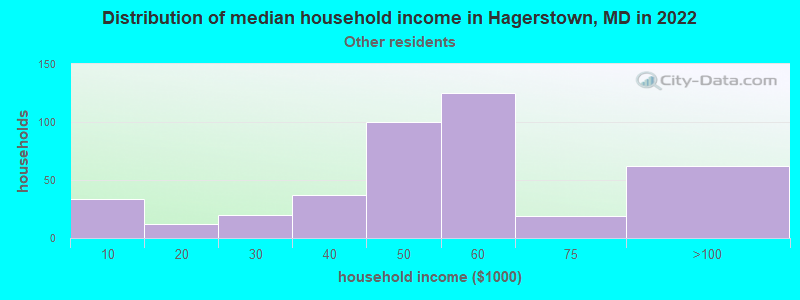
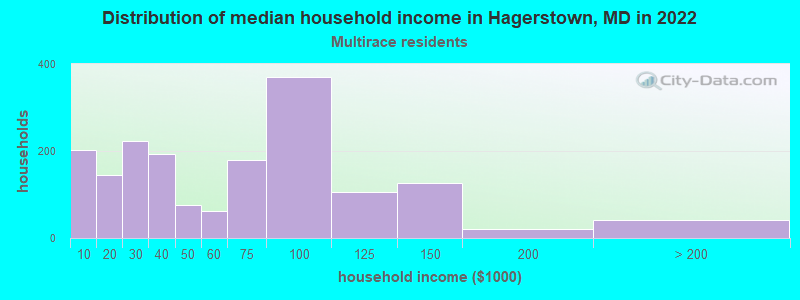
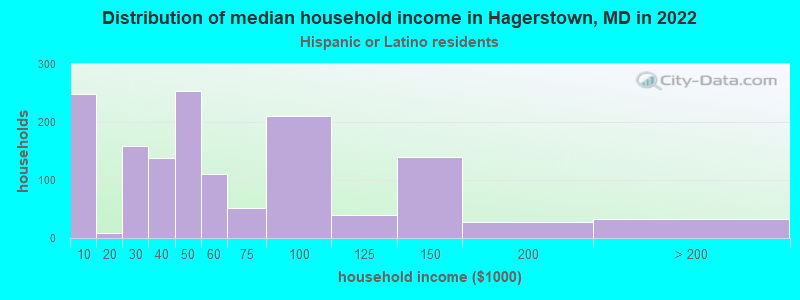
Income and house value in Hagerstown Median household income in 2022 $47,964 White non-Hispanic householders$47,450 Black householders$45,845 Some other race householders$42,641 Two or more races householders$45,927 Hispanic or Latino race householdersMedian 2022 house value $209,220 White Non-Hispanic householders$168,356 Black or African American householders$151,777 American Indian or Alaska Native householders $191,473 Asian householders$379,444 Two or more races householders$219,727 Hispanic or Latino householders
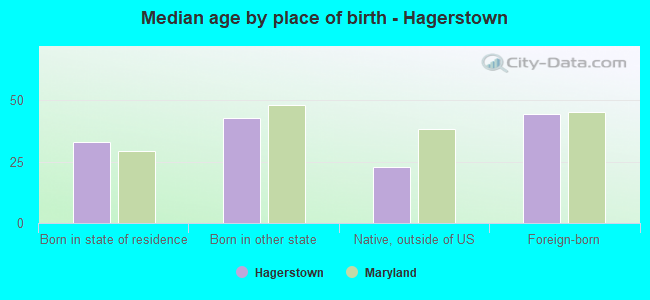
Median age by race in Hagerstown
42.7 Median age for White residents41.6 43.9 31.9 Median age for Black or African American residents29.9 33.3 54.8 Median age for American Indian / Alaska Native residents54.6 -635,201,572.6 35.1 Median age for Asian residents27.5 50.8 42.9 Median age for Native Hawaiian / Pacific Islander residents85.3 -760,942,760.2 32.2 Median age for Other race residents32.3 29.1 17.0 Median age for Two or more races residents16.1 15.1 44.3 Median age for White alone residents42.5 46.0 21.8 Median age for Hispanic or Latino residents30.8 21.0
Owner/renter occupied households by race in Hagerstown
House owners and renters - White residents 5,532 45.6% Owner occupied6,588 54.4% Renter occupiedHouse owners and renters - Black or African American residents 877 21.0% Owner occupied3,291 79.0% Renter occupiedHouse owners and renters - American Indian / Alaska Native residents 7 26.1% Owner occupied19 73.9% Renter occupiedHouse owners and renters - Asian residents 94 27.9% Owner occupied244 72.1% Renter occupiedHouse owners and renters - Other race residents 109 42.2% Owner occupied149 57.8% Renter occupiedHouse owners and renters - Two or more races residents 646 28.0% Owner occupied1,664 72.0% Renter occupiedHouse owners and renters - White alone residents 5,425 46.3% Owner occupied6,298 53.7% Renter occupiedHouse owners and renters - Hispanic or Latino residents 423 28.8% Owner occupied1,047 71.2% Renter occupied
Language usage in Hagerstown
English speakers - Total 86.7% of residents of Hagerstown speak English at home.
8.2% of residents speak Spanish at home 2,403 72.6% Speak English very well908 27.4% Speak English less than very well5.9% of residents speak other language at home 1,992 83.3% Speak English very well399 16.7% Speak English less than very well
English speakers - Born in the United States 90.1% of residents of Hagerstown speak English at home.
8.4% of residents speak Spanish at home 948 84.3% Speak English very well176 15.7% Speak English less than very well2.1% of residents speak other language at home 285 100.0% Speak English very well
English speakers - Native, born elsewhere 41.7% of residents of Hagerstown speak English at home.
44.6% of residents speak Spanish at home 373 85.7% Speak English very well62 14.3% Speak English less than very well19.9% of residents speak other language at home 194 100.0% Speak English very well
English speakers - Foreign-born 18.0% of residents of Hagerstown speak English at home.
36.0% of residents speak Spanish at home 535 49.8% Speak English very well539 50.2% Speak English less than very well45.8% of residents speak other language at home 1,055 77.2% Speak English very well312 22.8% Speak English less than very well
White (Caucasian) - Speak only English Native:
95.9% (23,677)Foreign-born:
29.9% (119)
White (Caucasian) - Speak another language Native:
4.2% (1,041)Foreign-born:
71.1% (283)
Black or African American - Speak only English Native:
94.9% (7,329)Foreign-born:
34.5% (469)
Black or African American - Speak another language Native:
4.7% (360)Foreign-born:
66.5% (904)
Asian - Speak only English Native:
35.5% (123)Foreign-born:
15.9% (58)
Asian - Speak another language Native:
64.3% (223)Foreign-born:
84.7% (311)
Native Hawaiian / Pacific Islander - Speak another language Native:
92.4% (60)Foreign-born:
100.0% (15)
Other race - Speak another language Native:
58.2% (251)Foreign-born:
100.0% (302)
Two or more races - Speak another language Native:
38.8% (1,894)Foreign-born:
57.8% (548)
White alone - Speak only English Native:
97.9% (23,100)Foreign-born:
41.0% (90)
White alone - Speak another language Native:
2.1% (501)Foreign-born:
60.1% (132)
Hispanic or Latino - Speak only English Native:
32.8% (1,043)Foreign-born:
8.6% (103)
Hispanic or Latino - Speak another language Native:
71.9% (2,285)Foreign-born:
93.9% (1,125)
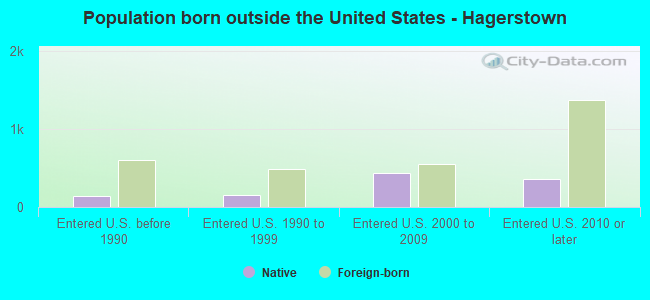
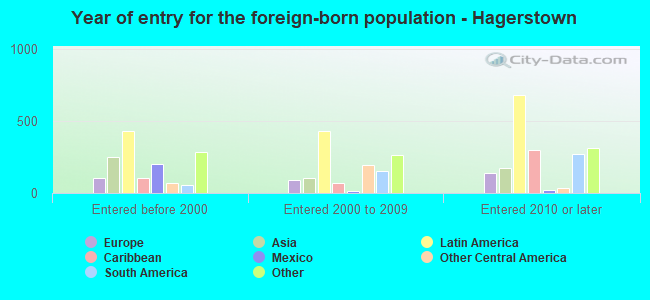
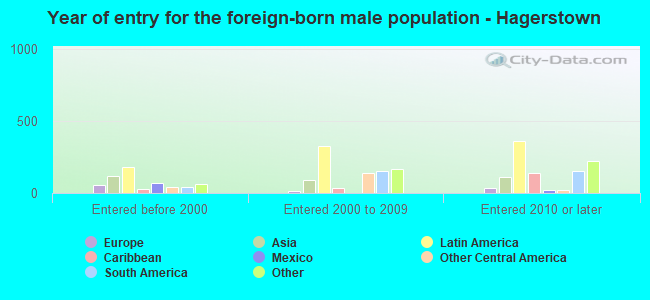
Foreign-born residents in Hagerstown 3,183 residents are foreign born (3.2% Latin America , 1.5% Africa , 1.2% Asia ).
This city:
7.3%Maryland:
15.7%
Marital status for residents in Hagerstown Marital status - White (Caucasian) population 15 years and over
Males 35.3% Never married42.7% Now married2.7% Separated3.8% Widowed15.4% DivorcedFemales 29.5% Never married39.0% Now married2.6% Separated10.8% Widowed18.2% DivorcedWomen who gave birth in the past 12 months Now married:
48.4% (211)Unmarried:
51.6% (225)
Women who did not give birth in the past 12 months Now married:
40.4% (2,288)Unmarried:
59.6% (3,377)
Marital status - Black or African American population 15 years and over
Males 56.3% Never married24.0% Now married2.7% Separated1.1% Widowed15.9% DivorcedFemales 43.5% Never married30.3% Now married2.4% Separated6.1% Widowed17.7% DivorcedWomen who gave birth in the past 12 months Now married:
33.6% (101)Unmarried:
66.4% (200)
Women who did not give birth in the past 12 months Now married:
30.0% (498)Unmarried:
70.0% (1,160)
Marital status - Asian population 15 years and over
Males 40.2% Never married51.7% Now married5.9% Separated0.0% Widowed2.2% DivorcedFemales 8.1% Never married70.7% Now married0.0% Separated10.8% Widowed10.4% DivorcedWomen who did not give birth in the past 12 months Now married:
86.9% (139)Unmarried:
13.1% (21)
Marital status - Native Hawaiian / Pacific Islander population 15 years and over
Males 0.0% Never married100.0% Now married0.0% Separated0.0% Widowed0.0% DivorcedFemales 0.0% Never married100.0% Now married0.0% Separated0.0% Widowed0.0% DivorcedWomen who did not give birth in the past 12 months Now married:
100.0% (15)Unmarried:
0.0% (0)
Marital status - Other race population 15 years and over
Males 71.8% Never married22.9% Now married2.9% Separated0.0% Widowed2.5% DivorcedFemales 45.7% Never married14.0% Now married15.9% Separated8.9% Widowed15.5% DivorcedWomen who gave birth in the past 12 months Now married:
0.0% (0)Unmarried:
100.0% (46)
Women who did not give birth in the past 12 months Now married:
30.3% (41)Unmarried:
69.7% (95)
Marital status - Two or more races population 15 years and over
Males 50.0% Never married28.7% Now married15.2% Separated0.0% Widowed6.1% DivorcedFemales 48.8% Never married22.9% Now married7.7% Separated2.1% Widowed18.5% DivorcedWomen who gave birth in the past 12 months Now married:
100.0% (1)Unmarried:
0.0% (0)
Women who did not give birth in the past 12 months Now married:
29.9% (450)Unmarried:
70.1% (1,053)
Marital status - White alone, not Hispanic / Latino population 15 years and over
Males 36.1% Never married42.1% Now married2.9% Separated3.1% Widowed15.8% DivorcedFemales 29.2% Never married38.3% Now married2.5% Separated11.3% Widowed18.7% DivorcedWomen who gave birth in the past 12 months Now married:
43.0% (161)Unmarried:
57.0% (214)
Women who did not give birth in the past 12 months Now married:
40.5% (2,146)Unmarried:
59.5% (3,157)
Marital status - Hispanic or Latino population 15 years and over
Males 37.3% Never married44.3% Now married3.8% Separated6.7% Widowed8.0% DivorcedFemales 41.8% Never married37.8% Now married9.1% Separated0.5% Widowed10.8% DivorcedWomen who gave birth in the past 12 months Now married:
52.0% (65)Unmarried:
48.0% (60)
Women who did not give birth in the past 12 months Now married:
37.5% (415)Unmarried:
62.5% (693)
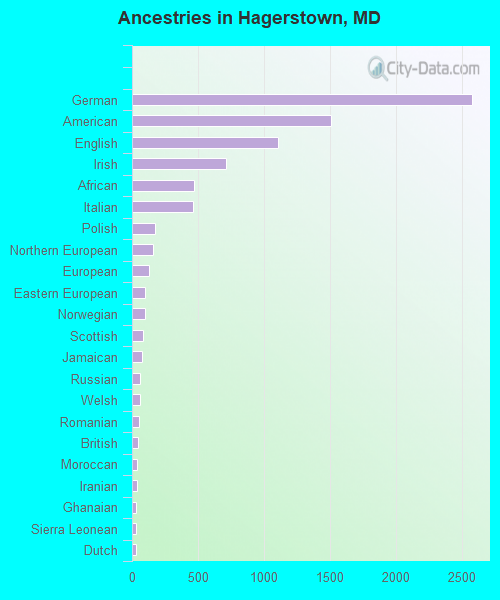
Ancestries in Hagerstown
2,578 15.1% German1,508 8.8% American1,110 6.5% English712 4.2% Irish472 2.8% African460 2.7% Italian176 1.0% Polish161 0.9% Northern European129 0.8% European97 0.6% Eastern European96 0.6% Norwegian81 0.5% Scottish75 0.4% Jamaican58 0.3% Russian57 0.3% Welsh55 0.3% Romanian42 0.2% British41 0.2% Moroccan35 0.2% Iranian29 0.2% Ghanaian29 0.2% Sierra Leonean27 0.2% Dutch20 0.1% Scotch-Irish19 0.1% Danish18 0.1% Hungarian17 0.10% French16 0.09% Celtic16 0.09% Ukrainian14 0.08% Slavic13 0.08% Swedish10 0.06% Swiss10 0.06% Haitian10 0.06% West Indian8 0.05% Egyptian7 0.04% Canadian6 0.04% Lithuanian5 0.03% Czechoslovakian3 0.02% Australian2 0.01% Austrian2 0.01% Scandinavian
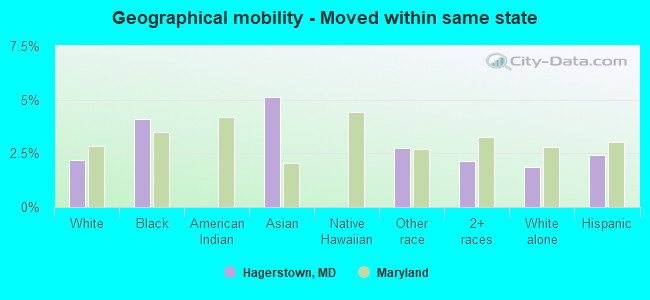
Geographical mobility in Hagerstown Same house 1 year ago 23,737 90.2% White (Caucasian)7,942 82.6% Black or African American34 98.9% American Indian / Alaska Native655 80.8% Asian109 100.0% Native Hawaiian / Pacific Islander677 88.2% Other race4,409 72.1% Two or more races22,389 90.3% White alone, not Hispanic / Latino4,851 99.1% Hispanic or LatinoMoved within same county 1,205 4.6% White / Caucasian1,164 12.1% Black or African American61 8.0% Other race891 14.6% Two or more races1,208 4.9% White alone, not Hispanic / Latino153 3.1% Hispanic or LatinoMoved within same state 580 2.2% White / Caucasian395 4.1% Black or African American42 5.1% Asian21 2.8% Other race130 2.1% Two or more races463 1.9% White alone, not Hispanic / Latino120 2.4% Hispanic or LatinoMoved from different state 528 2.0% White / Caucasian194 2.0% Black or African American51 6.2% Asian3 0.4% Other race487 8.0% Two or more races489 2.0% White alone, not Hispanic / Latino99 2.0% Hispanic or LatinoMoved from abroad 41 0.2% White94 1.0% Black or African American74 9.1% Asian16 0.1% White alone, not Hispanic / Latino37 0.8% Hispanic or Latino
Children Nativity (place of birth) in Hagerstown
Children under 6 years - Living with two parents Both parents native 1,339 100.0% NativeBoth parents foreign-born 258 95.6% Native12 4.4% Foreign-bornOne native, one foreign-born parent 218 100.0% NativeChildren under 6 years - Living with one parent Native parent 1,605 100.0% NativeForeign-born parent 98 100.0% NativeChildren 6 to 17 years - Living with two parents Both parents native 1,924 100.0% NativeBoth parents foreign-born 367 80.0% Native92 20.0% Foreign-bornOne native, one foreign-born parent 259 95.9% Native11 4.1% Foreign-bornChildren 6 to 17 years - Living with one parent Native parent 3,472 100.0% NativeForeign-born parent 251 55.7% Native200 44.3% Foreign-born
Grandparents responsible for own grandchildren in Hagerstown
Grandparents (30 to 59 years) White / Caucasian 184 55.6% Responsible for grandchildren147 44.4% Not responsible for grandchildrenBlack or African American 43 100.0% Not responsible for grandchildrenAsian 35 100.0% Responsible for grandchildrenTwo or more races 41 100.0% Not responsible for grandchildrenWhite alone, not Hispanic / Latino 186 56.9% Responsible for grandchildren141 43.1% Not responsible for grandchildrenHispanic or Latino 8 100.0% Not responsible for grandchildrenGrandparents (60 years and over) White / Caucasian 104 37.2% Responsible for grandchildren175 62.8% Not responsible for grandchildrenBlack or African American 52 64.2% Responsible for grandchildren29 35.8% Not responsible for grandchildrenAsian 20 100.0% Not responsible for grandchildrenTwo or more races 83 61.7% Responsible for grandchildren52 38.3% Not responsible for grandchildrenWhite alone, not Hispanic / Latino 78 32.8% Responsible for grandchildren161 67.2% Not responsible for grandchildrenHispanic or Latino 77 63.0% Responsible for grandchildren46 37.0% Not responsible for grandchildren