Races in Hampton Falls, New Hampshire (NH) Detailed Stats
Ancestries, Foreign-born residents, place of birth

Recent posts about races in Hampton Falls, New Hampshire on our local forum with over 2,400,000 registered users:
 | Tiny house living - legally difficult in New Hampshire (12 replies) |
| Around 95 up to Portsmouth - Looking to buy a house in good school district 475k (11 replies) |
| Moving to southeast NH, looking for suggestions (22 replies) |
| Seacoast- In Depth (26 replies) |
| Coastal area living (27 replies) |
| Hello all! Would like responses from all people from NH! (42 replies) |
2.4% of Hampton Falls, NH residents are foreign-born (0.9% born in Asia, 0.7% born in Europe, 0.5% born in North America, 0.3% born in Latin America), which is 104.3% less than the foreign-born rate of 5.0% across the entire state of New Hampshire.
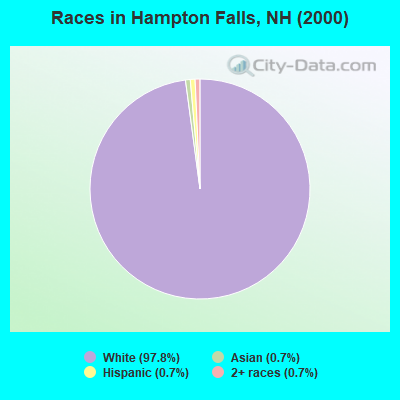
Race distribution in Hampton Falls

- 1,83997.8%White alone
- 130.7%Hispanic
- 130.7%Two or more races
- 140.7%Asian alone
- 10.05%Black alone
2000
2022
-
- 1,175,25295.1%White alone
- 20,4891.7%Hispanic
- 15,8031.3%Asian alone
- 11,6060.9%Two or more races
- 8,3540.7%Black alone
- 2,6980.2%American Indian alone
- 1,2540.1%Other race alone
- 3300.03%Native Hawaiian and Other
Pacific Islander alone

-
- 1,208,10186.6%White alone
- 63,4794.5%Hispanic
- 60,7244.4%Two or more races
- 36,5192.6%Asian alone
- 17,9311.3%Black alone
- 6,6150.5%Other race alone
- 1,0140.07%American Indian alone
- 8480.06%Native Hawaiian and Other
Pacific Islander alone

Income and house value in Hampton Falls
- Median household income in 2022
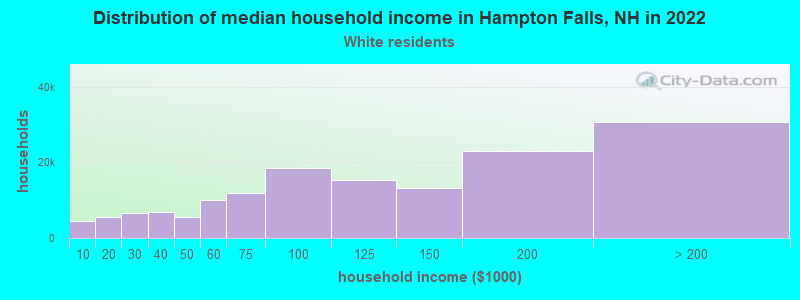
- $141,279White non-Hispanic householders
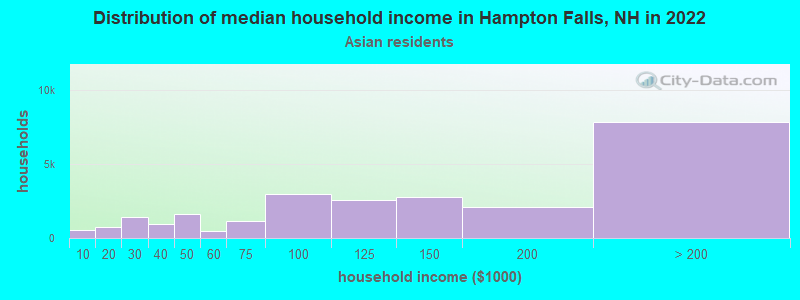
- over $200,000Asian householders
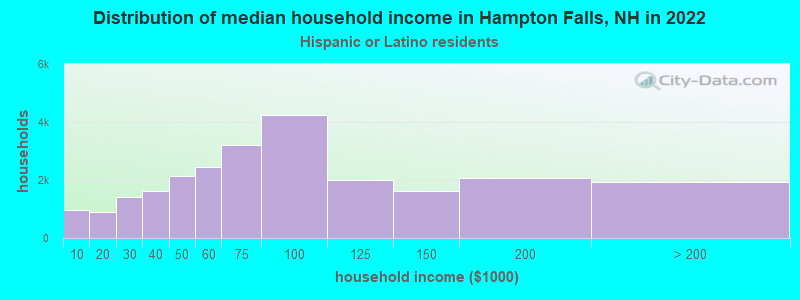
- $100,342Hispanic or Latino race householders
- Median 2022 house value
- $810,342White Non-Hispanic householders
- $916,677Asian householders
- over $1,000,000Hispanic or Latino householders
Household income for White non-Hispanic householders
Household income for Asian householders
Household income for Hispanic or Latino race householders
Foreign-born residents in Hampton Falls
46 residents are foreign born (0.9% Asia, 0.7% Europe, 0.5% North America, 0.3% Latin America).
| This city: | 2.4% |
| New Hampshire: | 4.4% |
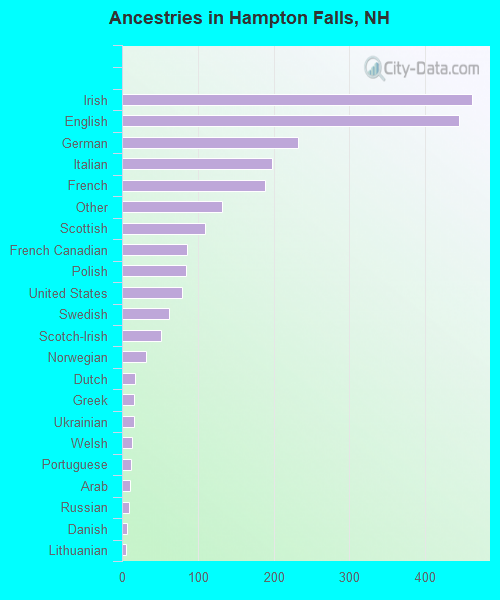
Ancestries in Hampton Falls

- 46120.3%Irish
- 44419.5%English
- 23210.2%German
- 1988.7%Italian
- 1888.3%French
- 1325.8%Other
- 1094.8%Scottish
- 863.8%French Canadian
- 853.7%Polish
- 793.5%United States
- 622.7%Swedish
- 512.2%Scotch-Irish
- 321.4%Norwegian
- 170.7%Dutch
- 160.7%Greek
- 160.7%Ukrainian
- 130.6%Welsh
- 120.5%Portuguese
- 100.4%Arab
- 90.4%Russian
- 60.3%Danish
- 50.2%Lithuanian
- 40.2%Czech
- 20.09%Hungarian
- 20.09%Subsaharan African
- 20.09%West Indian
Zip codes: 03844.