Races in Hancock, New Hampshire (NH) Detailed Stats
Ancestries, Foreign-born residents, place of birth
Data:
Latest news about races in Hancock, NH collected exclusively by city-data.com from local newspapers, TV, and radio stations
1.3% of Hancock, NH residents are foreign-born , which is 278.0% less than the foreign-born rate of 5.0% across the entire state of New Hampshire.
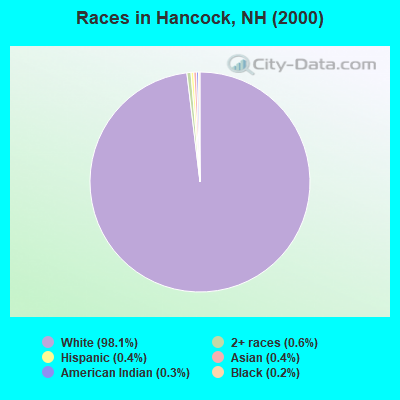
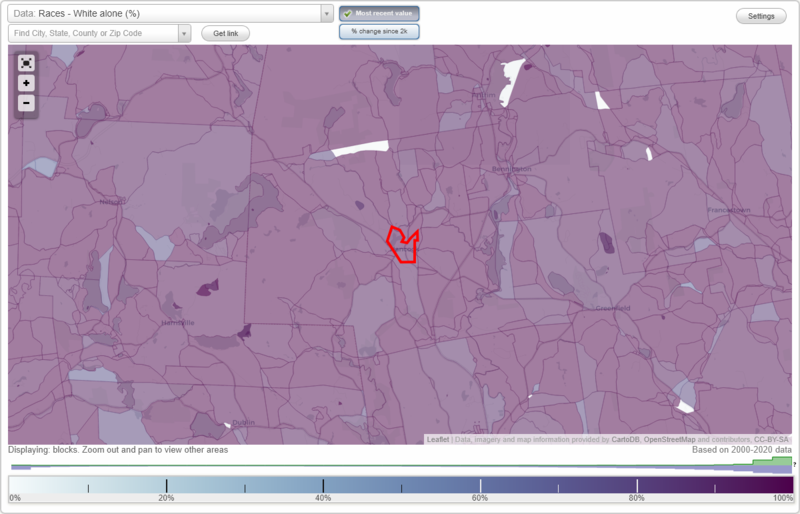
Race distribution in Hancock

- 1,70698.1%White alone
- 100.6%Two or more races
- 70.4%Hispanic
- 70.4%Asian alone
- 50.3%American Indian alone
- 40.2%Black alone
2000
2022
-
- 1,175,25295.1%White alone
- 20,4891.7%Hispanic
- 15,8031.3%Asian alone
- 11,6060.9%Two or more races
- 8,3540.7%Black alone
- 2,6980.2%American Indian alone
- 1,2540.1%Other race alone
- 3300.03%Native Hawaiian and Other
Pacific Islander alone
-
- 1,208,10186.6%White alone
- 63,4794.5%Hispanic
- 60,7244.4%Two or more races
- 36,5192.6%Asian alone
- 17,9311.3%Black alone
- 6,6150.5%Other race alone
- 1,0140.07%American Indian alone
- 8480.06%Native Hawaiian and Other
Pacific Islander alone
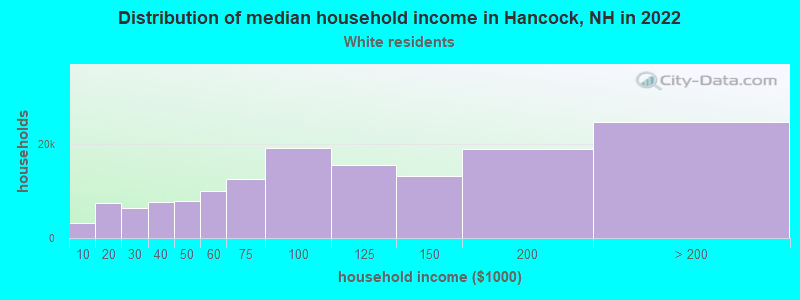
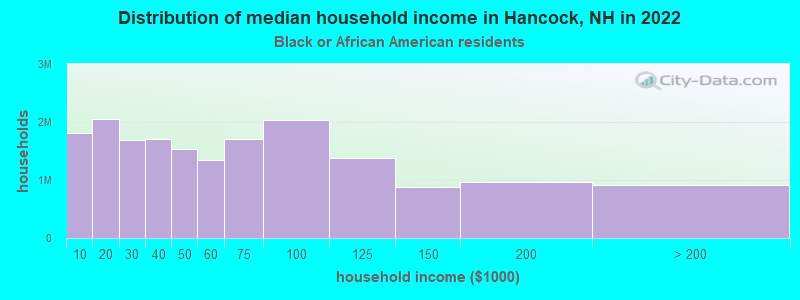
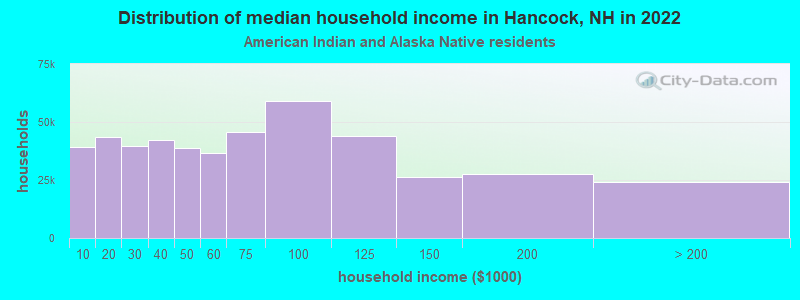
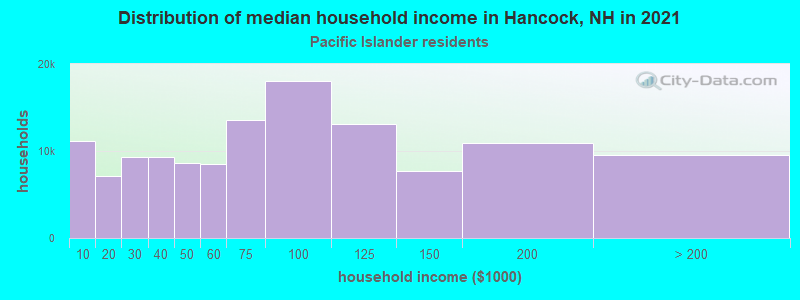
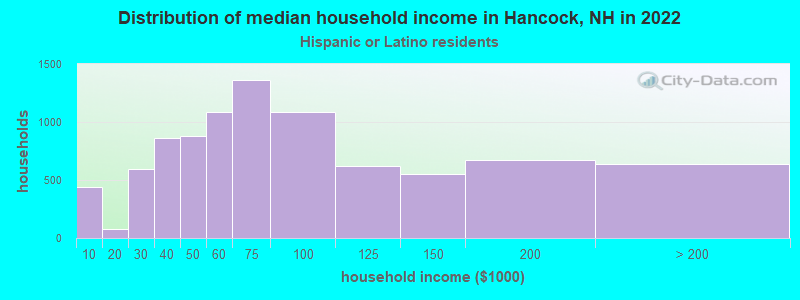
Income and house value in Hancock
- Median household income in 2022
- $101,105White non-Hispanic householders
- $50,729Black householders
- $37,341American Indian and Alaska Native householders
- $59,792Hispanic or Latino race householders
- Median 2022 house value
- $468,549White Non-Hispanic householders
- $195,479Black or African American householders
- $255,627Hispanic or Latino householders
Foreign-born residents in Hancock
23 residents are foreign born
| This city: | 1.3% |
| New Hampshire: | 4.4% |
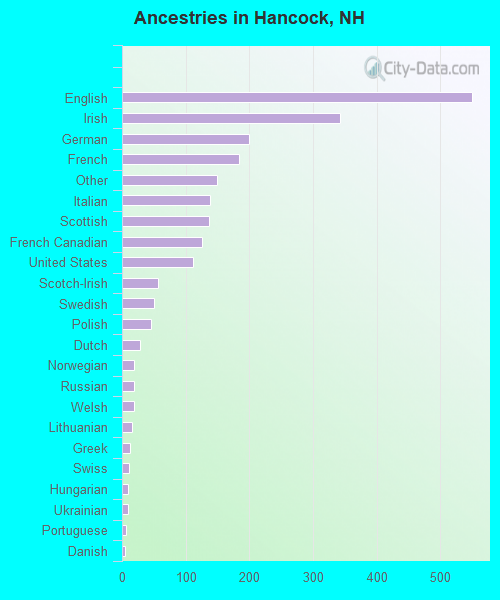
Ancestries in Hancock

- 54924.4%English
- 34215.2%Irish
- 1998.8%German
- 1848.2%French
- 1506.7%Other
- 1386.1%Italian
- 1376.1%Scottish
- 1265.6%French Canadian
- 1125.0%United States
- 562.5%Scotch-Irish
- 512.3%Swedish
- 462.0%Polish
- 281.2%Dutch
- 190.8%Norwegian
- 190.8%Russian
- 190.8%Welsh
- 160.7%Lithuanian
- 120.5%Greek
- 110.5%Swiss
- 90.4%Hungarian
- 90.4%Ukrainian
- 70.3%Portuguese
- 50.2%Danish
- 40.2%Czech
- 40.2%Slovak
- 20.09%Subsaharan African