Races in Hartford, Wisconsin (WI) Detailed Stats
Data:
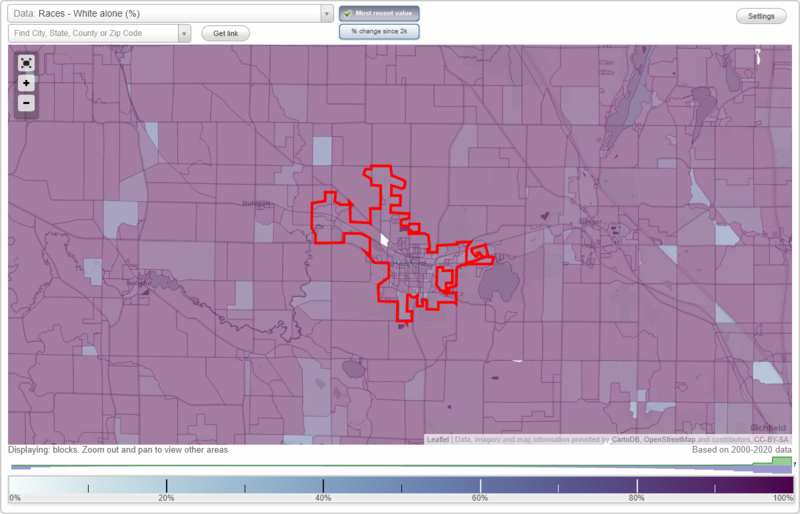
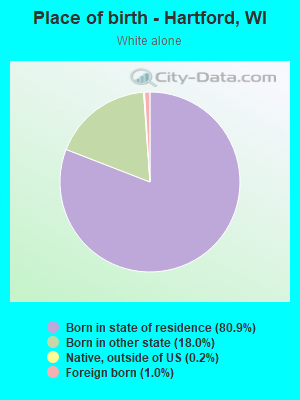
Races - White alone (%)
Races - White alone (% change since 2000)
Races - Black alone (%)
Races - Black alone (% change since 2000)
Races - American Indian alone (%)
Races - American Indian alone (% change since 2000)
Races - Asian alone (%)
Races - Asian alone (% change since 2000)
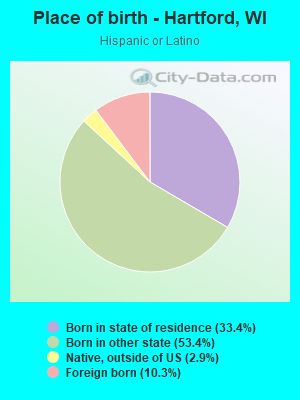
Races - Hispanic (%)
Races - Hispanic (% change since 2000)
Races - Native Hawaiian and Other Pacific Islander alone (%)
Races - Native Hawaiian and Other Pacific Islander alone (% change since 2000)
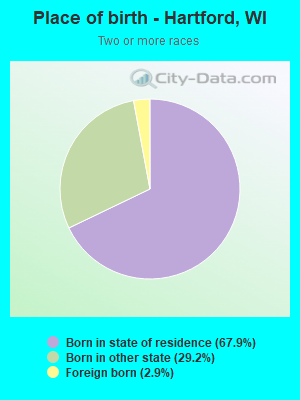
Races - Two or more races(%)
Races - Two or more races(% change since 2000)
Races - Other race alone (%)
Races - Other race alone (% change since 2000)
Racial diversity
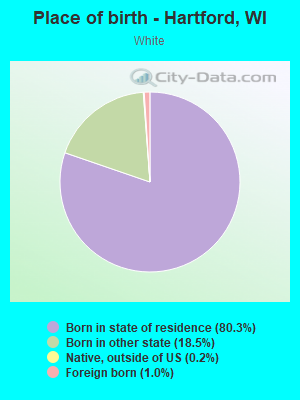
Place of birth - Born in state of residence (%)
Place of birth - Born in state of residence (%) - White
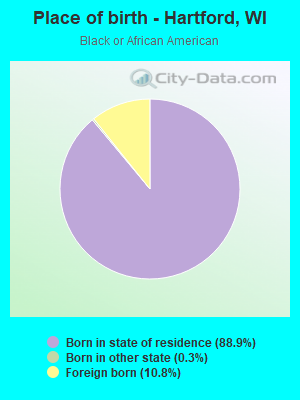
Place of birth - Born in state of residence (%) - Black or African American
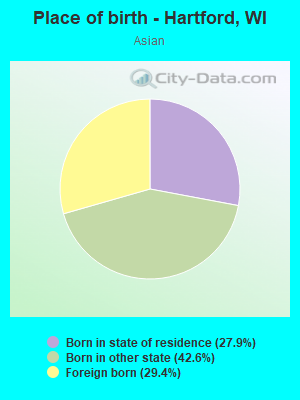
Place of birth - Born in state of residence (%) - Asian
Place of birth - Born in state of residence (%) - Hispanic or Latino
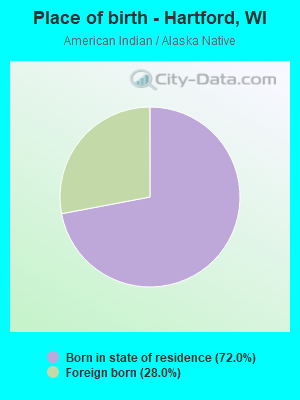
Place of birth - Born in state of residence (%) - American Indian and Alaska Native
Place of birth - Born in state of residence (%) - Multirace
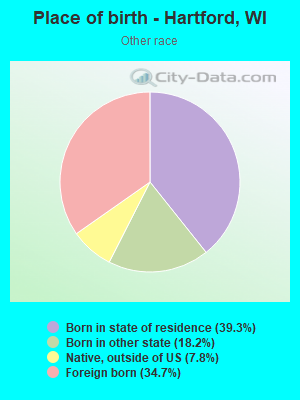
Place of birth - Born in state of residence (%) - Other Race
Place of birth - Born in other state (%)
Place of birth - Born in other state (%) - White
Place of birth - Born in other state (%) - Black or African American
Place of birth - Born in other state (%) - Asian
Place of birth - Born in other state (%) - Hispanic or Latino
Place of birth - Born in other state (%) - American Indian and Alaska Native
Place of birth - Born in other state (%) - Multirace
Place of birth - Born in other state (%) - Other Race
Place of birth - Native, outside of US (%)
Place of birth - Native, outside of US (%) - White
Place of birth - Native, outside of US (%) - Black or African American
Place of birth - Native, outside of US (%) - Asian
Place of birth - Native, outside of US (%) - Hispanic or Latino
Place of birth - Native, outside of US (%) - American Indian and Alaska Native
Place of birth - Native, outside of US (%) - Multirace
Place of birth - Native, outside of US (%) - Other Race
Place of birth - Foreign born (%)
Place of birth - Foreign born (%) - White
Place of birth - Foreign born (%) - Black or African American
Place of birth - Foreign born (%) - Asian
Place of birth - Foreign born (%) - Hispanic or Latino
Place of birth - Foreign born (%) - American Indian and Alaska Native
Place of birth - Foreign born (%) - Multirace
Place of birth - Foreign born (%) - Other Race
Residents speaking English at home (%)
Residents speaking English at home - Born in the United States (%)
Residents speaking English at home - Native, born elsewhere (%)
Residents speaking English at home - Foreign born (%)
Residents speaking Spanish at home (%)
Residents speaking Spanish at home - Born in the United States (%)
Residents speaking Spanish at home - Native, born elsewhere (%)
Residents speaking Spanish at home - Foreign born (%)
Residents speaking other language at home (%)
Residents speaking other language at home - Born in the United States (%)
Residents speaking other language at home - Native, born elsewhere (%)
Residents speaking other language at home - Foreign born (%)
Marital status - Never married (%)
Marital status - Now married (%)
Marital status - Separated (%)
Marital status - Widowed (%)
Marital status - Divorced (%)
Ancestries Reported - Arab (%)
Ancestries Reported - Czech (%)
Ancestries Reported - Danish (%)
Ancestries Reported - Dutch (%)
Ancestries Reported - English (%)
Ancestries Reported - French (%)
Ancestries Reported - French Canadian (%)
Ancestries Reported - German (%)
Ancestries Reported - Greek (%)
Ancestries Reported - Hungarian (%)
Ancestries Reported - Irish (%)
Ancestries Reported - Italian (%)
Ancestries Reported - Lithuanian (%)
Ancestries Reported - Norwegian (%)
Ancestries Reported - Polish (%)
Ancestries Reported - Portuguese (%)
Ancestries Reported - Russian (%)
Ancestries Reported - Scotch-Irish (%)
Ancestries Reported - Scottish (%)
Ancestries Reported - Slovak (%)
Ancestries Reported - Subsaharan African (%)
Ancestries Reported - Swedish (%)
Ancestries Reported - Swiss (%)
Ancestries Reported - Ukrainian (%)
Ancestries Reported - United States (%)
Ancestries Reported - Welsh (%)
Ancestries Reported - West Indian (%)
Ancestries Reported - Other (%)
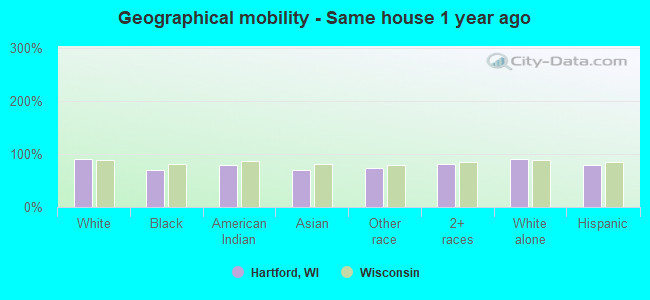
Geographical mobility - Same house 1 year ago (%)
Geographical mobility - Same house 1 year ago (%) - White
Geographical mobility - Same house 1 year ago (%) - Black or African American
Geographical mobility - Same house 1 year ago (%) - Asian
Geographical mobility - Same house 1 year ago (%) - Hispanic or Latino
Geographical mobility - Same house 1 year ago (%) - American Indian and Alaska Native
Geographical mobility - Same house 1 year ago (%) - Multirace
Geographical mobility - Same house 1 year ago (%) - Other Race
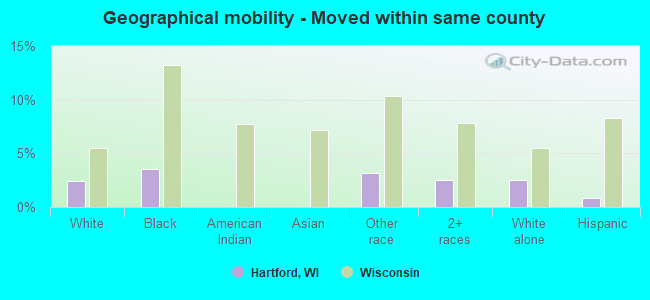
Geographical mobility - Moved within same county (%)
Geographical mobility - Moved within same county (%) - White
Geographical mobility - Moved within same county (%) - Black or African American
Geographical mobility - Moved within same county (%) - Asian
Geographical mobility - Moved within same county (%) - Hispanic or Latino
Geographical mobility - Moved within same county (%) - American Indian and Alaska Native
Geographical mobility - Moved within same county (%) - Multirace
Geographical mobility - Moved within same county (%) - Other Race
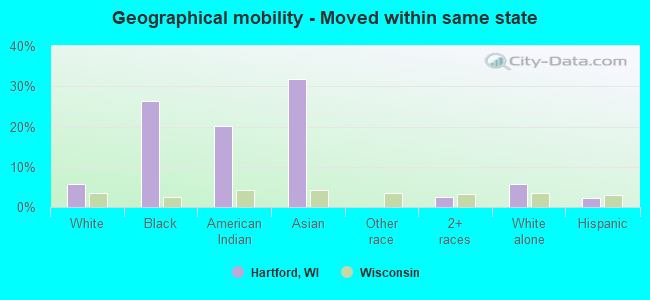
Geographical mobility - Moved from different county within same state (%)
Geographical mobility - Moved from different county within same state (%) - White
Geographical mobility - Moved from different county within same state (%) - Black or African American
Geographical mobility - Moved from different county within same state (%) - Asian
Geographical mobility - Moved from different county within same state (%) - Hispanic or Latino
Geographical mobility - Moved from different county within same state (%) - American Indian and Alaska Native
Geographical mobility - Moved from different county within same state (%) - Multirace
Geographical mobility - Moved from different county within same state (%) - Other Race
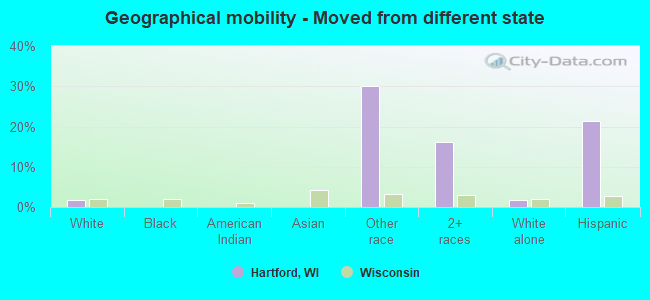
Geographical mobility - Moved from different state (%)
Geographical mobility - Moved from different state (%) - White
Geographical mobility - Moved from different state (%) - Black or African American
Geographical mobility - Moved from different state (%) - Asian
Geographical mobility - Moved from different state (%) - Hispanic or Latino
Geographical mobility - Moved from different state (%) - American Indian and Alaska Native
Geographical mobility - Moved from different state (%) - Multirace
Geographical mobility - Moved from different state (%) - Other Race
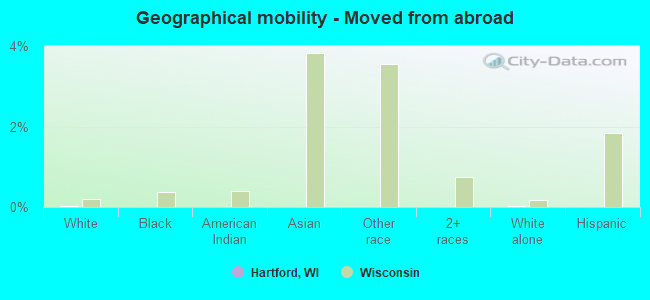
Geographical mobility - Moved from abroad (%)
Geographical mobility - Moved from abroad (%) - White
Geographical mobility - Moved from abroad (%) - Black or African American
Geographical mobility - Moved from abroad (%) - Asian
Geographical mobility - Moved from abroad (%) - Hispanic or Latino
Geographical mobility - Moved from abroad (%) - American Indian and Alaska Native
Geographical mobility - Moved from abroad (%) - Multirace
Geographical mobility - Moved from abroad (%) - Other Race
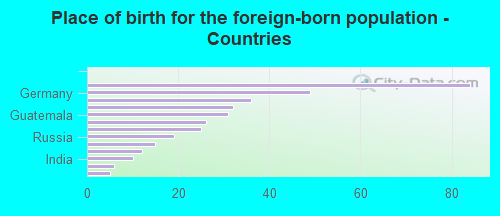
Place of birth for the foreign-born population - Ireland (%)
Place of birth for the foreign-born population - Denmark (%)
Place of birth for the foreign-born population - Norway (%)
Place of birth for the foreign-born population - Sweden (%)
Place of birth for the foreign-born population - United Kingdom (%)
Place of birth for the foreign-born population - England (%)
Place of birth for the foreign-born population - Scotland (%)
Place of birth for the foreign-born population - Other Northern Europe (%)
Place of birth for the foreign-born population - Austria (%)
Place of birth for the foreign-born population - Belgium (%)
Place of birth for the foreign-born population - France (%)
Place of birth for the foreign-born population - Germany (%)
Place of birth for the foreign-born population - Netherlands (%)
Place of birth for the foreign-born population - Switzerland (%)
Place of birth for the foreign-born population - Other Western Europe (%)
Place of birth for the foreign-born population - Greece (%)
Place of birth for the foreign-born population - Italy (%)
Place of birth for the foreign-born population - Portugal (%)
Place of birth for the foreign-born population - Spain (%)
Place of birth for the foreign-born population - Other Southern Europe (%)
Place of birth for the foreign-born population - Albania (%)
Place of birth for the foreign-born population - Belarus (%)
Place of birth for the foreign-born population - Bosnia and Herzegovina (%)
Place of birth for the foreign-born population - Bulgaria (%)
Place of birth for the foreign-born population - Croatia (%)
Place of birth for the foreign-born population - Czechoslovakia (%)
Place of birth for the foreign-born population - Hungary (%)
Place of birth for the foreign-born population - Latvia (%)
Place of birth for the foreign-born population - Lithuania (%)
Place of birth for the foreign-born population - North Macedonia (Macedonia) (%)
Place of birth for the foreign-born population - Moldova (%)
Place of birth for the foreign-born population - Poland (%)
Place of birth for the foreign-born population - Romania (%)
Place of birth for the foreign-born population - Russia (%)
Place of birth for the foreign-born population - Serbia (%)
Place of birth for the foreign-born population - Ukraine (%)
Place of birth for the foreign-born population - Other Eastern Europe (%)
Place of birth for the foreign-born population - China (%)
Place of birth for the foreign-born population - Hong Kong (%)
Place of birth for the foreign-born population - Taiwan (%)
Place of birth for the foreign-born population - Japan (%)
Place of birth for the foreign-born population - Korea (%)
Place of birth for the foreign-born population - Other Eastern Asia (%)
Place of birth for the foreign-born population - Afghanistan (%)
Place of birth for the foreign-born population - Bangladesh (%)
Place of birth for the foreign-born population - India (%)
Place of birth for the foreign-born population - Iran (%)
Place of birth for the foreign-born population - Kazakhstan (%)
Place of birth for the foreign-born population - Nepal (%)
Place of birth for the foreign-born population - Pakistan (%)
Place of birth for the foreign-born population - Sri Lanka (%)
Place of birth for the foreign-born population - Uzbekistan (%)
Place of birth for the foreign-born population - Other South Central Asia (%)
Place of birth for the foreign-born population - Burma (%)
Place of birth for the foreign-born population - Cambodia (%)
Place of birth for the foreign-born population - Indonesia (%)
Place of birth for the foreign-born population - Laos (%)
Place of birth for the foreign-born population - Malaysia (%)
Place of birth for the foreign-born population - Philippines (%)
Place of birth for the foreign-born population - Singapore (%)
Place of birth for the foreign-born population - Thailand (%)
Place of birth for the foreign-born population - Vietnam (%)
Place of birth for the foreign-born population - Other South Eastern Asia (%)
Place of birth for the foreign-born population - Armenia (%)
Place of birth for the foreign-born population - Iraq (%)
Place of birth for the foreign-born population - Israel (%)
Place of birth for the foreign-born population - Jordan (%)
Place of birth for the foreign-born population - Kuwait (%)
Place of birth for the foreign-born population - Lebanon (%)
Place of birth for the foreign-born population - Saudi Arabia (%)
Place of birth for the foreign-born population - Syria (%)
Place of birth for the foreign-born population - Turkey (%)
Place of birth for the foreign-born population - Yemen (%)
Place of birth for the foreign-born population - Other Western Asia (%)
Place of birth for the foreign-born population - Eritrea (%)
Place of birth for the foreign-born population - Ethiopia (%)
Place of birth for the foreign-born population - Kenya (%)
Place of birth for the foreign-born population - Somalia (%)
Place of birth for the foreign-born population - Uganda (%)
Place of birth for the foreign-born population - Zimbabwe (%)
Place of birth for the foreign-born population - Other Eastern Africa (%)
Place of birth for the foreign-born population - Cameroon (%)
Place of birth for the foreign-born population - Congo (%)
Place of birth for the foreign-born population - Democratic Republic of Congo (Zaire) (%)
Place of birth for the foreign-born population - Other Middle Africa (%)
Place of birth for the foreign-born population - Egypt (%)
Place of birth for the foreign-born population - Morocco (%)
Place of birth for the foreign-born population - Sudan (%)
Place of birth for the foreign-born population - Other Northern Africa (%)
Place of birth for the foreign-born population - South Africa (%)
Place of birth for the foreign-born population - Other Southern Africa (%)
Place of birth for the foreign-born population - Cabo Verde (%)
Place of birth for the foreign-born population - Ghana (%)
Place of birth for the foreign-born population - Liberia (%)
Place of birth for the foreign-born population - Nigeria (%)
Place of birth for the foreign-born population - Senegal (%)
Place of birth for the foreign-born population - Sierra Leone (%)
Place of birth for the foreign-born population - Other Western Africa (%)
Place of birth for the foreign-born population - Australia (%)
Place of birth for the foreign-born population - New Zealand (%)
Place of birth for the foreign-born population - Fiji (%)
Place of birth for the foreign-born population - Micronesia (%)
Place of birth for the foreign-born population - Bahamas (%)
Place of birth for the foreign-born population - Barbados (%)
Place of birth for the foreign-born population - Cuba (%)
Place of birth for the foreign-born population - Dominica (%)
Place of birth for the foreign-born population - Dominican Republic (%)
Place of birth for the foreign-born population - Grenada (%)
Place of birth for the foreign-born population - Haiti (%)
Place of birth for the foreign-born population - Jamaica (%)
Place of birth for the foreign-born population - St. Vincent and the Grenadines (%)
Place of birth for the foreign-born population - Trinidad and Tobago (%)
Place of birth for the foreign-born population - West Indies (%)
Place of birth for the foreign-born population - Other Caribbean (%)
Place of birth for the foreign-born population - Belize (%)
Place of birth for the foreign-born population - Costa Rica (%)
Place of birth for the foreign-born population - El Salvador (%)
Place of birth for the foreign-born population - Guatemala (%)
Place of birth for the foreign-born population - Honduras (%)
Place of birth for the foreign-born population - Mexico (%)
Place of birth for the foreign-born population - Nicaragua (%)
Place of birth for the foreign-born population - Panama (%)
Place of birth for the foreign-born population - Other Central America (%)
Place of birth for the foreign-born population - Argentina (%)
Place of birth for the foreign-born population - Bolivia (%)
Place of birth for the foreign-born population - Brazil (%)
Place of birth for the foreign-born population - Chile (%)
Place of birth for the foreign-born population - Colombia (%)
Place of birth for the foreign-born population - Ecuador (%)
Place of birth for the foreign-born population - Guyana (%)
Place of birth for the foreign-born population - Peru (%)
Place of birth for the foreign-born population - Uruguay (%)
Place of birth for the foreign-born population - Venezuela (%)
Place of birth for the foreign-born population - Other South America (%)
Place of birth for the foreign-born population - Canada (%)
Place of birth for the foreign-born population - Other Northern America (%)
Place of birth for the foreign-born population - Other (%)
Latest news about races in Hartford, WI collected exclusively by city-data.com from local newspapers, TV, and radio stations
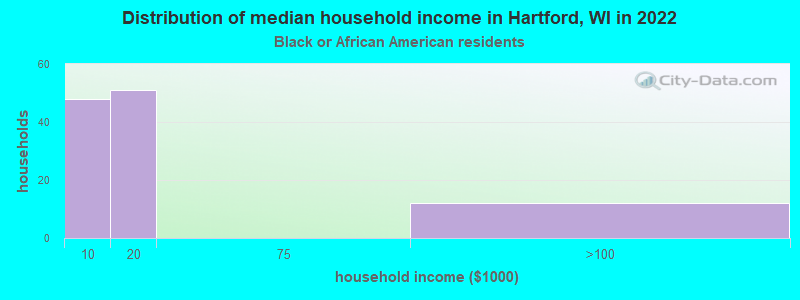
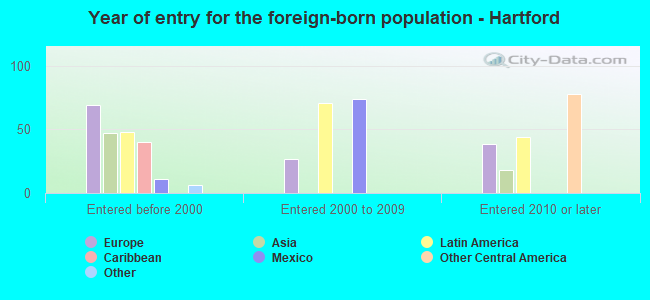
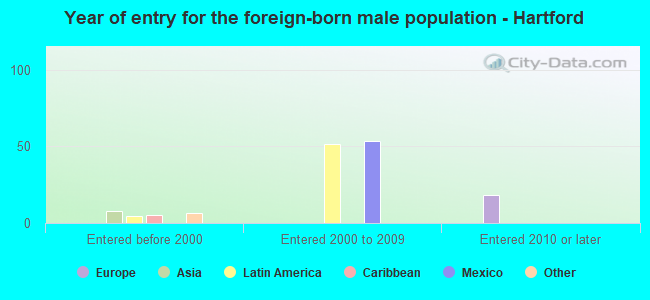
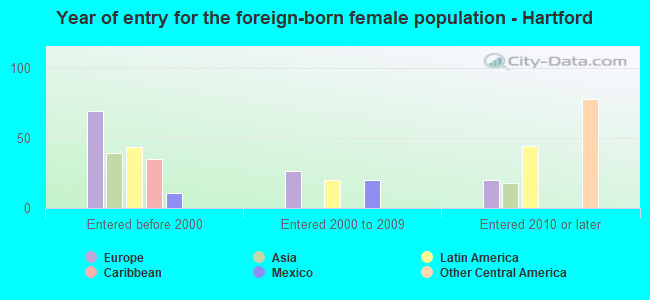
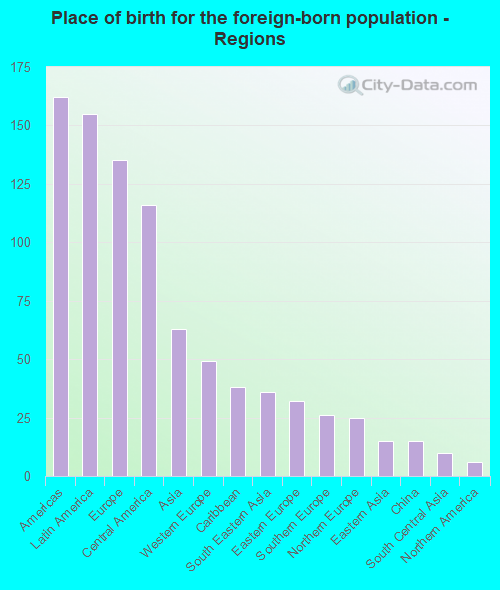
According to 2022 data, the most numerous races in Hartford, WI are White alone (13,793 residents), Hispanic (794 residents), and Black alone (208 residents). 95.7% of Hartford residents speak English at home. 2.3% of Hartford, WI residents are foreign-born (1.0% born in Latin America, 0.9% born in Europe, 0.4% born in Asia), which is 117.7% less than the foreign-born rate of 5.0% across the entire state of Wisconsin.
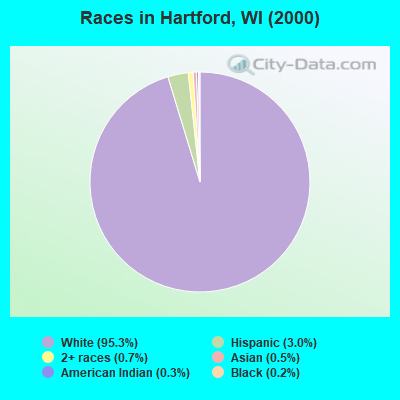
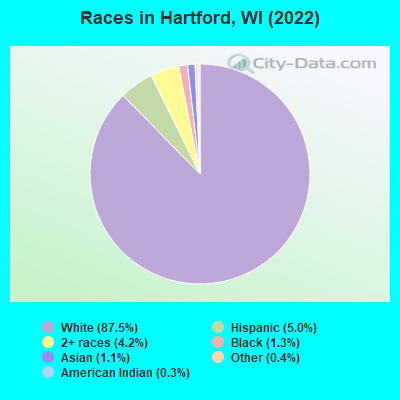
Race distribution in Hartford
2000 2022
4,681,630 87.3% White alone 300,245 5.6% Black alone 192,921 3.6% Hispanic 87,995 1.6% Asian alone 51,921 1.0% Two or more races 43,980 0.8% American Indian alone 3,637 0.07% Other race alone 1,346 0.03% Native Hawaiian and Other
4,654,031 79.0% White alone 447,022 7.6% Hispanic 345,678 5.9% Black alone 217,532 3.7% Two or more races 172,242 2.9% Asian alone 33,762 0.6% American Indian alone 19,680 0.3% Other race alone 2,592 0.04% Native Hawaiian and Other
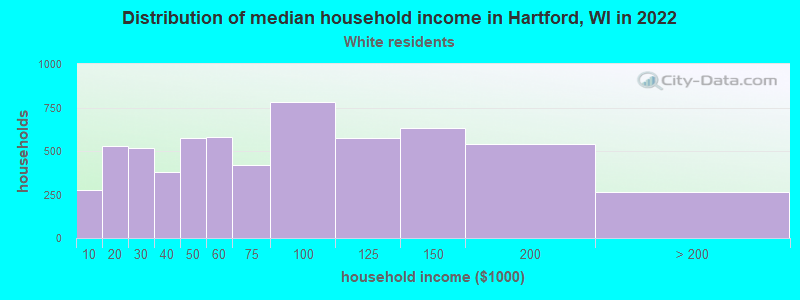
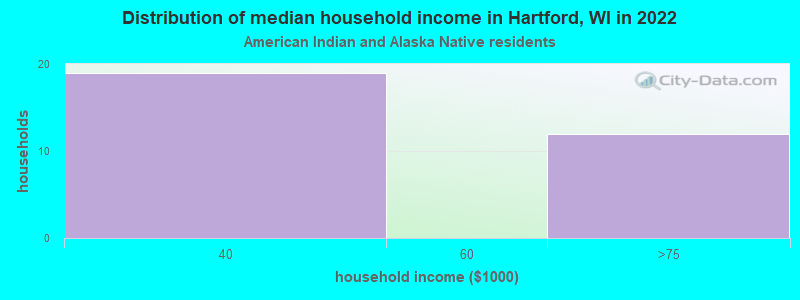
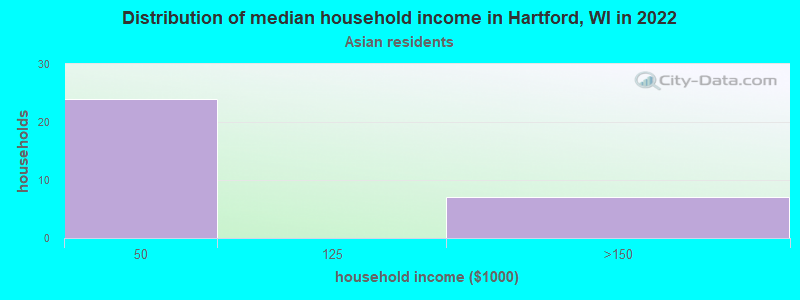
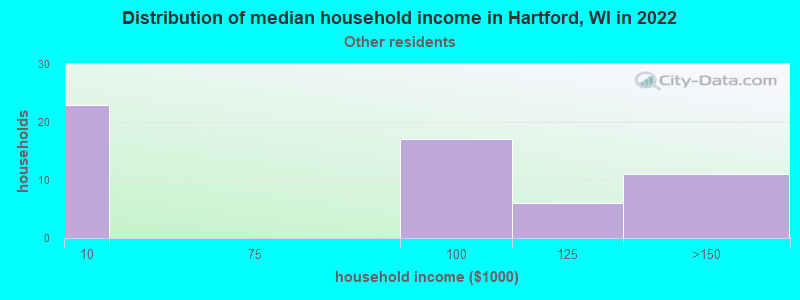
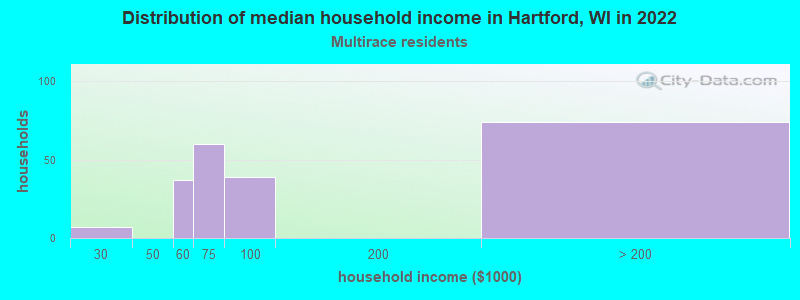
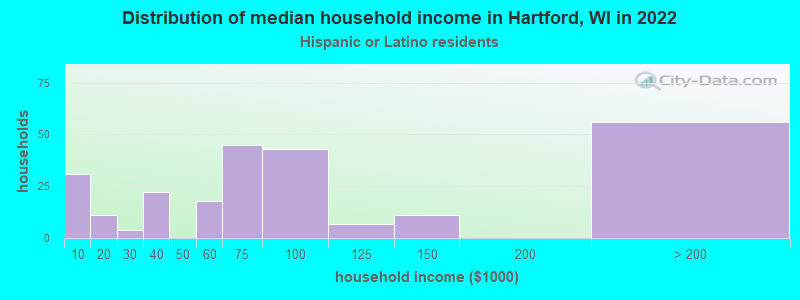
Income and house value in Hartford Median household income in 2022 $69,512 White non-Hispanic householders$12,976 Black householders$89,187 Hispanic or Latino race householdersMedian 2022 house value $263,652 White Non-Hispanic householders$279,292 American Indian or Alaska Native householders$330,073 Some other race householders$228,512 Two or more races householders$330,073 Hispanic or Latino householders
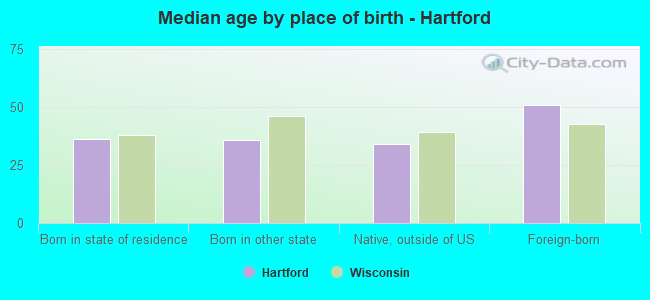
Median age by race in Hartford
39.9 Median age for White residents39.0 40.3 37.3 Median age for Black or African American residents13.7 30.7 20.1 Median age for American Indian / Alaska Native residents4.7 45.0 44.3 Median age for Asian residents-1,106,508,874.6 40.2 -825,688,072.6 Median age for Native Hawaiian / Pacific Islander residents-862,745,097.2 -666,666,666.0 25.9 Median age for Other race residents44.1 18.4 18.3 Median age for Two or more races residents16.1 37.0 40.1 Median age for White alone residents39.1 40.4 27.8 Median age for Hispanic or Latino residents21.7 37.5
Owner/renter occupied households by race in Hartford
House owners and renters - White residents 4,002 67.6% Owner occupied1,914 32.4% Renter occupiedHouse owners and renters - Black or African American residents 13 11.2% Owner occupied104 88.8% Renter occupiedHouse owners and renters - American Indian / Alaska Native residents 12 45.2% Owner occupied15 54.8% Renter occupiedHouse owners and renters - Asian residents 9 39.0% Owner occupied14 61.0% Renter occupiedHouse owners and renters - Other race residents 26 45.5% Owner occupied31 54.5% Renter occupiedHouse owners and renters - Two or more races residents 116 40.7% Owner occupied169 59.3% Renter occupiedHouse owners and renters - White alone residents 3,938 67.4% Owner occupied1,907 32.6% Renter occupiedHouse owners and renters - Hispanic or Latino residents 205 74.6% Owner occupied70 25.4% Renter occupied
Language usage in Hartford
English speakers - Total 95.7% of residents of Hartford speak English at home.
2.9% of residents speak Spanish at home 311 72.0% Speak English very well121 28.0% Speak English less than very well1.3% of residents speak other language at home 135 72.2% Speak English very well52 27.8% Speak English less than very well
English speakers - Born in the United States 96.5% of residents of Hartford speak English at home.
2.4% of residents speak Spanish at home 49 74.2% Speak English very well17 25.8% Speak English less than very well0.9% of residents speak other language at home 24 100.0% Speak English very well
English speakers - Native, born elsewhere 67.9% of residents of Hartford speak English at home.
35.7% of residents speak Spanish at home 20 100.0% Speak English very well
English speakers - Foreign-born 35.1% of residents of Hartford speak English at home.
35.1% of residents speak Spanish at home 56 44.1% Speak English very well71 55.9% Speak English less than very well26.5% of residents speak other language at home 43 44.8% Speak English very well53 55.2% Speak English less than very well
White (Caucasian) - Speak only English Native:
98.2% (12,967)Foreign-born:
35.9% (52)
White (Caucasian) - Speak another language Native:
1.8% (235)Foreign-born:
63.6% (92)
American Indian / Alaska Native - Speak another language Native:
42.2% (25)Foreign-born:
100.0% (24)
Asian - Speak only English Native:
82.6% (82)Foreign-born:
38.7% (21)
Other race - Speak only English Native:
82.3% (112)Foreign-born:
46.3% (32)
Other race - Speak another language Native:
27.6% (38)Foreign-born:
58.3% (40)
Two or more races - Speak only English Native:
83.2% (748)Foreign-born:
40.7% (44)
Two or more races - Speak another language Native:
13.4% (120)Foreign-born:
46.6% (50)
White alone - Speak only English Native:
98.3% (12,744)Foreign-born:
39.4% (52)
White alone - Speak another language Native:
1.7% (226)Foreign-born:
58.6% (78)
Hispanic or Latino - Speak only English Native:
69.0% (366)Foreign-born:
29.1% (58)
Hispanic or Latino - Speak another language Native:
31.9% (169)Foreign-born:
67.5% (135)
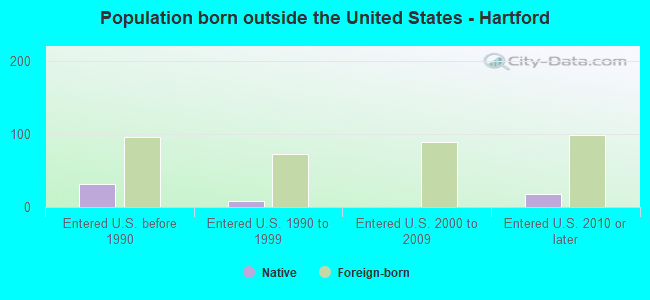
Foreign-born residents in Hartford 362 residents are foreign born (1.0% Latin America , 0.9% Europe , 0.4% Asia ).
This city:
2.3%Wisconsin:
5.0%
Marital status for residents in Hartford Marital status - White (Caucasian) population 15 years and over
Males 35.1% Never married54.6% Now married0.1% Separated3.7% Widowed6.5% DivorcedFemales 25.8% Never married50.8% Now married0.0% Separated10.6% Widowed12.8% DivorcedWomen who gave birth in the past 12 months Now married:
69.6% (131)Unmarried:
30.4% (57)
Women who did not give birth in the past 12 months Now married:
50.9% (1,534)Unmarried:
49.1% (1,478)
Marital status - Black or African American population 15 years and over
Males 0.0% Never married79.6% Now married0.0% Separated0.0% Widowed20.4% DivorcedFemales 92.0% Never married0.0% Now married0.0% Separated8.0% Widowed0.0% DivorcedWomen who did not give birth in the past 12 months Now married:
0.0% (0)Unmarried:
100.0% (99)
Marital status - American Indian / Alaska Native population 15 years and over
Males 25.0% Never married75.0% Now married0.0% Separated0.0% Widowed0.0% DivorcedFemales 78.4% Never married0.0% Now married0.0% Separated21.6% Widowed0.0% DivorcedWomen who did not give birth in the past 12 months Now married:
0.0% (0)Unmarried:
100.0% (31)
Marital status - Asian population 15 years and over
Males 0.0% Never married100.0% Now married0.0% Separated0.0% Widowed0.0% DivorcedFemales 31.2% Never married68.8% Now married0.0% Separated0.0% Widowed0.0% DivorcedWomen who did not give birth in the past 12 months Now married:
68.1% (91)Unmarried:
31.9% (42)
Marital status - Other race population 15 years and over
Males 38.9% Never married45.1% Now married0.0% Separated15.9% Widowed0.0% DivorcedFemales 83.3% Never married16.7% Now married0.0% Separated0.0% Widowed0.0% DivorcedWomen who did not give birth in the past 12 months Now married:
0.0% (0)Unmarried:
100.0% (86)
Marital status - Two or more races population 15 years and over
Males 74.2% Never married13.7% Now married9.7% Separated2.4% Widowed0.0% DivorcedFemales 46.8% Never married35.0% Now married16.3% Separated2.0% Widowed0.0% DivorcedWomen who did not give birth in the past 12 months Now married:
52.3% (155)Unmarried:
47.7% (142)
Marital status - White alone, not Hispanic / Latino population 15 years and over
Males 35.3% Never married54.5% Now married0.1% Separated3.7% Widowed6.4% DivorcedFemales 25.9% Never married50.4% Now married0.0% Separated10.7% Widowed13.0% DivorcedWomen who gave birth in the past 12 months Now married:
71.8% (130)Unmarried:
28.2% (51)
Women who did not give birth in the past 12 months Now married:
49.9% (1,463)Unmarried:
50.1% (1,467)
Marital status - Hispanic or Latino population 15 years and over
Males 39.2% Never married54.0% Now married0.0% Separated0.0% Widowed6.8% DivorcedFemales 46.7% Never married42.3% Now married9.8% Separated1.2% Widowed0.0% DivorcedWomen who gave birth in the past 12 months Now married:
0.0% (0)Unmarried:
100.0% (6)
Women who did not give birth in the past 12 months Now married:
54.0% (164)Unmarried:
46.0% (140)
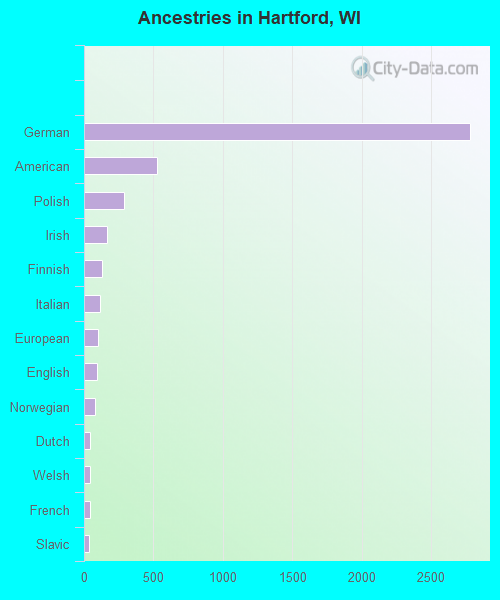
Ancestries in Hartford
2,779 50.6% German523 9.5% American290 5.3% Polish166 3.0% Irish127 2.3% Finnish114 2.1% Italian103 1.9% European94 1.7% English81 1.5% Norwegian41 0.7% Dutch41 0.7% Welsh40 0.7% French35 0.6% Slavic23 0.4% Scottish17 0.3% French Canadian16 0.3% Swiss13 0.2% Croatian12 0.2% Swedish9 0.2% Austrian9 0.2% Eastern European8 0.1% Belgian7 0.1% Czech7 0.1% Danish6 0.1% Greek6 0.1% Scandinavian6 0.1% Scotch-Irish5 0.09% Portuguese
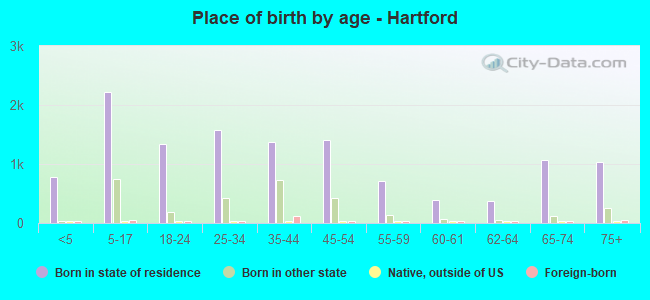
Children Nativity (place of birth) in Hartford
Children under 6 years - Living with two parents Both parents native 632 100.0% NativeBoth parents foreign-born 9 100.0% NativeOne native, one foreign-born parent 48 100.0% NativeChildren under 6 years - Living with one parent Native parent 195 100.0% Native
Children 6 to 17 years - Living with two parents Both parents native 2,054 98.3% Native35 1.7% Foreign-bornBoth parents foreign-born 10 100.0% NativeOne native, one foreign-born parent 78 100.0% NativeChildren 6 to 17 years - Living with one parent Native parent 645 100.0% Native
Grandparents responsible for own grandchildren in Hartford
Grandparents (30 to 59 years) White / Caucasian 8 39.8% Responsible for grandchildren13 60.2% Not responsible for grandchildrenWhite alone, not Hispanic / Latino 9 39.8% Responsible for grandchildren13 60.2% Not responsible for grandchildrenGrandparents (60 years and over) White / Caucasian 18 40.4% Responsible for grandchildren27 59.6% Not responsible for grandchildrenWhite alone, not Hispanic / Latino 18 39.7% Responsible for grandchildren28 60.3% Not responsible for grandchildren