Races in Harwood Heights, Illinois (IL) Detailed Stats
Data:
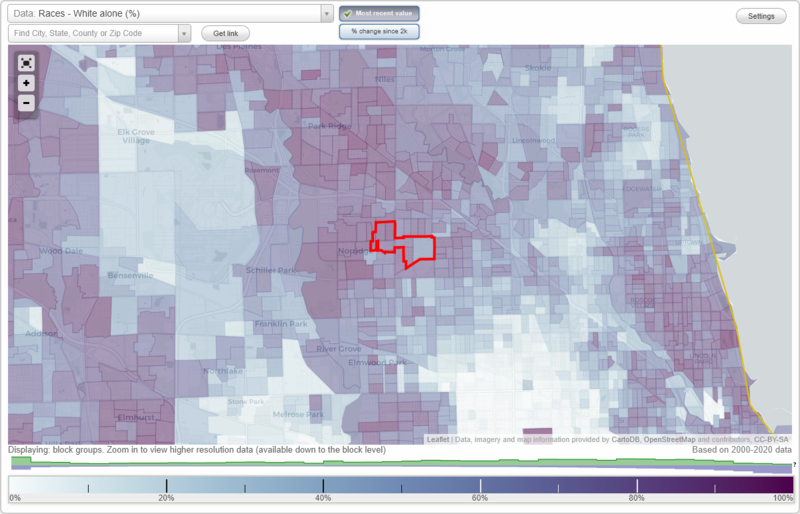
Races - White alone (%)
Races - White alone (% change since 2000)
Races - Black alone (%)
Races - Black alone (% change since 2000)
Races - American Indian alone (%)
Races - American Indian alone (% change since 2000)
Races - Asian alone (%)
Races - Asian alone (% change since 2000)
Races - Hispanic (%)
Races - Hispanic (% change since 2000)
Races - Native Hawaiian and Other Pacific Islander alone (%)
Races - Native Hawaiian and Other Pacific Islander alone (% change since 2000)
Races - Two or more races(%)
Races - Two or more races(% change since 2000)
Races - Other race alone (%)
Races - Other race alone (% change since 2000)
Racial diversity
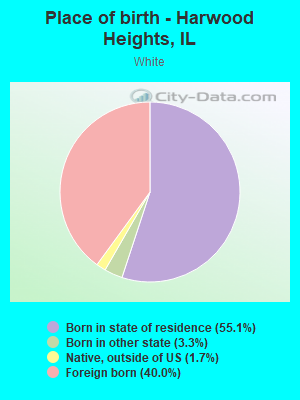
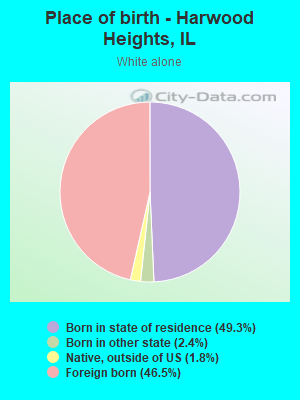
Place of birth - Born in state of residence (%)
Place of birth - Born in state of residence (%) - White
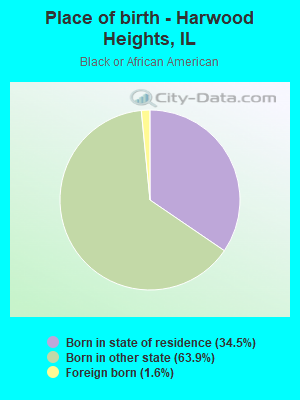
Place of birth - Born in state of residence (%) - Black or African American
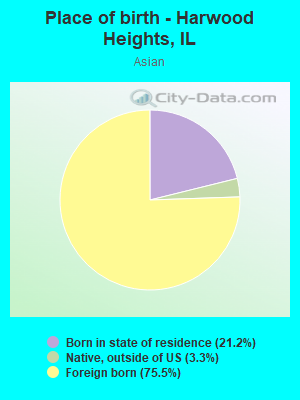
Place of birth - Born in state of residence (%) - Asian
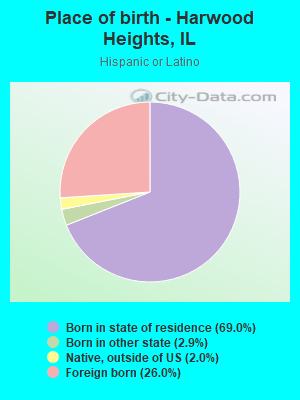
Place of birth - Born in state of residence (%) - Hispanic or Latino
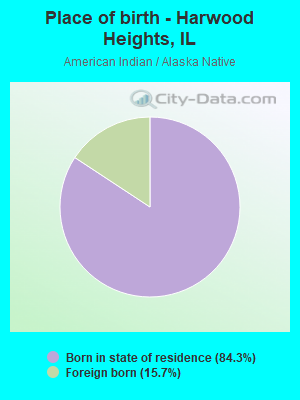
Place of birth - Born in state of residence (%) - American Indian and Alaska Native
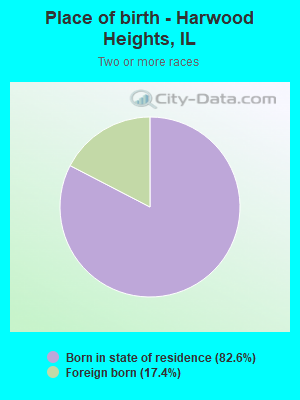
Place of birth - Born in state of residence (%) - Multirace
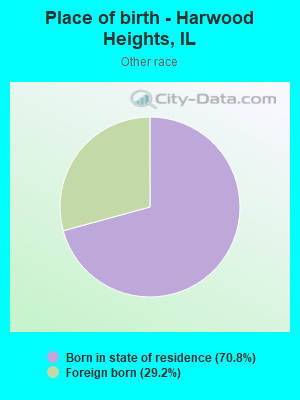
Place of birth - Born in state of residence (%) - Other Race
Place of birth - Born in other state (%)
Place of birth - Born in other state (%) - White
Place of birth - Born in other state (%) - Black or African American
Place of birth - Born in other state (%) - Asian
Place of birth - Born in other state (%) - Hispanic or Latino
Place of birth - Born in other state (%) - American Indian and Alaska Native
Place of birth - Born in other state (%) - Multirace
Place of birth - Born in other state (%) - Other Race
Place of birth - Native, outside of US (%)
Place of birth - Native, outside of US (%) - White
Place of birth - Native, outside of US (%) - Black or African American
Place of birth - Native, outside of US (%) - Asian
Place of birth - Native, outside of US (%) - Hispanic or Latino
Place of birth - Native, outside of US (%) - American Indian and Alaska Native
Place of birth - Native, outside of US (%) - Multirace
Place of birth - Native, outside of US (%) - Other Race
Place of birth - Foreign born (%)
Place of birth - Foreign born (%) - White
Place of birth - Foreign born (%) - Black or African American
Place of birth - Foreign born (%) - Asian
Place of birth - Foreign born (%) - Hispanic or Latino
Place of birth - Foreign born (%) - American Indian and Alaska Native
Place of birth - Foreign born (%) - Multirace
Place of birth - Foreign born (%) - Other Race
Residents speaking English at home (%)
Residents speaking English at home - Born in the United States (%)
Residents speaking English at home - Native, born elsewhere (%)
Residents speaking English at home - Foreign born (%)
Residents speaking Spanish at home (%)
Residents speaking Spanish at home - Born in the United States (%)
Residents speaking Spanish at home - Native, born elsewhere (%)
Residents speaking Spanish at home - Foreign born (%)
Residents speaking other language at home (%)
Residents speaking other language at home - Born in the United States (%)
Residents speaking other language at home - Native, born elsewhere (%)
Residents speaking other language at home - Foreign born (%)
Marital status - Never married (%)
Marital status - Now married (%)
Marital status - Separated (%)
Marital status - Widowed (%)
Marital status - Divorced (%)
Ancestries Reported - Arab (%)
Ancestries Reported - Czech (%)
Ancestries Reported - Danish (%)
Ancestries Reported - Dutch (%)
Ancestries Reported - English (%)
Ancestries Reported - French (%)
Ancestries Reported - French Canadian (%)
Ancestries Reported - German (%)
Ancestries Reported - Greek (%)
Ancestries Reported - Hungarian (%)
Ancestries Reported - Irish (%)
Ancestries Reported - Italian (%)
Ancestries Reported - Lithuanian (%)
Ancestries Reported - Norwegian (%)
Ancestries Reported - Polish (%)
Ancestries Reported - Portuguese (%)
Ancestries Reported - Russian (%)
Ancestries Reported - Scotch-Irish (%)
Ancestries Reported - Scottish (%)
Ancestries Reported - Slovak (%)
Ancestries Reported - Subsaharan African (%)
Ancestries Reported - Swedish (%)
Ancestries Reported - Swiss (%)
Ancestries Reported - Ukrainian (%)
Ancestries Reported - United States (%)
Ancestries Reported - Welsh (%)
Ancestries Reported - West Indian (%)
Ancestries Reported - Other (%)
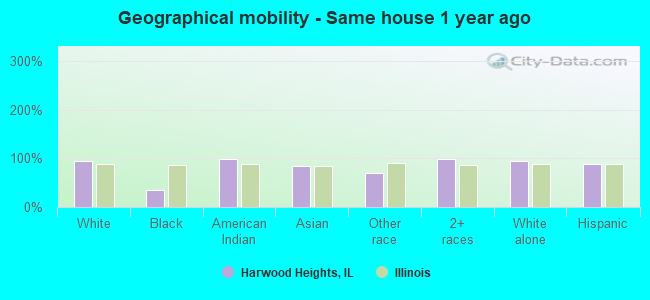
Geographical mobility - Same house 1 year ago (%)
Geographical mobility - Same house 1 year ago (%) - White
Geographical mobility - Same house 1 year ago (%) - Black or African American
Geographical mobility - Same house 1 year ago (%) - Asian
Geographical mobility - Same house 1 year ago (%) - Hispanic or Latino
Geographical mobility - Same house 1 year ago (%) - American Indian and Alaska Native
Geographical mobility - Same house 1 year ago (%) - Multirace
Geographical mobility - Same house 1 year ago (%) - Other Race
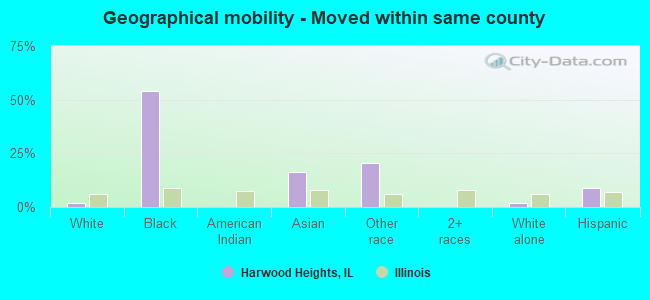
Geographical mobility - Moved within same county (%)
Geographical mobility - Moved within same county (%) - White
Geographical mobility - Moved within same county (%) - Black or African American
Geographical mobility - Moved within same county (%) - Asian
Geographical mobility - Moved within same county (%) - Hispanic or Latino
Geographical mobility - Moved within same county (%) - American Indian and Alaska Native
Geographical mobility - Moved within same county (%) - Multirace
Geographical mobility - Moved within same county (%) - Other Race
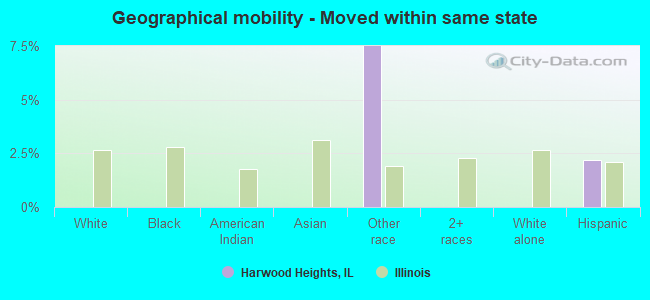
Geographical mobility - Moved from different county within same state (%)
Geographical mobility - Moved from different county within same state (%) - White
Geographical mobility - Moved from different county within same state (%) - Black or African American
Geographical mobility - Moved from different county within same state (%) - Asian
Geographical mobility - Moved from different county within same state (%) - Hispanic or Latino
Geographical mobility - Moved from different county within same state (%) - American Indian and Alaska Native
Geographical mobility - Moved from different county within same state (%) - Multirace
Geographical mobility - Moved from different county within same state (%) - Other Race
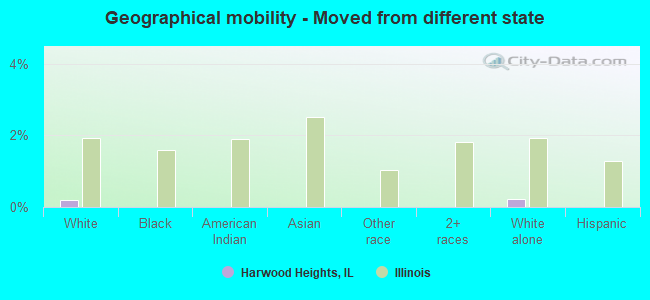
Geographical mobility - Moved from different state (%)
Geographical mobility - Moved from different state (%) - White
Geographical mobility - Moved from different state (%) - Black or African American
Geographical mobility - Moved from different state (%) - Asian
Geographical mobility - Moved from different state (%) - Hispanic or Latino
Geographical mobility - Moved from different state (%) - American Indian and Alaska Native
Geographical mobility - Moved from different state (%) - Multirace
Geographical mobility - Moved from different state (%) - Other Race
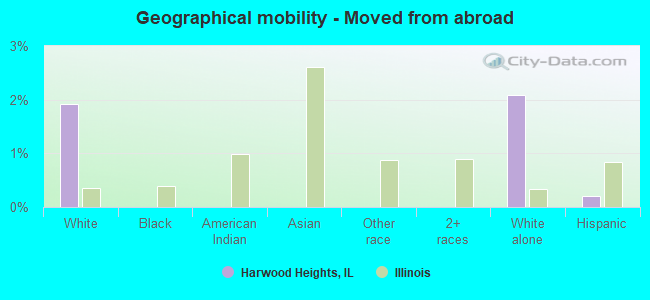
Geographical mobility - Moved from abroad (%)
Geographical mobility - Moved from abroad (%) - White
Geographical mobility - Moved from abroad (%) - Black or African American
Geographical mobility - Moved from abroad (%) - Asian
Geographical mobility - Moved from abroad (%) - Hispanic or Latino
Geographical mobility - Moved from abroad (%) - American Indian and Alaska Native
Geographical mobility - Moved from abroad (%) - Multirace
Geographical mobility - Moved from abroad (%) - Other Race
Place of birth for the foreign-born population - Ireland (%)
Place of birth for the foreign-born population - Denmark (%)
Place of birth for the foreign-born population - Norway (%)
Place of birth for the foreign-born population - Sweden (%)
Place of birth for the foreign-born population - United Kingdom (%)
Place of birth for the foreign-born population - England (%)
Place of birth for the foreign-born population - Scotland (%)
Place of birth for the foreign-born population - Other Northern Europe (%)
Place of birth for the foreign-born population - Austria (%)
Place of birth for the foreign-born population - Belgium (%)
Place of birth for the foreign-born population - France (%)
Place of birth for the foreign-born population - Germany (%)
Place of birth for the foreign-born population - Netherlands (%)
Place of birth for the foreign-born population - Switzerland (%)
Place of birth for the foreign-born population - Other Western Europe (%)
Place of birth for the foreign-born population - Greece (%)
Place of birth for the foreign-born population - Italy (%)
Place of birth for the foreign-born population - Portugal (%)
Place of birth for the foreign-born population - Spain (%)
Place of birth for the foreign-born population - Other Southern Europe (%)
Place of birth for the foreign-born population - Albania (%)
Place of birth for the foreign-born population - Belarus (%)
Place of birth for the foreign-born population - Bosnia and Herzegovina (%)
Place of birth for the foreign-born population - Bulgaria (%)
Place of birth for the foreign-born population - Croatia (%)
Place of birth for the foreign-born population - Czechoslovakia (%)
Place of birth for the foreign-born population - Hungary (%)
Place of birth for the foreign-born population - Latvia (%)
Place of birth for the foreign-born population - Lithuania (%)
Place of birth for the foreign-born population - North Macedonia (Macedonia) (%)
Place of birth for the foreign-born population - Moldova (%)
Place of birth for the foreign-born population - Poland (%)
Place of birth for the foreign-born population - Romania (%)
Place of birth for the foreign-born population - Russia (%)
Place of birth for the foreign-born population - Serbia (%)
Place of birth for the foreign-born population - Ukraine (%)
Place of birth for the foreign-born population - Other Eastern Europe (%)
Place of birth for the foreign-born population - China (%)
Place of birth for the foreign-born population - Hong Kong (%)
Place of birth for the foreign-born population - Taiwan (%)
Place of birth for the foreign-born population - Japan (%)
Place of birth for the foreign-born population - Korea (%)
Place of birth for the foreign-born population - Other Eastern Asia (%)
Place of birth for the foreign-born population - Afghanistan (%)
Place of birth for the foreign-born population - Bangladesh (%)
Place of birth for the foreign-born population - India (%)
Place of birth for the foreign-born population - Iran (%)
Place of birth for the foreign-born population - Kazakhstan (%)
Place of birth for the foreign-born population - Nepal (%)
Place of birth for the foreign-born population - Pakistan (%)
Place of birth for the foreign-born population - Sri Lanka (%)
Place of birth for the foreign-born population - Uzbekistan (%)
Place of birth for the foreign-born population - Other South Central Asia (%)
Place of birth for the foreign-born population - Burma (%)
Place of birth for the foreign-born population - Cambodia (%)
Place of birth for the foreign-born population - Indonesia (%)
Place of birth for the foreign-born population - Laos (%)
Place of birth for the foreign-born population - Malaysia (%)
Place of birth for the foreign-born population - Philippines (%)
Place of birth for the foreign-born population - Singapore (%)
Place of birth for the foreign-born population - Thailand (%)
Place of birth for the foreign-born population - Vietnam (%)
Place of birth for the foreign-born population - Other South Eastern Asia (%)
Place of birth for the foreign-born population - Armenia (%)
Place of birth for the foreign-born population - Iraq (%)
Place of birth for the foreign-born population - Israel (%)
Place of birth for the foreign-born population - Jordan (%)
Place of birth for the foreign-born population - Kuwait (%)
Place of birth for the foreign-born population - Lebanon (%)
Place of birth for the foreign-born population - Saudi Arabia (%)
Place of birth for the foreign-born population - Syria (%)
Place of birth for the foreign-born population - Turkey (%)
Place of birth for the foreign-born population - Yemen (%)
Place of birth for the foreign-born population - Other Western Asia (%)
Place of birth for the foreign-born population - Eritrea (%)
Place of birth for the foreign-born population - Ethiopia (%)
Place of birth for the foreign-born population - Kenya (%)
Place of birth for the foreign-born population - Somalia (%)
Place of birth for the foreign-born population - Uganda (%)
Place of birth for the foreign-born population - Zimbabwe (%)
Place of birth for the foreign-born population - Other Eastern Africa (%)
Place of birth for the foreign-born population - Cameroon (%)
Place of birth for the foreign-born population - Congo (%)
Place of birth for the foreign-born population - Democratic Republic of Congo (Zaire) (%)
Place of birth for the foreign-born population - Other Middle Africa (%)
Place of birth for the foreign-born population - Egypt (%)
Place of birth for the foreign-born population - Morocco (%)
Place of birth for the foreign-born population - Sudan (%)
Place of birth for the foreign-born population - Other Northern Africa (%)
Place of birth for the foreign-born population - South Africa (%)
Place of birth for the foreign-born population - Other Southern Africa (%)
Place of birth for the foreign-born population - Cabo Verde (%)
Place of birth for the foreign-born population - Ghana (%)
Place of birth for the foreign-born population - Liberia (%)
Place of birth for the foreign-born population - Nigeria (%)
Place of birth for the foreign-born population - Senegal (%)
Place of birth for the foreign-born population - Sierra Leone (%)
Place of birth for the foreign-born population - Other Western Africa (%)
Place of birth for the foreign-born population - Australia (%)
Place of birth for the foreign-born population - New Zealand (%)
Place of birth for the foreign-born population - Fiji (%)
Place of birth for the foreign-born population - Micronesia (%)
Place of birth for the foreign-born population - Bahamas (%)
Place of birth for the foreign-born population - Barbados (%)
Place of birth for the foreign-born population - Cuba (%)
Place of birth for the foreign-born population - Dominica (%)
Place of birth for the foreign-born population - Dominican Republic (%)
Place of birth for the foreign-born population - Grenada (%)
Place of birth for the foreign-born population - Haiti (%)
Place of birth for the foreign-born population - Jamaica (%)
Place of birth for the foreign-born population - St. Vincent and the Grenadines (%)
Place of birth for the foreign-born population - Trinidad and Tobago (%)
Place of birth for the foreign-born population - West Indies (%)
Place of birth for the foreign-born population - Other Caribbean (%)
Place of birth for the foreign-born population - Belize (%)
Place of birth for the foreign-born population - Costa Rica (%)
Place of birth for the foreign-born population - El Salvador (%)
Place of birth for the foreign-born population - Guatemala (%)
Place of birth for the foreign-born population - Honduras (%)
Place of birth for the foreign-born population - Mexico (%)
Place of birth for the foreign-born population - Nicaragua (%)
Place of birth for the foreign-born population - Panama (%)
Place of birth for the foreign-born population - Other Central America (%)
Place of birth for the foreign-born population - Argentina (%)
Place of birth for the foreign-born population - Bolivia (%)
Place of birth for the foreign-born population - Brazil (%)
Place of birth for the foreign-born population - Chile (%)
Place of birth for the foreign-born population - Colombia (%)
Place of birth for the foreign-born population - Ecuador (%)
Place of birth for the foreign-born population - Guyana (%)
Place of birth for the foreign-born population - Peru (%)
Place of birth for the foreign-born population - Uruguay (%)
Place of birth for the foreign-born population - Venezuela (%)
Place of birth for the foreign-born population - Other South America (%)
Place of birth for the foreign-born population - Canada (%)
Place of birth for the foreign-born population - Other Northern America (%)
Place of birth for the foreign-born population - Other (%)
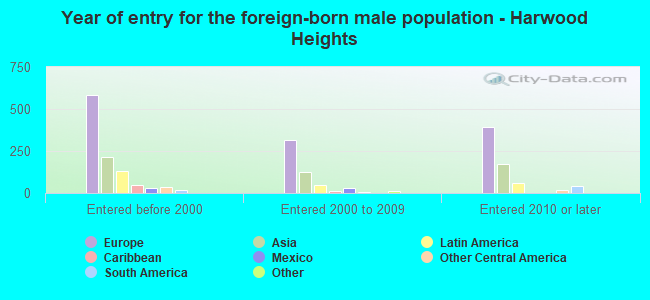
According to 2022 data, the most numerous races in Harwood Heights, IL are White alone (5,632 residents), Hispanic (1,679 residents), and Black alone (60 residents). 32.5% of Harwood Heights residents speak English at home. 45.8% of Harwood Heights, IL residents are foreign-born (28.8% born in Europe, 10.4% born in Asia, 5.0% born in Latin America), which is 69.5% greater than the foreign-born rate of 14.0% across the entire state of Illinois.
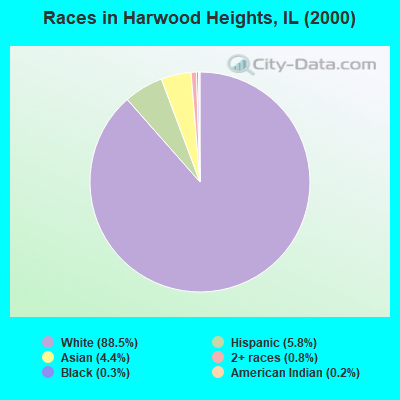
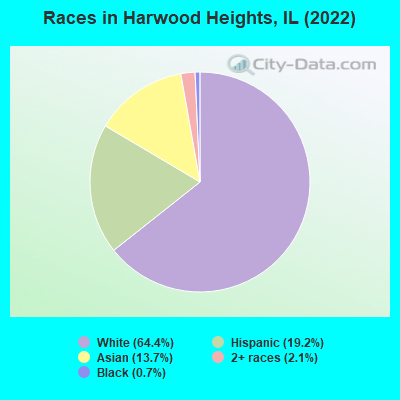
Race distribution in Harwood Heights
2000 2022
8,424,140 67.8% White alone 1,856,152 14.9% Black alone 1,530,262 12.3% Hispanic 419,916 3.4% Asian alone 153,996 1.2% Two or more races 13,479 0.1% Other race alone 18,232 0.1% American Indian alone 3,116 0.03% Native Hawaiian and Other
7,356,301 58.5% White alone 2,299,726 18.3% Hispanic 1,660,423 13.2% Black alone 747,296 5.9% Asian alone 458,599 3.6% Two or more races 45,386 0.4% Other race alone 10,405 0.08% American Indian alone 3,896 0.03% Native Hawaiian and Other
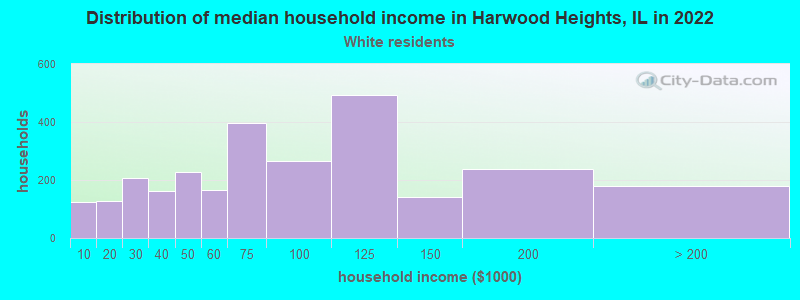
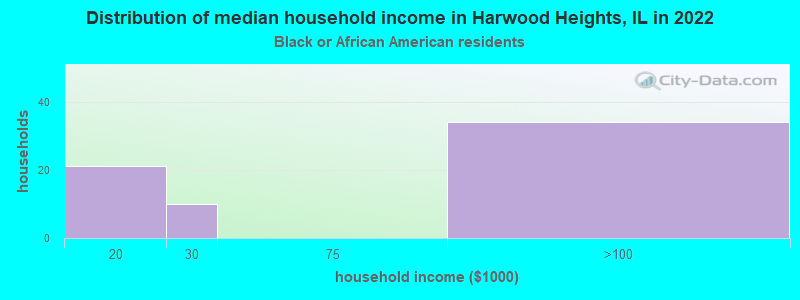
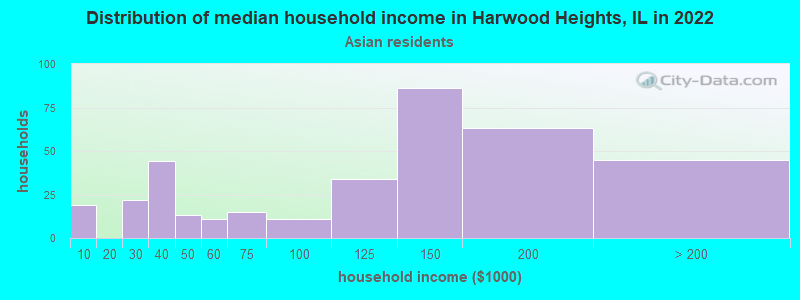
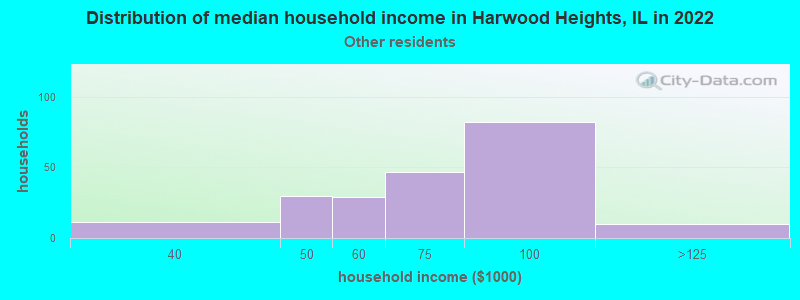
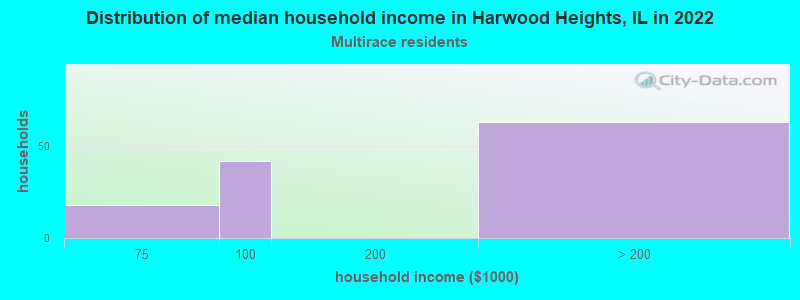
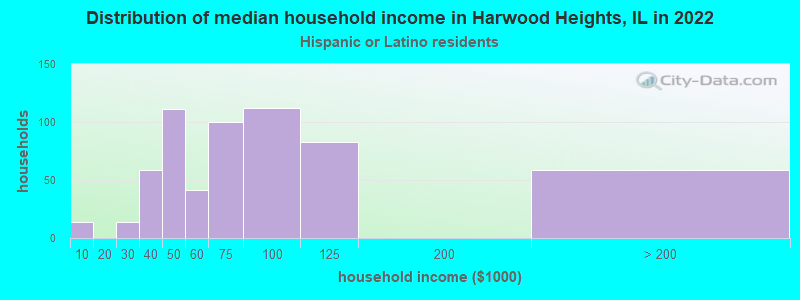
Income and house value in Harwood Heights Median household income in 2022 $71,293 White non-Hispanic householders$127,639 Asian householders$65,231 Some other race householdersover $200,000 Two or more races householders$67,211 Hispanic or Latino race householdersMedian 2022 house value $318,347 White Non-Hispanic householders $278,740 Asian householders$269,294 Two or more races householders$327,295 Hispanic or Latino householders
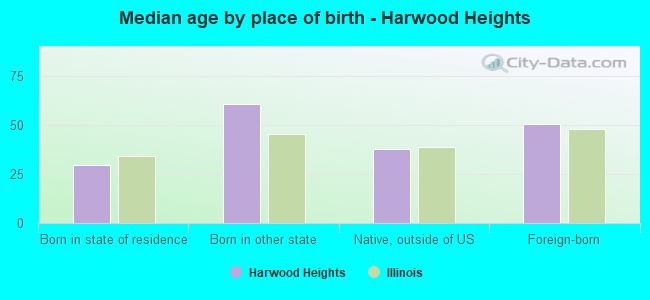
Median age by race in Harwood Heights
44.8 Median age for White residents41.2 48.3 63.0 Median age for Black or African American residents62.9 -681,780,016.1 13.3 Median age for American Indian / Alaska Native residents-736,736,736.0 -641,399,416.3 38.6 Median age for Asian residents43.6 37.3 -687,999,999.3 Median age for Native Hawaiian / Pacific Islander residents-918,721,460.3 -610,229,276.3 28.9 Median age for Other race residents29.0 28.9 15.6 Median age for Two or more races residents32.9 14.2 45.0 Median age for White alone residents41.5 47.1 29.4 Median age for Hispanic or Latino residents28.5 29.7
Owner/renter occupied households by race in Harwood Heights
House owners and renters - White residents 1,600 58.8% Owner occupied1,119 41.2% Renter occupiedHouse owners and renters - Black or African American residents 63 100.0% Renter occupiedHouse owners and renters - Asian residents 248 67.1% Owner occupied122 32.9% Renter occupiedHouse owners and renters - Other race residents 131 66.0% Owner occupied67 34.0% Renter occupiedHouse owners and renters - Two or more races residents 109 85.1% Owner occupied19 14.9% Renter occupiedHouse owners and renters - White alone residents 1,587 61.8% Owner occupied980 38.2% Renter occupiedHouse owners and renters - Hispanic or Latino residents 262 45.7% Owner occupied311 54.3% Renter occupied
Language usage in Harwood Heights
English speakers - Total 32.5% of residents of Harwood Heights speak English at home.
12.8% of residents speak Spanish at home 722 69.6% Speak English very well315 30.4% Speak English less than very well55.7% of residents speak other language at home 2,310 51.0% Speak English very well2,216 49.0% Speak English less than very well
English speakers - Born in the United States 89.5% of residents of Harwood Heights speak English at home.
4.7% of residents speak Spanish at home 8 100.0% Speak English very well4.7% of residents speak other language at home 8 100.0% Speak English less than very well
English speakers - Native, born elsewhere 0.0% of residents of Harwood Heights speak English at home.
9.9% of residents speak Spanish at home 11 100.0% Speak English less than very well91.9% of residents speak other language at home 32 31.4% Speak English very well70 68.6% Speak English less than very well
English speakers - Foreign-born 6.1% of residents of Harwood Heights speak English at home.
10.4% of residents speak Spanish at home 281 68.2% Speak English very well131 31.8% Speak English less than very well83.2% of residents speak other language at home 1,210 36.6% Speak English very well2,097 63.4% Speak English less than very well
White (Caucasian) - Speak only English Native:
65.4% (1,991)Foreign-born:
7.9% (171)
White (Caucasian) - Speak another language Native:
27.9% (850)Foreign-born:
91.6% (1,979)
American Indian / Alaska Native - Speak another language Native:
100.0% (78)Foreign-born:
100.0% (14)
Asian - Speak only English Native:
36.4% (79)Foreign-born:
3.8% (34)
Asian - Speak another language Native:
63.5% (138)Foreign-born:
97.3% (878)
Other race - Speak only English Native:
36.6% (139)Foreign-born:
4.8% (9)
Other race - Speak another language Native:
64.4% (244)Foreign-born:
95.2% (186)
Two or more races - Speak another language Native:
71.6% (213)Foreign-born:
100.0% (81)
White alone - Speak only English Native:
65.1% (1,802)Foreign-born:
7.3% (189)
White alone - Speak another language Native:
37.7% (1,043)Foreign-born:
93.6% (2,431)
Hispanic or Latino - Speak only English Native:
38.6% (403)Foreign-born:
1.9% (8)
Hispanic or Latino - Speak another language Native:
61.8% (645)Foreign-born:
98.4% (417)
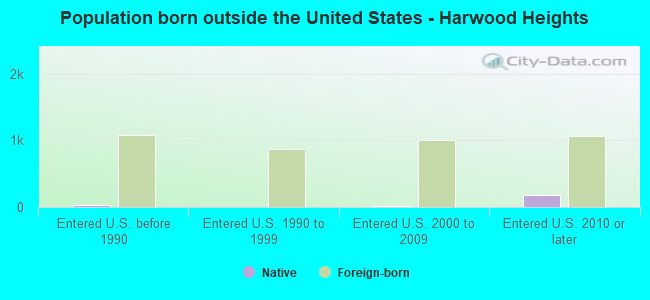
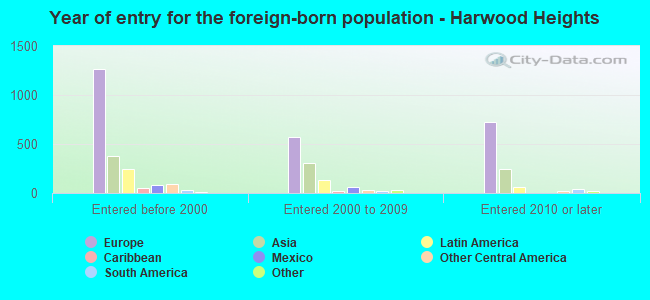
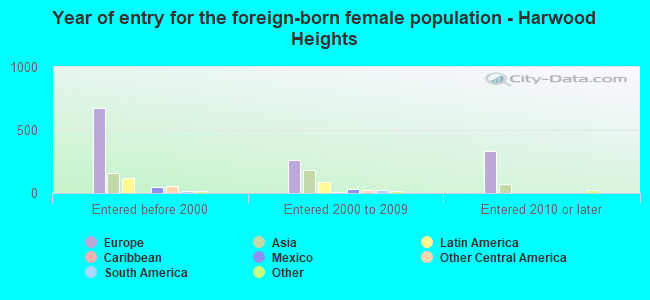
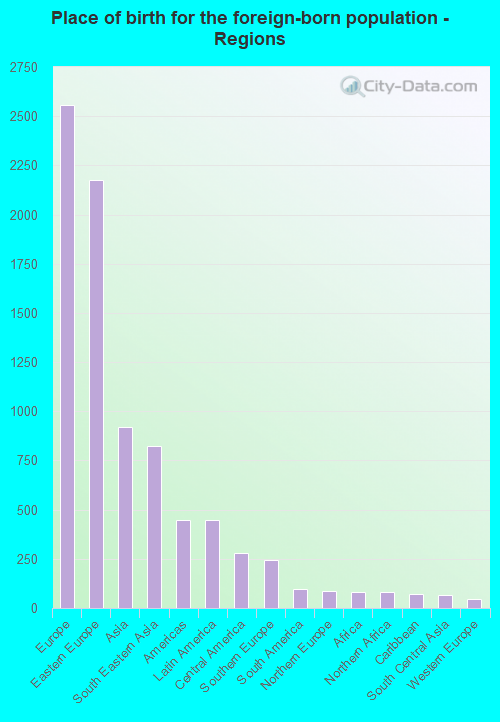
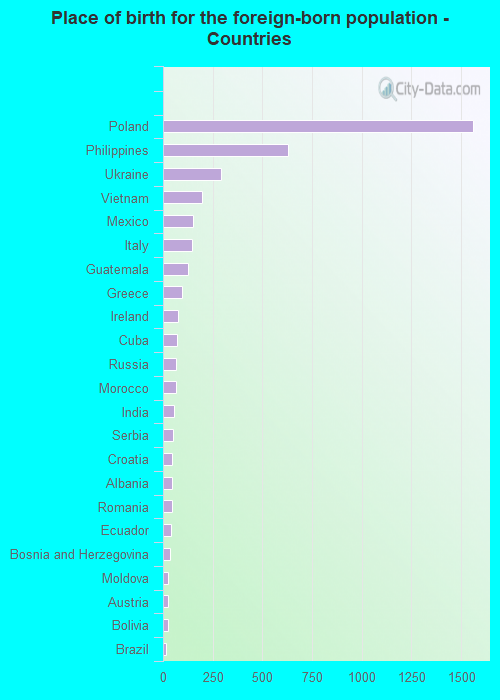
Foreign-born residents in Harwood Heights 4,008 residents are foreign born (28.8% Europe , 10.4% Asia , 5.0% Latin America ).
This city:
45.8%Illinois:
14.1%
Marital status for residents in Harwood Heights Marital status - White (Caucasian) population 15 years and over
Males 27.8% Never married57.8% Now married0.3% Separated1.7% Widowed12.4% DivorcedFemales 27.2% Never married49.3% Now married1.9% Separated10.0% Widowed11.6% DivorcedWomen who gave birth in the past 12 months Now married:
100.0% (32)Unmarried:
0.0% (0)
Women who did not give birth in the past 12 months Now married:
51.8% (646)Unmarried:
48.2% (602)
Marital status - Black or African American population 15 years and over
Males 36.4% Never married0.0% Now married63.6% Separated0.0% Widowed0.0% DivorcedFemales 0.0% Never married0.0% Now married0.0% Separated66.7% Widowed33.3% DivorcedWomen who did not give birth in the past 12 months Now married:
0.0% (0)Unmarried:
100.0% (9)
Marital status - American Indian / Alaska Native population 15 years and over
Males 100.0% Never married0.0% Now married0.0% Separated0.0% Widowed0.0% DivorcedFemales 0.0% Never married100.0% Now married0.0% Separated0.0% Widowed0.0% DivorcedWomen who did not give birth in the past 12 months Now married:
100.0% (14)Unmarried:
0.0% (0)
Marital status - Asian population 15 years and over
Males 31.4% Never married66.0% Now married0.0% Separated0.0% Widowed2.6% DivorcedFemales 19.1% Never married64.4% Now married0.0% Separated7.6% Widowed8.9% DivorcedWomen who gave birth in the past 12 months Now married:
100.0% (9)Unmarried:
0.0% (0)
Women who did not give birth in the past 12 months Now married:
70.9% (233)Unmarried:
29.1% (96)
Marital status - Other race population 15 years and over
Males 34.5% Never married56.8% Now married0.0% Separated0.0% Widowed8.7% DivorcedFemales 31.3% Never married65.5% Now married0.0% Separated0.0% Widowed3.2% DivorcedWomen who gave birth in the past 12 months Now married:
100.0% (42)Unmarried:
0.0% (0)
Women who did not give birth in the past 12 months Now married:
60.2% (133)Unmarried:
39.8% (88)
Marital status - Two or more races population 15 years and over
Males 32.6% Never married67.4% Now married0.0% Separated0.0% Widowed0.0% DivorcedFemales 16.0% Never married84.0% Now married0.0% Separated0.0% Widowed0.0% DivorcedWomen who did not give birth in the past 12 months Now married:
83.5% (92)Unmarried:
16.5% (18)
Marital status - White alone, not Hispanic / Latino population 15 years and over
Males 25.7% Never married59.2% Now married0.3% Separated1.9% Widowed12.9% DivorcedFemales 24.5% Never married51.7% Now married2.0% Separated9.9% Widowed11.9% DivorcedWomen who gave birth in the past 12 months Now married:
100.0% (30)Unmarried:
0.0% (0)
Women who did not give birth in the past 12 months Now married:
55.0% (686)Unmarried:
45.0% (561)
Marital status - Hispanic or Latino population 15 years and over
Males 41.1% Never married50.9% Now married0.0% Separated0.0% Widowed8.0% DivorcedFemales 37.5% Never married51.3% Now married0.3% Separated5.2% Widowed5.7% DivorcedWomen who gave birth in the past 12 months Now married:
100.0% (44)Unmarried:
0.0% (0)
Women who did not give birth in the past 12 months Now married:
52.5% (233)Unmarried:
47.5% (211)
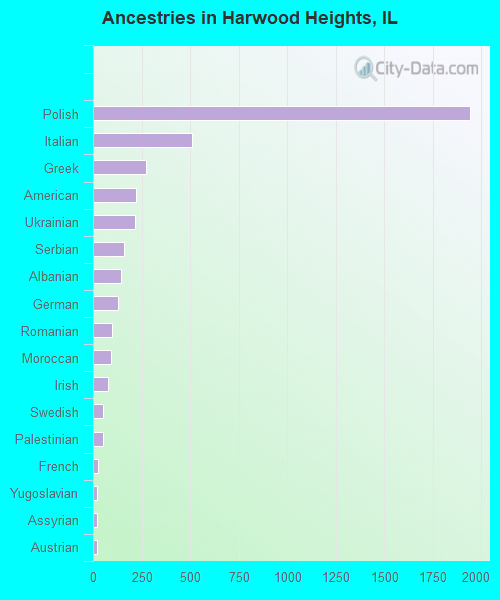
Ancestries in Harwood Heights
1,943 33.2% Polish512 8.8% Italian275 4.7% Greek224 3.8% American218 3.7% Ukrainian161 2.8% Serbian143 2.4% Albanian130 2.2% German96 1.6% Romanian95 1.6% Moroccan75 1.3% Irish54 0.9% Swedish49 0.8% Palestinian26 0.4% French22 0.4% Yugoslavian20 0.3% Assyrian20 0.3% Austrian17 0.3% Dutch9 0.2% European6 0.1% Finnish6 0.1% Scotch-Irish1 0.02% Kenyan
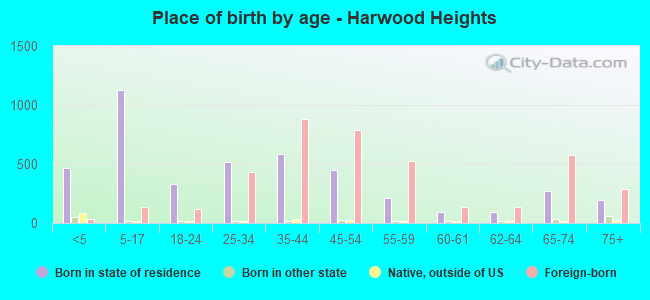
Children Nativity (place of birth) in Harwood Heights
Children under 6 years - Living with two parents Both parents native 77 100.0% NativeBoth parents foreign-born 184 86.0% Native30 14.0% Foreign-bornOne native, one foreign-born parent 212 100.0% NativeChildren under 6 years - Living with one parent Native parent 77 100.0% NativeChildren 6 to 17 years - Living with two parents Both parents native 98 100.0% NativeBoth parents foreign-born 499 82.8% Native104 17.2% Foreign-bornOne native, one foreign-born parent 187 100.0% NativeChildren 6 to 17 years - Living with one parent Native parent 177 100.0% NativeForeign-born parent 96 50.1% Native96 49.9% Foreign-born
Grandparents responsible for own grandchildren in Harwood Heights
Grandparents (30 to 59 years) White / Caucasian 20 26.2% Responsible for grandchildren57 73.8% Not responsible for grandchildrenOther race 52 100.0% Not responsible for grandchildrenWhite alone, not Hispanic / Latino 25 52.0% Responsible for grandchildren23 48.0% Not responsible for grandchildrenHispanic or Latino 3 2.9% Responsible for grandchildren90 97.1% Not responsible for grandchildren
Grandparents (60 years and over) White / Caucasian 49 100.0% Not responsible for grandchildrenWhite alone, not Hispanic / Latino 63 100.0% Not responsible for grandchildren