Races in Hazardville, Connecticut (CT) Detailed Stats
Data:
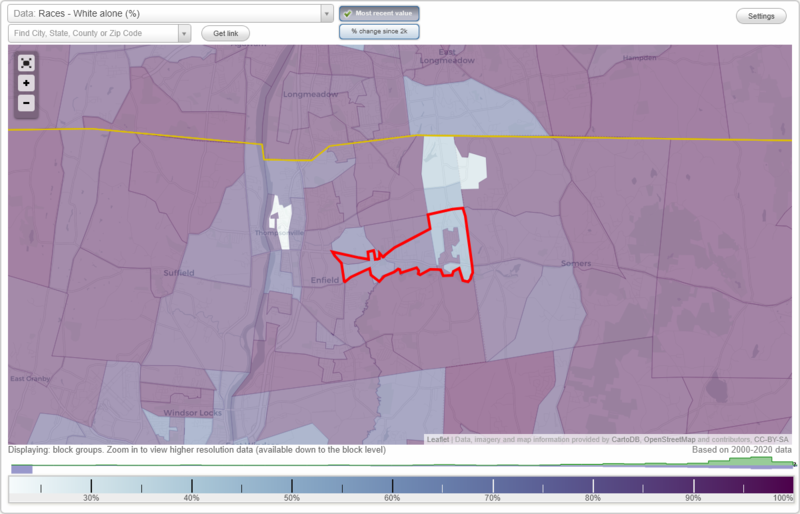
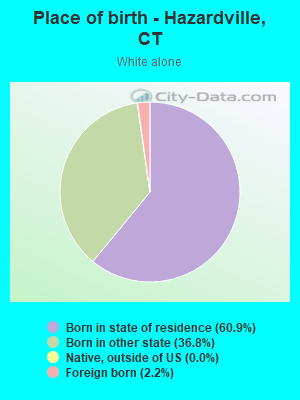
Races - White alone (%)
Races - White alone (% change since 2000)
Races - Black alone (%)
Races - Black alone (% change since 2000)
Races - American Indian alone (%)
Races - American Indian alone (% change since 2000)
Races - Asian alone (%)
Races - Asian alone (% change since 2000)
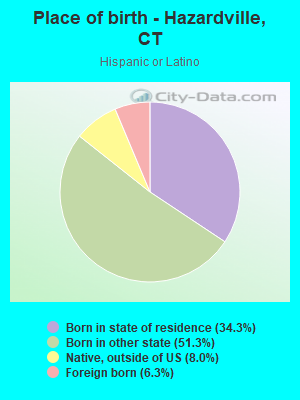
Races - Hispanic (%)
Races - Hispanic (% change since 2000)
Races - Native Hawaiian and Other Pacific Islander alone (%)
Races - Native Hawaiian and Other Pacific Islander alone (% change since 2000)
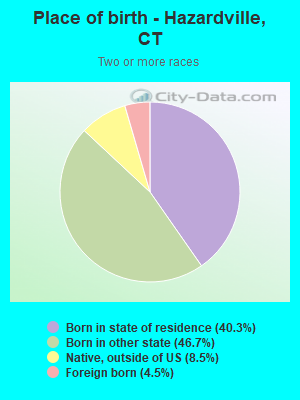
Races - Two or more races(%)
Races - Two or more races(% change since 2000)
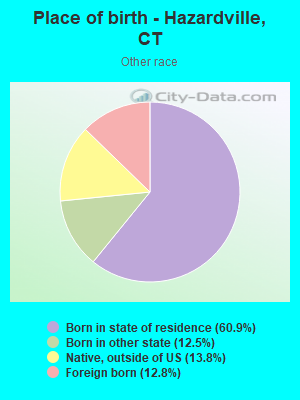
Races - Other race alone (%)
Races - Other race alone (% change since 2000)
Racial diversity
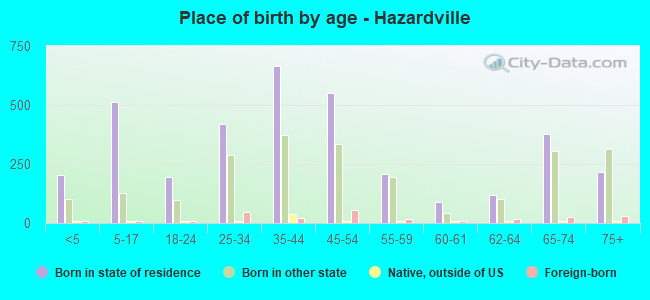
Place of birth - Born in state of residence (%)
Place of birth - Born in state of residence (%) - White
Place of birth - Born in state of residence (%) - Black or African American
Place of birth - Born in state of residence (%) - Asian
Place of birth - Born in state of residence (%) - Hispanic or Latino
Place of birth - Born in state of residence (%) - American Indian and Alaska Native
Place of birth - Born in state of residence (%) - Multirace
Place of birth - Born in state of residence (%) - Other Race
Place of birth - Born in other state (%)
Place of birth - Born in other state (%) - White
Place of birth - Born in other state (%) - Black or African American
Place of birth - Born in other state (%) - Asian
Place of birth - Born in other state (%) - Hispanic or Latino
Place of birth - Born in other state (%) - American Indian and Alaska Native
Place of birth - Born in other state (%) - Multirace
Place of birth - Born in other state (%) - Other Race
Place of birth - Native, outside of US (%)
Place of birth - Native, outside of US (%) - White
Place of birth - Native, outside of US (%) - Black or African American
Place of birth - Native, outside of US (%) - Asian
Place of birth - Native, outside of US (%) - Hispanic or Latino
Place of birth - Native, outside of US (%) - American Indian and Alaska Native
Place of birth - Native, outside of US (%) - Multirace
Place of birth - Native, outside of US (%) - Other Race
Place of birth - Foreign born (%)
Place of birth - Foreign born (%) - White
Place of birth - Foreign born (%) - Black or African American
Place of birth - Foreign born (%) - Asian
Place of birth - Foreign born (%) - Hispanic or Latino
Place of birth - Foreign born (%) - American Indian and Alaska Native
Place of birth - Foreign born (%) - Multirace
Place of birth - Foreign born (%) - Other Race
Residents speaking English at home (%)
Residents speaking English at home - Born in the United States (%)
Residents speaking English at home - Native, born elsewhere (%)
Residents speaking English at home - Foreign born (%)
Residents speaking Spanish at home (%)
Residents speaking Spanish at home - Born in the United States (%)
Residents speaking Spanish at home - Native, born elsewhere (%)
Residents speaking Spanish at home - Foreign born (%)
Residents speaking other language at home (%)
Residents speaking other language at home - Born in the United States (%)
Residents speaking other language at home - Native, born elsewhere (%)
Residents speaking other language at home - Foreign born (%)
Marital status - Never married (%)
Marital status - Now married (%)
Marital status - Separated (%)
Marital status - Widowed (%)
Marital status - Divorced (%)
Ancestries Reported - Arab (%)
Ancestries Reported - Czech (%)
Ancestries Reported - Danish (%)
Ancestries Reported - Dutch (%)
Ancestries Reported - English (%)
Ancestries Reported - French (%)
Ancestries Reported - French Canadian (%)
Ancestries Reported - German (%)
Ancestries Reported - Greek (%)
Ancestries Reported - Hungarian (%)
Ancestries Reported - Irish (%)
Ancestries Reported - Italian (%)
Ancestries Reported - Lithuanian (%)
Ancestries Reported - Norwegian (%)
Ancestries Reported - Polish (%)
Ancestries Reported - Portuguese (%)
Ancestries Reported - Russian (%)
Ancestries Reported - Scotch-Irish (%)
Ancestries Reported - Scottish (%)
Ancestries Reported - Slovak (%)
Ancestries Reported - Subsaharan African (%)
Ancestries Reported - Swedish (%)
Ancestries Reported - Swiss (%)
Ancestries Reported - Ukrainian (%)
Ancestries Reported - United States (%)
Ancestries Reported - Welsh (%)
Ancestries Reported - West Indian (%)
Ancestries Reported - Other (%)
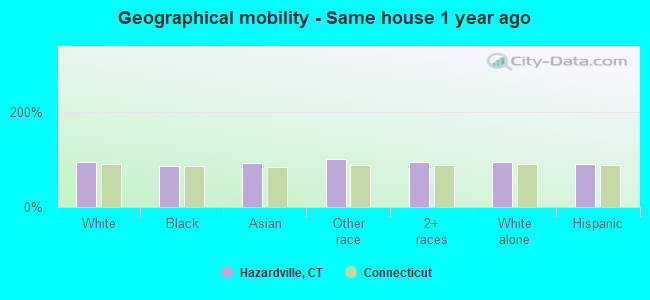
Geographical mobility - Same house 1 year ago (%)
Geographical mobility - Same house 1 year ago (%) - White
Geographical mobility - Same house 1 year ago (%) - Black or African American
Geographical mobility - Same house 1 year ago (%) - Asian
Geographical mobility - Same house 1 year ago (%) - Hispanic or Latino
Geographical mobility - Same house 1 year ago (%) - American Indian and Alaska Native
Geographical mobility - Same house 1 year ago (%) - Multirace
Geographical mobility - Same house 1 year ago (%) - Other Race
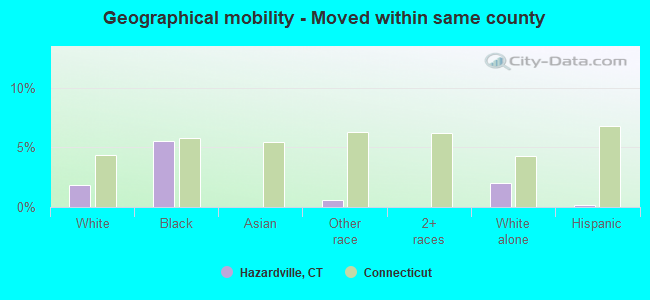
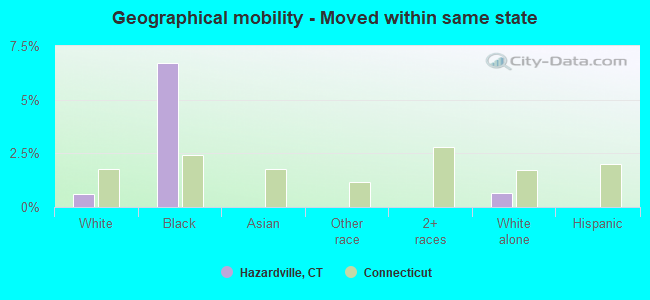
Geographical mobility - Moved within same county (%)
Geographical mobility - Moved within same county (%) - White
Geographical mobility - Moved within same county (%) - Black or African American
Geographical mobility - Moved within same county (%) - Asian
Geographical mobility - Moved within same county (%) - Hispanic or Latino
Geographical mobility - Moved within same county (%) - American Indian and Alaska Native
Geographical mobility - Moved within same county (%) - Multirace
Geographical mobility - Moved within same county (%) - Other Race
Geographical mobility - Moved from different county within same state (%)
Geographical mobility - Moved from different county within same state (%) - White
Geographical mobility - Moved from different county within same state (%) - Black or African American
Geographical mobility - Moved from different county within same state (%) - Asian
Geographical mobility - Moved from different county within same state (%) - Hispanic or Latino
Geographical mobility - Moved from different county within same state (%) - American Indian and Alaska Native
Geographical mobility - Moved from different county within same state (%) - Multirace
Geographical mobility - Moved from different county within same state (%) - Other Race
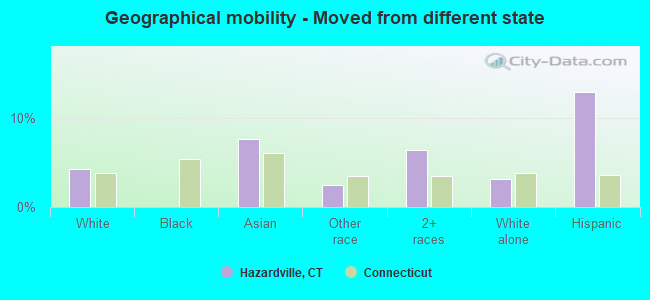
Geographical mobility - Moved from different state (%)
Geographical mobility - Moved from different state (%) - White
Geographical mobility - Moved from different state (%) - Black or African American
Geographical mobility - Moved from different state (%) - Asian
Geographical mobility - Moved from different state (%) - Hispanic or Latino
Geographical mobility - Moved from different state (%) - American Indian and Alaska Native
Geographical mobility - Moved from different state (%) - Multirace
Geographical mobility - Moved from different state (%) - Other Race
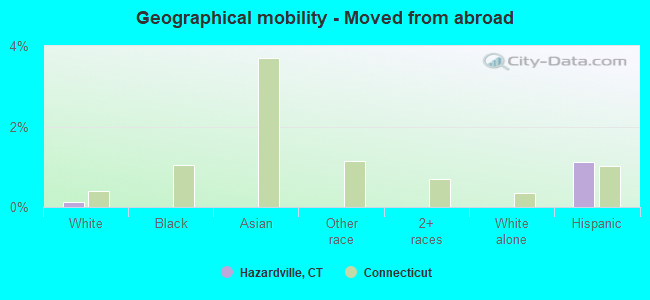
Geographical mobility - Moved from abroad (%)
Geographical mobility - Moved from abroad (%) - White
Geographical mobility - Moved from abroad (%) - Black or African American
Geographical mobility - Moved from abroad (%) - Asian
Geographical mobility - Moved from abroad (%) - Hispanic or Latino
Geographical mobility - Moved from abroad (%) - American Indian and Alaska Native
Geographical mobility - Moved from abroad (%) - Multirace
Geographical mobility - Moved from abroad (%) - Other Race
Place of birth for the foreign-born population - Ireland (%)
Place of birth for the foreign-born population - Denmark (%)
Place of birth for the foreign-born population - Norway (%)
Place of birth for the foreign-born population - Sweden (%)
Place of birth for the foreign-born population - United Kingdom (%)
Place of birth for the foreign-born population - England (%)
Place of birth for the foreign-born population - Scotland (%)
Place of birth for the foreign-born population - Other Northern Europe (%)
Place of birth for the foreign-born population - Austria (%)
Place of birth for the foreign-born population - Belgium (%)
Place of birth for the foreign-born population - France (%)
Place of birth for the foreign-born population - Germany (%)
Place of birth for the foreign-born population - Netherlands (%)
Place of birth for the foreign-born population - Switzerland (%)
Place of birth for the foreign-born population - Other Western Europe (%)
Place of birth for the foreign-born population - Greece (%)
Place of birth for the foreign-born population - Italy (%)
Place of birth for the foreign-born population - Portugal (%)
Place of birth for the foreign-born population - Spain (%)
Place of birth for the foreign-born population - Other Southern Europe (%)
Place of birth for the foreign-born population - Albania (%)
Place of birth for the foreign-born population - Belarus (%)
Place of birth for the foreign-born population - Bosnia and Herzegovina (%)
Place of birth for the foreign-born population - Bulgaria (%)
Place of birth for the foreign-born population - Croatia (%)
Place of birth for the foreign-born population - Czechoslovakia (%)
Place of birth for the foreign-born population - Hungary (%)
Place of birth for the foreign-born population - Latvia (%)
Place of birth for the foreign-born population - Lithuania (%)
Place of birth for the foreign-born population - North Macedonia (Macedonia) (%)
Place of birth for the foreign-born population - Moldova (%)
Place of birth for the foreign-born population - Poland (%)
Place of birth for the foreign-born population - Romania (%)
Place of birth for the foreign-born population - Russia (%)
Place of birth for the foreign-born population - Serbia (%)
Place of birth for the foreign-born population - Ukraine (%)
Place of birth for the foreign-born population - Other Eastern Europe (%)
Place of birth for the foreign-born population - China (%)
Place of birth for the foreign-born population - Hong Kong (%)
Place of birth for the foreign-born population - Taiwan (%)
Place of birth for the foreign-born population - Japan (%)
Place of birth for the foreign-born population - Korea (%)
Place of birth for the foreign-born population - Other Eastern Asia (%)
Place of birth for the foreign-born population - Afghanistan (%)
Place of birth for the foreign-born population - Bangladesh (%)
Place of birth for the foreign-born population - India (%)
Place of birth for the foreign-born population - Iran (%)
Place of birth for the foreign-born population - Kazakhstan (%)
Place of birth for the foreign-born population - Nepal (%)
Place of birth for the foreign-born population - Pakistan (%)
Place of birth for the foreign-born population - Sri Lanka (%)
Place of birth for the foreign-born population - Uzbekistan (%)
Place of birth for the foreign-born population - Other South Central Asia (%)
Place of birth for the foreign-born population - Burma (%)
Place of birth for the foreign-born population - Cambodia (%)
Place of birth for the foreign-born population - Indonesia (%)
Place of birth for the foreign-born population - Laos (%)
Place of birth for the foreign-born population - Malaysia (%)
Place of birth for the foreign-born population - Philippines (%)
Place of birth for the foreign-born population - Singapore (%)
Place of birth for the foreign-born population - Thailand (%)
Place of birth for the foreign-born population - Vietnam (%)
Place of birth for the foreign-born population - Other South Eastern Asia (%)
Place of birth for the foreign-born population - Armenia (%)
Place of birth for the foreign-born population - Iraq (%)
Place of birth for the foreign-born population - Israel (%)
Place of birth for the foreign-born population - Jordan (%)
Place of birth for the foreign-born population - Kuwait (%)
Place of birth for the foreign-born population - Lebanon (%)
Place of birth for the foreign-born population - Saudi Arabia (%)
Place of birth for the foreign-born population - Syria (%)
Place of birth for the foreign-born population - Turkey (%)
Place of birth for the foreign-born population - Yemen (%)
Place of birth for the foreign-born population - Other Western Asia (%)
Place of birth for the foreign-born population - Eritrea (%)
Place of birth for the foreign-born population - Ethiopia (%)
Place of birth for the foreign-born population - Kenya (%)
Place of birth for the foreign-born population - Somalia (%)
Place of birth for the foreign-born population - Uganda (%)
Place of birth for the foreign-born population - Zimbabwe (%)
Place of birth for the foreign-born population - Other Eastern Africa (%)
Place of birth for the foreign-born population - Cameroon (%)
Place of birth for the foreign-born population - Congo (%)
Place of birth for the foreign-born population - Democratic Republic of Congo (Zaire) (%)
Place of birth for the foreign-born population - Other Middle Africa (%)
Place of birth for the foreign-born population - Egypt (%)
Place of birth for the foreign-born population - Morocco (%)
Place of birth for the foreign-born population - Sudan (%)
Place of birth for the foreign-born population - Other Northern Africa (%)
Place of birth for the foreign-born population - South Africa (%)
Place of birth for the foreign-born population - Other Southern Africa (%)
Place of birth for the foreign-born population - Cabo Verde (%)
Place of birth for the foreign-born population - Ghana (%)
Place of birth for the foreign-born population - Liberia (%)
Place of birth for the foreign-born population - Nigeria (%)
Place of birth for the foreign-born population - Senegal (%)
Place of birth for the foreign-born population - Sierra Leone (%)
Place of birth for the foreign-born population - Other Western Africa (%)
Place of birth for the foreign-born population - Australia (%)
Place of birth for the foreign-born population - New Zealand (%)
Place of birth for the foreign-born population - Fiji (%)
Place of birth for the foreign-born population - Micronesia (%)
Place of birth for the foreign-born population - Bahamas (%)
Place of birth for the foreign-born population - Barbados (%)
Place of birth for the foreign-born population - Cuba (%)
Place of birth for the foreign-born population - Dominica (%)
Place of birth for the foreign-born population - Dominican Republic (%)
Place of birth for the foreign-born population - Grenada (%)
Place of birth for the foreign-born population - Haiti (%)
Place of birth for the foreign-born population - Jamaica (%)
Place of birth for the foreign-born population - St. Vincent and the Grenadines (%)
Place of birth for the foreign-born population - Trinidad and Tobago (%)
Place of birth for the foreign-born population - West Indies (%)
Place of birth for the foreign-born population - Other Caribbean (%)
Place of birth for the foreign-born population - Belize (%)
Place of birth for the foreign-born population - Costa Rica (%)
Place of birth for the foreign-born population - El Salvador (%)
Place of birth for the foreign-born population - Guatemala (%)
Place of birth for the foreign-born population - Honduras (%)
Place of birth for the foreign-born population - Mexico (%)
Place of birth for the foreign-born population - Nicaragua (%)
Place of birth for the foreign-born population - Panama (%)
Place of birth for the foreign-born population - Other Central America (%)
Place of birth for the foreign-born population - Argentina (%)
Place of birth for the foreign-born population - Bolivia (%)
Place of birth for the foreign-born population - Brazil (%)
Place of birth for the foreign-born population - Chile (%)
Place of birth for the foreign-born population - Colombia (%)
Place of birth for the foreign-born population - Ecuador (%)
Place of birth for the foreign-born population - Guyana (%)
Place of birth for the foreign-born population - Peru (%)
Place of birth for the foreign-born population - Uruguay (%)
Place of birth for the foreign-born population - Venezuela (%)
Place of birth for the foreign-born population - Other South America (%)
Place of birth for the foreign-born population - Canada (%)
Place of birth for the foreign-born population - Other Northern America (%)
Place of birth for the foreign-born population - Other (%)
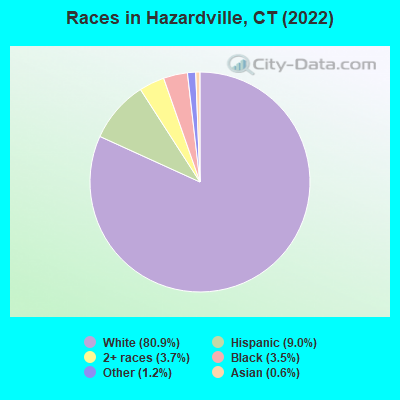
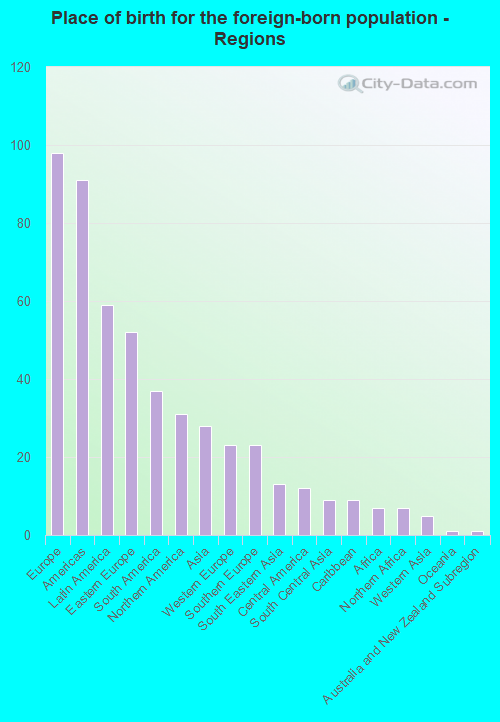
According to 2022 data, the most numerous races in Hazardville, CT are White alone (4,971 residents), Hispanic (556 residents), and Black alone (217 residents). 90.7% of Hazardville residents speak English at home. 3.7% of Hazardville, CT residents are foreign-born (1.5% born in Europe, 0.9% born in Latin America, 0.5% born in North America, 0.4% born in Asia), which is 308.1% less than the foreign-born rate of 15.0% across the entire state of Connecticut.
Race distribution in Hazardville
2000 2022
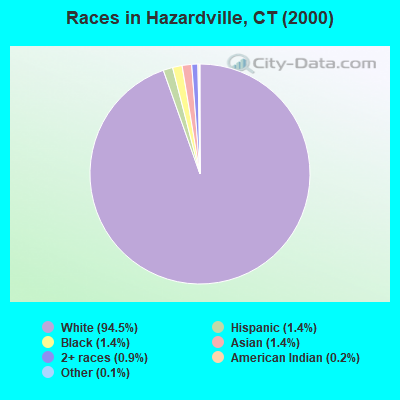
2,638,845 77.5% White alone 320,323 9.4% Hispanic 295,571 8.7% Black alone 81,564 2.4% Asian alone 52,896 1.6% Two or more races 8,141 0.2% Other race alone 7,267 0.2% American Indian alone 958 0.03% Native Hawaiian and Other
2,246,913 62.0% White alone 658,978 18.2% Hispanic 353,973 9.8% Black alone 172,929 4.8% Asian alone 159,631 4.4% Two or more races 29,761 0.8% Other race alone 3,428 0.09% American Indian alone 592 0.02% Native Hawaiian and Other
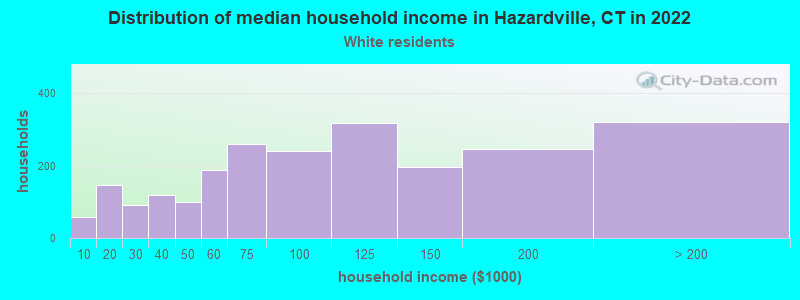
Income and house value in Hazardville Median household income in 2022 $92,823 White non-Hispanic householders$79,637 Black householdersMedian 2022 house value $239,615 White Non-Hispanic householders$203,027 Black or African American householders$233,053 Two or more races householders$223,707 Hispanic or Latino householders
Median age by race in Hazardville
49.4 Median age for White residents44.6 51.6 43.0 Median age for Black or African American residents38.5 53.0 -742,173,111.6 Median age for American Indian / Alaska Native residents-701,030,927.1 -704,477,611.2 55.8 Median age for Asian residents37.5 62.9 -641,269,840.6 Median age for Native Hawaiian / Pacific Islander residents-414,239,481.8 -691,588,784.4 39.4 Median age for Other race residents38.9 39.1 22.5 Median age for Two or more races residents22.4 22.0 50.2 Median age for White alone residents47.2 51.1 23.7 Median age for Hispanic or Latino residents11.2 26.3
Owner/renter occupied households by race in Hazardville
House owners and renters - White residents 2,001 87.2% Owner occupied293 12.8% Renter occupiedHouse owners and renters - Black or African American residents 30 51.2% Owner occupied29 48.8% Renter occupiedHouse owners and renters - Asian residents 4 45.8% Owner occupied5 54.2% Renter occupiedHouse owners and renters - Other race residents 23 100.0% Owner occupiedHouse owners and renters - Two or more races residents 129 81.3% Owner occupied30 18.7% Renter occupiedHouse owners and renters - White alone residents 2,005 87.0% Owner occupied299 13.0% Renter occupiedHouse owners and renters - Hispanic or Latino residents 83 70.7% Owner occupied34 29.3% Renter occupied
Language usage in Hazardville
English speakers - Total 90.7% of residents of Hazardville speak English at home.
4.0% of residents speak Spanish at home 192 82.1% Speak English very well42 17.9% Speak English less than very well4.6% of residents speak other language at home 203 74.9% Speak English very well68 25.1% Speak English less than very well
English speakers - Born in the United States 90.5% of residents of Hazardville speak English at home.
6.0% of residents speak Spanish at home 104 78.8% Speak English very well28 21.2% Speak English less than very well3.1% of residents speak other language at home 63 91.3% Speak English very well6 8.7% Speak English less than very well
English speakers - Native, born elsewhere 34.0% of residents of Hazardville speak English at home.
64.0% of residents speak Spanish at home 18 56.2% Speak English very well14 43.8% Speak English less than very well
English speakers - Foreign-born 39.1% of residents of Hazardville speak English at home.
7.1% of residents speak Spanish at home 16 100.0% Speak English very well52.9% of residents speak other language at home 78 65.5% Speak English very well41 34.5% Speak English less than very well
White (Caucasian) - Speak only English Native:
97.1% (4,614)Foreign-born:
43.4% (44)
White (Caucasian) - Speak another language Native:
3.6% (172)Foreign-born:
58.9% (60)
Black or African American - Speak only English Native:
79.7% (140)Foreign-born:
100.0% (39)
Other race - Speak another language Native:
5.5% (7)Foreign-born:
100.0% (18)
Two or more races - Speak another language Native:
30.2% (125)Foreign-born:
100.0% (23)
White alone - Speak only English Native:
95.9% (4,548)Foreign-born:
33.2% (36)
White alone - Speak another language Native:
4.1% (196)Foreign-born:
66.8% (73)
Hispanic or Latino - Speak only English Native:
66.6% (240)Foreign-born:
24.7% (9)
Hispanic or Latino - Speak another language Native:
35.2% (127)Foreign-born:
71.5% (26)
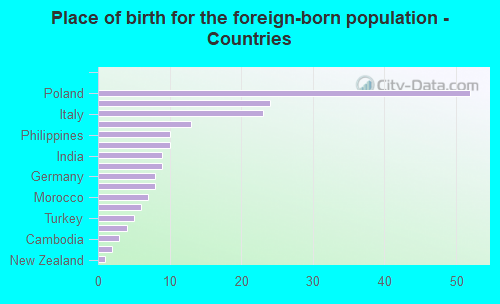
Foreign-born residents in Hazardville 226 residents are foreign born (1.5% Europe , 0.9% Latin America , 0.5% North America , 0.4% Asia ).
This city:
3.7%Connecticut:
15.0%
Marital status for residents in Hazardville Marital status - White (Caucasian) population 15 years and over
Males 29.5% Never married56.1% Now married2.2% Separated3.0% Widowed9.3% DivorcedFemales 17.2% Never married59.0% Now married0.7% Separated10.3% Widowed12.7% DivorcedWomen who gave birth in the past 12 months Now married:
52.8% (26)Unmarried:
47.2% (23)
Women who did not give birth in the past 12 months Now married:
62.1% (612)Unmarried:
37.9% (374)
Marital status - Black or African American population 15 years and over
Males 47.1% Never married29.9% Now married19.0% Separated0.0% Widowed4.0% DivorcedFemales 55.6% Never married26.7% Now married17.8% Separated0.0% Widowed0.0% DivorcedWomen who did not give birth in the past 12 months Now married:
0.0% (0)Unmarried:
100.0% (16)
Marital status - Asian population 15 years and over
Males 0.0% Never married87.0% Now married13.0% Separated0.0% Widowed0.0% DivorcedFemales 0.0% Never married63.6% Now married0.0% Separated36.4% Widowed0.0% DivorcedMarital status - Other race population 15 years and over
Males 85.3% Never married14.7% Now married0.0% Separated0.0% Widowed0.0% DivorcedFemales 0.0% Never married35.0% Now married0.0% Separated0.0% Widowed65.0% DivorcedWomen who did not give birth in the past 12 months Now married:
100.0% (9)Unmarried:
0.0% (0)
Marital status - Two or more races population 15 years and over
Males 69.1% Never married30.9% Now married0.0% Separated0.0% Widowed0.0% DivorcedFemales 48.8% Never married25.0% Now married0.0% Separated7.5% Widowed18.8% DivorcedWomen who did not give birth in the past 12 months Now married:
27.0% (61)Unmarried:
73.0% (165)
Marital status - White alone, not Hispanic / Latino population 15 years and over
Males 29.2% Never married56.3% Now married2.2% Separated3.1% Widowed9.2% DivorcedFemales 15.8% Never married59.8% Now married0.8% Separated10.6% Widowed13.1% DivorcedWomen who gave birth in the past 12 months Now married:
40.5% (16)Unmarried:
59.5% (24)
Women who did not give birth in the past 12 months Now married:
63.6% (637)Unmarried:
36.4% (365)
Marital status - Hispanic or Latino population 15 years and over
Males 61.0% Never married33.8% Now married0.0% Separated0.0% Widowed5.1% DivorcedFemales 41.0% Never married35.3% Now married0.0% Separated0.0% Widowed23.7% DivorcedWomen who gave birth in the past 12 months Now married:
100.0% (12)Unmarried:
0.0% (0)
Women who did not give birth in the past 12 months Now married:
36.7% (46)Unmarried:
63.3% (80)
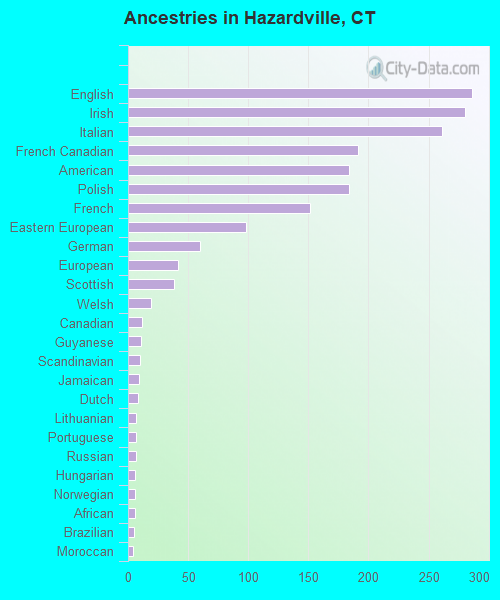
Ancestries in Hazardville
286 12.6% English280 12.3% Irish261 11.5% Italian191 8.4% French Canadian184 8.1% American184 8.1% Polish151 6.6% French98 4.3% Eastern European60 2.6% German42 1.8% European38 1.7% Scottish19 0.8% Welsh12 0.5% Canadian11 0.5% Guyanese10 0.4% Scandinavian9 0.4% Jamaican8 0.4% Dutch7 0.3% Lithuanian7 0.3% Portuguese7 0.3% Russian6 0.3% Hungarian6 0.3% Norwegian6 0.3% African5 0.2% Brazilian4 0.2% Moroccan4 0.2% Turkish3 0.1% Armenian3 0.1% Czechoslovakian
Children Nativity (place of birth) in Hazardville
Children under 6 years - Living with two parents Both parents native 196 100.0% NativeOne native, one foreign-born parent 54 100.0% NativeChildren under 6 years - Living with one parent Native parent 132 100.0% Native
Children 6 to 17 years - Living with two parents Both parents native 388 100.0% NativeOne native, one foreign-born parent 22 100.0% NativeChildren 6 to 17 years - Living with one parent Native parent 105 100.0% Native
Grandparents responsible for own grandchildren in Hazardville
Grandparents (30 to 59 years) White / Caucasian 4 100.0% Not responsible for grandchildrenTwo or more races 10 100.0% Responsible for grandchildrenWhite alone, not Hispanic / Latino 5 100.0% Not responsible for grandchildrenHispanic or Latino 5 100.0% Responsible for grandchildrenGrandparents (60 years and over) White / Caucasian 17 46.7% Responsible for grandchildren20 53.3% Not responsible for grandchildrenWhite alone, not Hispanic / Latino 19 46.9% Responsible for grandchildren21 53.1% Not responsible for grandchildren