Races in Heber, Utah (UT) Detailed Stats
Data:
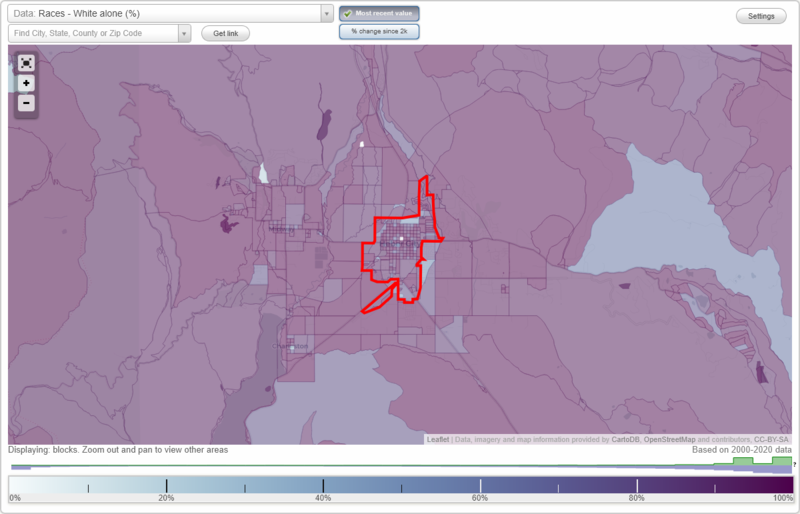
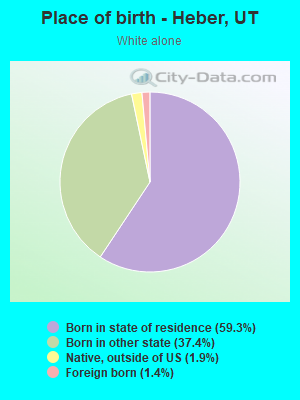
Races - White alone (%)
Races - White alone (% change since 2000)
Races - Black alone (%)
Races - Black alone (% change since 2000)
Races - American Indian alone (%)
Races - American Indian alone (% change since 2000)
Races - Asian alone (%)
Races - Asian alone (% change since 2000)
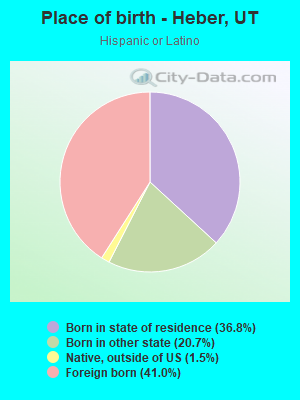
Races - Hispanic (%)
Races - Hispanic (% change since 2000)
Races - Native Hawaiian and Other Pacific Islander alone (%)
Races - Native Hawaiian and Other Pacific Islander alone (% change since 2000)
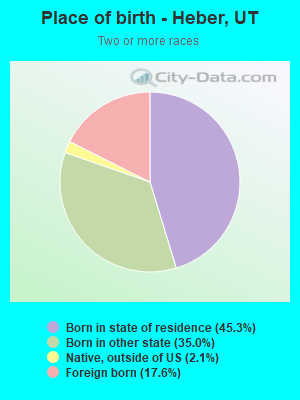
Races - Two or more races(%)
Races - Two or more races(% change since 2000)
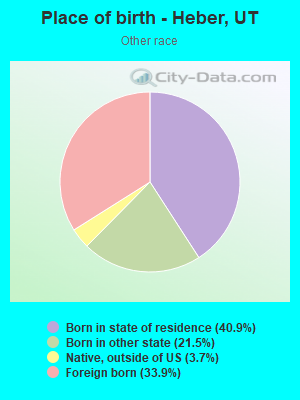
Races - Other race alone (%)
Races - Other race alone (% change since 2000)
Racial diversity
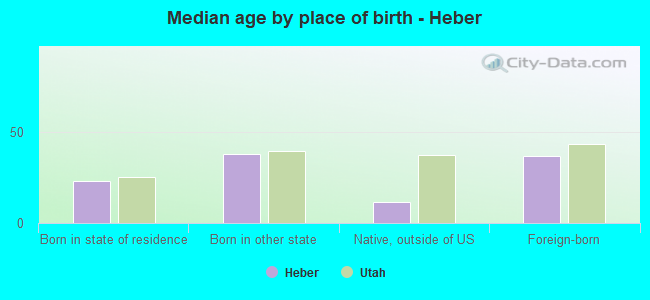
Place of birth - Born in state of residence (%)
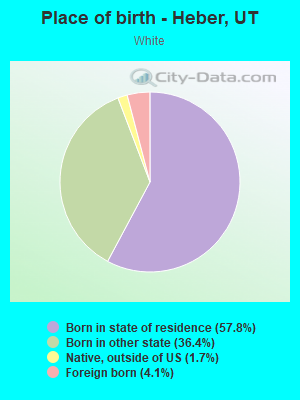
Place of birth - Born in state of residence (%) - White
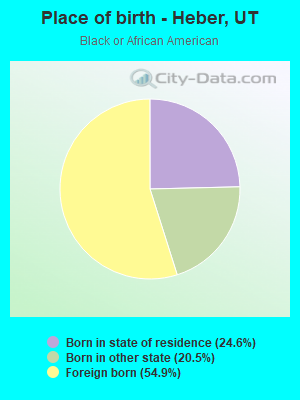
Place of birth - Born in state of residence (%) - Black or African American
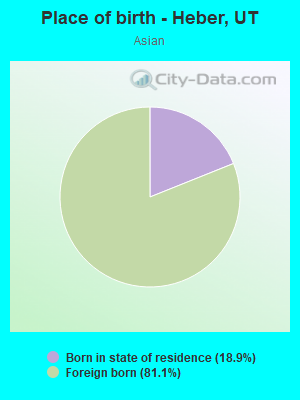
Place of birth - Born in state of residence (%) - Asian
Place of birth - Born in state of residence (%) - Hispanic or Latino
Place of birth - Born in state of residence (%) - American Indian and Alaska Native
Place of birth - Born in state of residence (%) - Multirace
Place of birth - Born in state of residence (%) - Other Race
Place of birth - Born in other state (%)
Place of birth - Born in other state (%) - White
Place of birth - Born in other state (%) - Black or African American
Place of birth - Born in other state (%) - Asian
Place of birth - Born in other state (%) - Hispanic or Latino
Place of birth - Born in other state (%) - American Indian and Alaska Native
Place of birth - Born in other state (%) - Multirace
Place of birth - Born in other state (%) - Other Race
Place of birth - Native, outside of US (%)
Place of birth - Native, outside of US (%) - White
Place of birth - Native, outside of US (%) - Black or African American
Place of birth - Native, outside of US (%) - Asian
Place of birth - Native, outside of US (%) - Hispanic or Latino
Place of birth - Native, outside of US (%) - American Indian and Alaska Native
Place of birth - Native, outside of US (%) - Multirace
Place of birth - Native, outside of US (%) - Other Race
Place of birth - Foreign born (%)
Place of birth - Foreign born (%) - White
Place of birth - Foreign born (%) - Black or African American
Place of birth - Foreign born (%) - Asian
Place of birth - Foreign born (%) - Hispanic or Latino
Place of birth - Foreign born (%) - American Indian and Alaska Native
Place of birth - Foreign born (%) - Multirace
Place of birth - Foreign born (%) - Other Race
Residents speaking English at home (%)
Residents speaking English at home - Born in the United States (%)
Residents speaking English at home - Native, born elsewhere (%)
Residents speaking English at home - Foreign born (%)
Residents speaking Spanish at home (%)
Residents speaking Spanish at home - Born in the United States (%)
Residents speaking Spanish at home - Native, born elsewhere (%)
Residents speaking Spanish at home - Foreign born (%)
Residents speaking other language at home (%)
Residents speaking other language at home - Born in the United States (%)
Residents speaking other language at home - Native, born elsewhere (%)
Residents speaking other language at home - Foreign born (%)
Marital status - Never married (%)
Marital status - Now married (%)
Marital status - Separated (%)
Marital status - Widowed (%)
Marital status - Divorced (%)
Ancestries Reported - Arab (%)
Ancestries Reported - Czech (%)
Ancestries Reported - Danish (%)
Ancestries Reported - Dutch (%)
Ancestries Reported - English (%)
Ancestries Reported - French (%)
Ancestries Reported - French Canadian (%)
Ancestries Reported - German (%)
Ancestries Reported - Greek (%)
Ancestries Reported - Hungarian (%)
Ancestries Reported - Irish (%)
Ancestries Reported - Italian (%)
Ancestries Reported - Lithuanian (%)
Ancestries Reported - Norwegian (%)
Ancestries Reported - Polish (%)
Ancestries Reported - Portuguese (%)
Ancestries Reported - Russian (%)
Ancestries Reported - Scotch-Irish (%)
Ancestries Reported - Scottish (%)
Ancestries Reported - Slovak (%)
Ancestries Reported - Subsaharan African (%)
Ancestries Reported - Swedish (%)
Ancestries Reported - Swiss (%)
Ancestries Reported - Ukrainian (%)
Ancestries Reported - United States (%)
Ancestries Reported - Welsh (%)
Ancestries Reported - West Indian (%)
Ancestries Reported - Other (%)
Geographical mobility - Same house 1 year ago (%)
Geographical mobility - Same house 1 year ago (%) - White
Geographical mobility - Same house 1 year ago (%) - Black or African American
Geographical mobility - Same house 1 year ago (%) - Asian
Geographical mobility - Same house 1 year ago (%) - Hispanic or Latino
Geographical mobility - Same house 1 year ago (%) - American Indian and Alaska Native
Geographical mobility - Same house 1 year ago (%) - Multirace
Geographical mobility - Same house 1 year ago (%) - Other Race
Geographical mobility - Moved within same county (%)
Geographical mobility - Moved within same county (%) - White
Geographical mobility - Moved within same county (%) - Black or African American
Geographical mobility - Moved within same county (%) - Asian
Geographical mobility - Moved within same county (%) - Hispanic or Latino
Geographical mobility - Moved within same county (%) - American Indian and Alaska Native
Geographical mobility - Moved within same county (%) - Multirace
Geographical mobility - Moved within same county (%) - Other Race
Geographical mobility - Moved from different county within same state (%)
Geographical mobility - Moved from different county within same state (%) - White
Geographical mobility - Moved from different county within same state (%) - Black or African American
Geographical mobility - Moved from different county within same state (%) - Asian
Geographical mobility - Moved from different county within same state (%) - Hispanic or Latino
Geographical mobility - Moved from different county within same state (%) - American Indian and Alaska Native
Geographical mobility - Moved from different county within same state (%) - Multirace
Geographical mobility - Moved from different county within same state (%) - Other Race
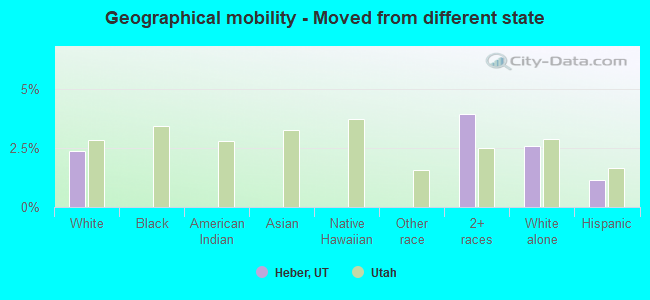
Geographical mobility - Moved from different state (%)
Geographical mobility - Moved from different state (%) - White
Geographical mobility - Moved from different state (%) - Black or African American
Geographical mobility - Moved from different state (%) - Asian
Geographical mobility - Moved from different state (%) - Hispanic or Latino
Geographical mobility - Moved from different state (%) - American Indian and Alaska Native
Geographical mobility - Moved from different state (%) - Multirace
Geographical mobility - Moved from different state (%) - Other Race
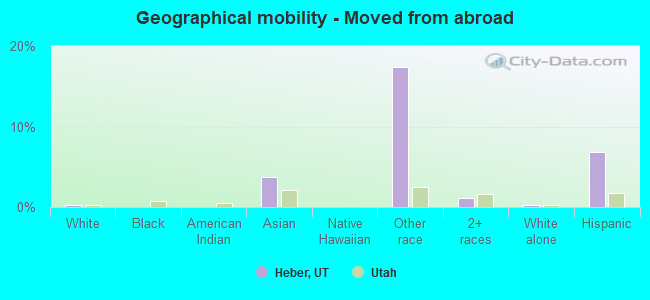
Geographical mobility - Moved from abroad (%)
Geographical mobility - Moved from abroad (%) - White
Geographical mobility - Moved from abroad (%) - Black or African American
Geographical mobility - Moved from abroad (%) - Asian
Geographical mobility - Moved from abroad (%) - Hispanic or Latino
Geographical mobility - Moved from abroad (%) - American Indian and Alaska Native
Geographical mobility - Moved from abroad (%) - Multirace
Geographical mobility - Moved from abroad (%) - Other Race
Place of birth for the foreign-born population - Ireland (%)
Place of birth for the foreign-born population - Denmark (%)
Place of birth for the foreign-born population - Norway (%)
Place of birth for the foreign-born population - Sweden (%)
Place of birth for the foreign-born population - United Kingdom (%)
Place of birth for the foreign-born population - England (%)
Place of birth for the foreign-born population - Scotland (%)
Place of birth for the foreign-born population - Other Northern Europe (%)
Place of birth for the foreign-born population - Austria (%)
Place of birth for the foreign-born population - Belgium (%)
Place of birth for the foreign-born population - France (%)
Place of birth for the foreign-born population - Germany (%)
Place of birth for the foreign-born population - Netherlands (%)
Place of birth for the foreign-born population - Switzerland (%)
Place of birth for the foreign-born population - Other Western Europe (%)
Place of birth for the foreign-born population - Greece (%)
Place of birth for the foreign-born population - Italy (%)
Place of birth for the foreign-born population - Portugal (%)
Place of birth for the foreign-born population - Spain (%)
Place of birth for the foreign-born population - Other Southern Europe (%)
Place of birth for the foreign-born population - Albania (%)
Place of birth for the foreign-born population - Belarus (%)
Place of birth for the foreign-born population - Bosnia and Herzegovina (%)
Place of birth for the foreign-born population - Bulgaria (%)
Place of birth for the foreign-born population - Croatia (%)
Place of birth for the foreign-born population - Czechoslovakia (%)
Place of birth for the foreign-born population - Hungary (%)
Place of birth for the foreign-born population - Latvia (%)
Place of birth for the foreign-born population - Lithuania (%)
Place of birth for the foreign-born population - North Macedonia (Macedonia) (%)
Place of birth for the foreign-born population - Moldova (%)
Place of birth for the foreign-born population - Poland (%)
Place of birth for the foreign-born population - Romania (%)
Place of birth for the foreign-born population - Russia (%)
Place of birth for the foreign-born population - Serbia (%)
Place of birth for the foreign-born population - Ukraine (%)
Place of birth for the foreign-born population - Other Eastern Europe (%)
Place of birth for the foreign-born population - China (%)
Place of birth for the foreign-born population - Hong Kong (%)
Place of birth for the foreign-born population - Taiwan (%)
Place of birth for the foreign-born population - Japan (%)
Place of birth for the foreign-born population - Korea (%)
Place of birth for the foreign-born population - Other Eastern Asia (%)
Place of birth for the foreign-born population - Afghanistan (%)
Place of birth for the foreign-born population - Bangladesh (%)
Place of birth for the foreign-born population - India (%)
Place of birth for the foreign-born population - Iran (%)
Place of birth for the foreign-born population - Kazakhstan (%)
Place of birth for the foreign-born population - Nepal (%)
Place of birth for the foreign-born population - Pakistan (%)
Place of birth for the foreign-born population - Sri Lanka (%)
Place of birth for the foreign-born population - Uzbekistan (%)
Place of birth for the foreign-born population - Other South Central Asia (%)
Place of birth for the foreign-born population - Burma (%)
Place of birth for the foreign-born population - Cambodia (%)
Place of birth for the foreign-born population - Indonesia (%)
Place of birth for the foreign-born population - Laos (%)
Place of birth for the foreign-born population - Malaysia (%)
Place of birth for the foreign-born population - Philippines (%)
Place of birth for the foreign-born population - Singapore (%)
Place of birth for the foreign-born population - Thailand (%)
Place of birth for the foreign-born population - Vietnam (%)
Place of birth for the foreign-born population - Other South Eastern Asia (%)
Place of birth for the foreign-born population - Armenia (%)
Place of birth for the foreign-born population - Iraq (%)
Place of birth for the foreign-born population - Israel (%)
Place of birth for the foreign-born population - Jordan (%)
Place of birth for the foreign-born population - Kuwait (%)
Place of birth for the foreign-born population - Lebanon (%)
Place of birth for the foreign-born population - Saudi Arabia (%)
Place of birth for the foreign-born population - Syria (%)
Place of birth for the foreign-born population - Turkey (%)
Place of birth for the foreign-born population - Yemen (%)
Place of birth for the foreign-born population - Other Western Asia (%)
Place of birth for the foreign-born population - Eritrea (%)
Place of birth for the foreign-born population - Ethiopia (%)
Place of birth for the foreign-born population - Kenya (%)
Place of birth for the foreign-born population - Somalia (%)
Place of birth for the foreign-born population - Uganda (%)
Place of birth for the foreign-born population - Zimbabwe (%)
Place of birth for the foreign-born population - Other Eastern Africa (%)
Place of birth for the foreign-born population - Cameroon (%)
Place of birth for the foreign-born population - Congo (%)
Place of birth for the foreign-born population - Democratic Republic of Congo (Zaire) (%)
Place of birth for the foreign-born population - Other Middle Africa (%)
Place of birth for the foreign-born population - Egypt (%)
Place of birth for the foreign-born population - Morocco (%)
Place of birth for the foreign-born population - Sudan (%)
Place of birth for the foreign-born population - Other Northern Africa (%)
Place of birth for the foreign-born population - South Africa (%)
Place of birth for the foreign-born population - Other Southern Africa (%)
Place of birth for the foreign-born population - Cabo Verde (%)
Place of birth for the foreign-born population - Ghana (%)
Place of birth for the foreign-born population - Liberia (%)
Place of birth for the foreign-born population - Nigeria (%)
Place of birth for the foreign-born population - Senegal (%)
Place of birth for the foreign-born population - Sierra Leone (%)
Place of birth for the foreign-born population - Other Western Africa (%)
Place of birth for the foreign-born population - Australia (%)
Place of birth for the foreign-born population - New Zealand (%)
Place of birth for the foreign-born population - Fiji (%)
Place of birth for the foreign-born population - Micronesia (%)
Place of birth for the foreign-born population - Bahamas (%)
Place of birth for the foreign-born population - Barbados (%)
Place of birth for the foreign-born population - Cuba (%)
Place of birth for the foreign-born population - Dominica (%)
Place of birth for the foreign-born population - Dominican Republic (%)
Place of birth for the foreign-born population - Grenada (%)
Place of birth for the foreign-born population - Haiti (%)
Place of birth for the foreign-born population - Jamaica (%)
Place of birth for the foreign-born population - St. Vincent and the Grenadines (%)
Place of birth for the foreign-born population - Trinidad and Tobago (%)
Place of birth for the foreign-born population - West Indies (%)
Place of birth for the foreign-born population - Other Caribbean (%)
Place of birth for the foreign-born population - Belize (%)
Place of birth for the foreign-born population - Costa Rica (%)
Place of birth for the foreign-born population - El Salvador (%)
Place of birth for the foreign-born population - Guatemala (%)
Place of birth for the foreign-born population - Honduras (%)
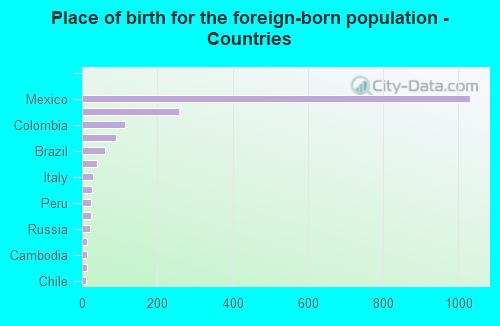
Place of birth for the foreign-born population - Mexico (%)
Place of birth for the foreign-born population - Nicaragua (%)
Place of birth for the foreign-born population - Panama (%)
Place of birth for the foreign-born population - Other Central America (%)
Place of birth for the foreign-born population - Argentina (%)
Place of birth for the foreign-born population - Bolivia (%)
Place of birth for the foreign-born population - Brazil (%)
Place of birth for the foreign-born population - Chile (%)
Place of birth for the foreign-born population - Colombia (%)
Place of birth for the foreign-born population - Ecuador (%)
Place of birth for the foreign-born population - Guyana (%)
Place of birth for the foreign-born population - Peru (%)
Place of birth for the foreign-born population - Uruguay (%)
Place of birth for the foreign-born population - Venezuela (%)
Place of birth for the foreign-born population - Other South America (%)
Place of birth for the foreign-born population - Canada (%)
Place of birth for the foreign-born population - Other Northern America (%)
Place of birth for the foreign-born population - Other (%)
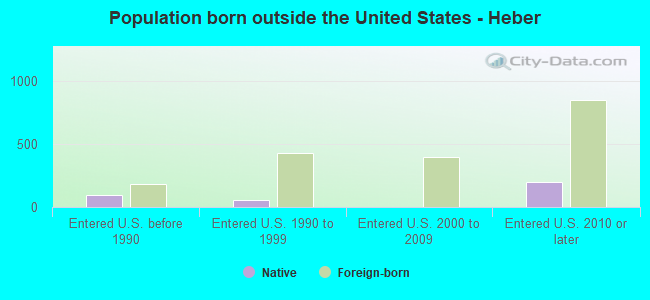
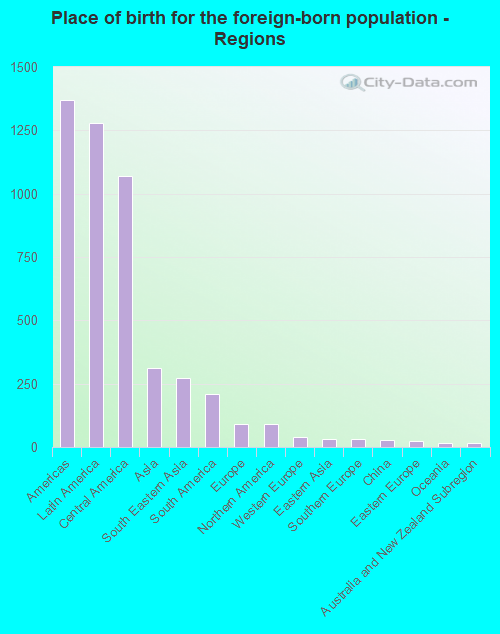
According to 2022 data, the most numerous races in Heber, UT are White alone (13,357 residents), Hispanic (3,060 residents), and Two or more races (463 residents). 82.0% of Heber residents speak English at home. 10.3% of Heber, UT residents are foreign-born (7.1% born in Latin America, 1.7% born in Asia), which is 22.0% greater than the foreign-born rate of 8.0% across the entire state of Utah.
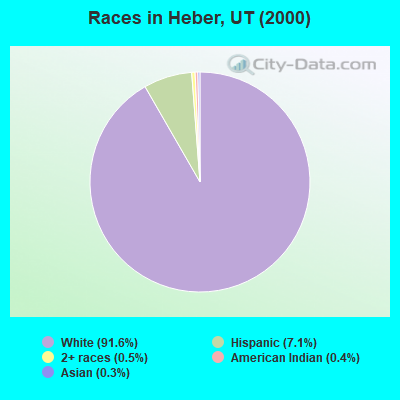
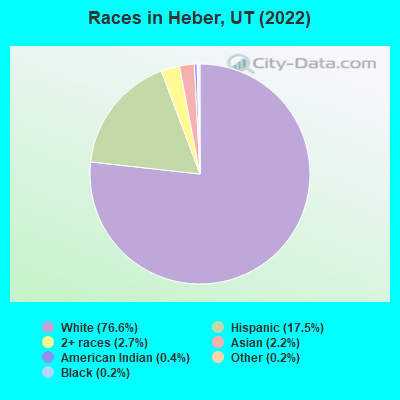
Race distribution in Heber
2000 2022
1,904,265 85.3% White alone 201,559 9.0% Hispanic 36,483 1.6% Asian alone 31,308 1.4% Two or more races 26,663 1.2% American Indian alone 14,806 0.7% Native Hawaiian and Other 16,137 0.7% Black alone 1,948 0.09% Other race alone
2,557,466 75.6% White alone 512,086 15.1% Hispanic 119,308 3.5% Two or more races 82,388 2.4% Asian alone 36,978 1.1% Native Hawaiian and Other 34,873 1.0% Black alone 22,803 0.7% American Indian alone 14,898 0.4% Other race alone
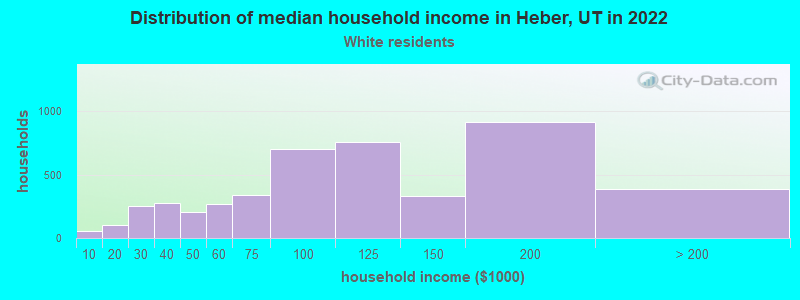
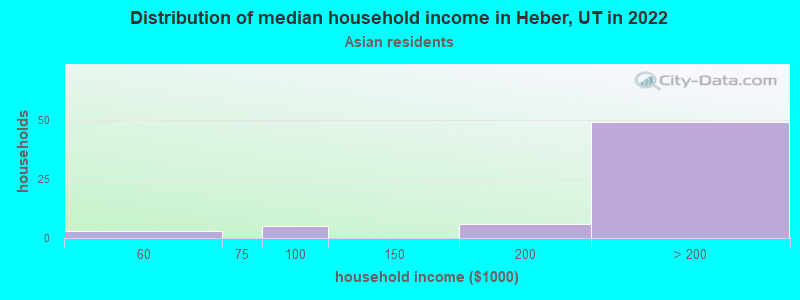
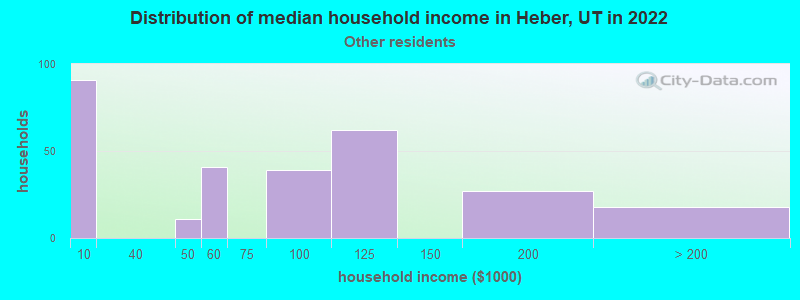
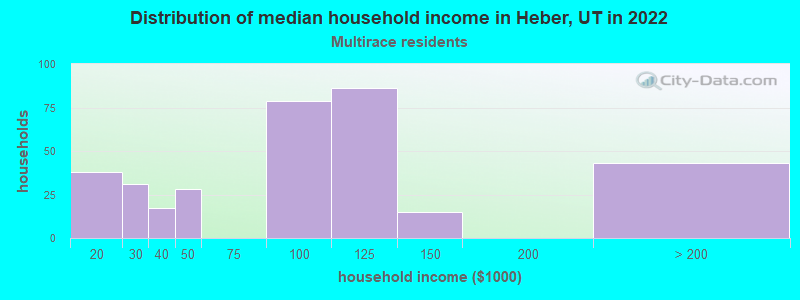
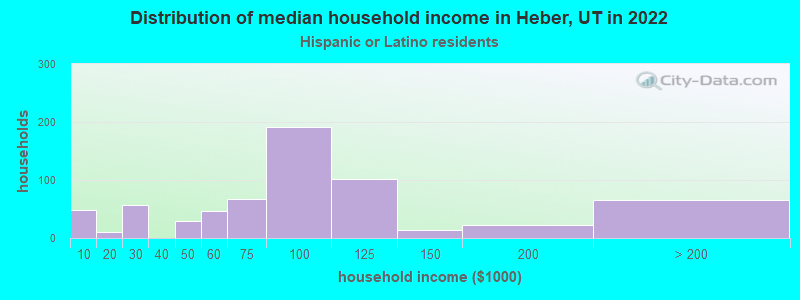
Income and house value in Heber Median household income in 2022 $106,026 White non-Hispanic householdersover $200,000 Asian householders$100,461 Some other race householders$78,702 Two or more races householders$81,166 Hispanic or Latino race householdersMedian 2022 house value $613,021 White Non-Hispanic householders$612,264 Some other race householders$532,041 Two or more races householders$552,854 Hispanic or Latino householders
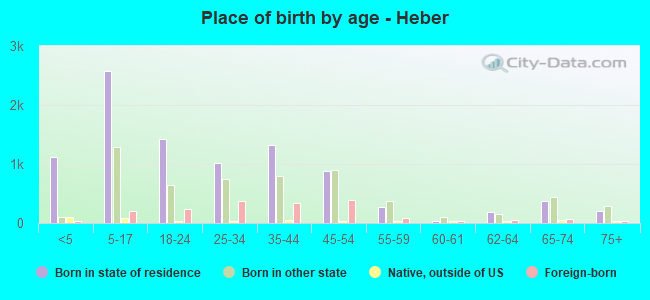
Median age by race in Heber
31.9 Median age for White residents33.2 30.1 26.5 Median age for Black or African American residents25.3 56.1 41.0 Median age for American Indian / Alaska Native residents41.6 -694,006,308.5 30.9 Median age for Asian residents22.9 34.0 -664,268,584.5 Median age for Native Hawaiian / Pacific Islander residents-659,420,289.2 -664,285,713.6 22.2 Median age for Other race residents21.9 20.5 20.3 Median age for Two or more races residents19.3 23.1 32.8 Median age for White alone residents32.7 32.7 22.4 Median age for Hispanic or Latino residents22.0 22.6
Owner/renter occupied households by race in Heber
House owners and renters - White residents 3,675 80.2% Owner occupied906 19.8% Renter occupiedHouse owners and renters - Black or African American residents 24 100.0% Owner occupiedHouse owners and renters - Asian residents 56 94.1% Owner occupied3 5.9% Renter occupiedHouse owners and renters - Other race residents 132 48.6% Owner occupied139 51.4% Renter occupiedHouse owners and renters - Two or more races residents 273 75.5% Owner occupied89 24.5% Renter occupiedHouse owners and renters - White alone residents 3,593 81.0% Owner occupied843 19.0% Renter occupiedHouse owners and renters - Hispanic or Latino residents 401 61.8% Owner occupied248 38.2% Renter occupied
Language usage in Heber
English speakers - Total 82.0% of residents of Heber speak English at home.
14.1% of residents speak Spanish at home 1,274 56.0% Speak English very well1,002 44.0% Speak English less than very well4.0% of residents speak other language at home 619 95.4% Speak English very well30 4.6% Speak English less than very well
English speakers - Born in the United States 92.4% of residents of Heber speak English at home.
6.3% of residents speak Spanish at home 299 82.1% Speak English very well65 17.9% Speak English less than very well1.2% of residents speak other language at home 72 100.0% Speak English very well
English speakers - Native, born elsewhere 68.4% of residents of Heber speak English at home.
19.0% of residents speak Spanish at home 32 68.1% Speak English very well15 31.9% Speak English less than very well10.5% of residents speak other language at home 26 100.0% Speak English very well
English speakers - Foreign-born 11.0% of residents of Heber speak English at home.
63.2% of residents speak Spanish at home 470 41.9% Speak English very well652 58.1% Speak English less than very well24.5% of residents speak other language at home 409 93.8% Speak English very well27 6.2% Speak English less than very well
White (Caucasian) - Speak only English Native:
96.3% (12,086)Foreign-born:
22.6% (129)
White (Caucasian) - Speak another language Native:
3.9% (484)Foreign-born:
72.3% (411)
Black or African American - Speak another language Native:
66.7% (34)Foreign-born:
94.1% (60)
Asian - Speak only English Native:
90.5% (16)Foreign-born:
4.8% (15)
Other race - Speak only English Native:
27.7% (192)Foreign-born:
8.7% (38)
Other race - Speak another language Native:
73.3% (506)Foreign-born:
91.3% (400)
Two or more races - Speak only English Native:
62.4% (563)Foreign-born:
5.5% (12)
Two or more races - Speak another language Native:
39.2% (354)Foreign-born:
96.2% (216)
White alone - Speak only English Native:
97.3% (11,991)Foreign-born:
57.7% (111)
White alone - Speak another language Native:
2.8% (341)Foreign-born:
42.9% (82)
Hispanic or Latino - Speak only English Native:
34.1% (491)Foreign-born:
5.9% (72)
Hispanic or Latino - Speak another language Native:
65.1% (937)Foreign-born:
94.0% (1,162)
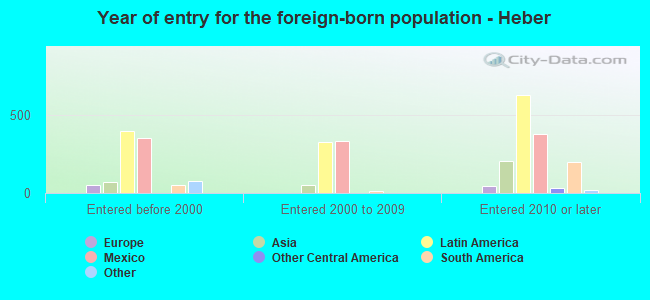
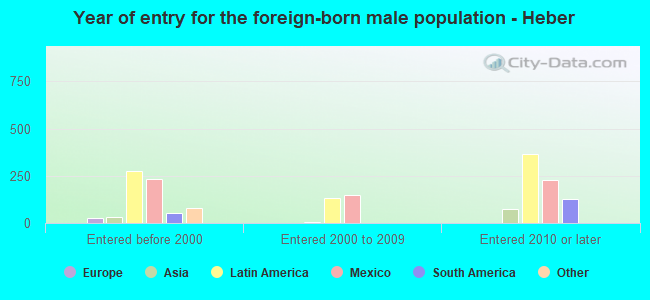
Foreign-born residents in Heber 1,789 residents are foreign born (7.1% Latin America , 1.7% Asia ).
Marital status for residents in Heber Marital status - White (Caucasian) population 15 years and over
Males 26.6% Never married61.7% Now married0.5% Separated2.0% Widowed9.3% DivorcedFemales 24.6% Never married59.2% Now married1.1% Separated5.4% Widowed9.6% DivorcedWomen who gave birth in the past 12 months Now married:
82.1% (207)Unmarried:
17.9% (45)
Women who did not give birth in the past 12 months Now married:
62.5% (2,169)Unmarried:
37.5% (1,301)
Marital status - Black or African American population 15 years and over
Males 100.0% Never married0.0% Now married0.0% Separated0.0% Widowed0.0% DivorcedFemales 34.3% Never married35.7% Now married30.0% Separated0.0% Widowed0.0% DivorcedWomen who did not give birth in the past 12 months Now married:
0.0% (0)Unmarried:
100.0% (27)
Marital status - American Indian / Alaska Native population 15 years and over
Males 10.8% Never married89.2% Now married0.0% Separated0.0% Widowed0.0% DivorcedFemales 0.0% Never married0.0% Now married100.0% Separated0.0% Widowed0.0% DivorcedMarital status - Asian population 15 years and over
Males 21.6% Never married71.6% Now married6.8% Separated0.0% Widowed0.0% DivorcedFemales 20.0% Never married78.4% Now married0.0% Separated0.0% Widowed1.6% DivorcedWomen who did not give birth in the past 12 months Now married:
64.3% (80)Unmarried:
35.7% (44)
Marital status - Other race population 15 years and over
Males 56.8% Never married39.1% Now married0.0% Separated0.0% Widowed4.1% DivorcedFemales 58.3% Never married29.0% Now married0.0% Separated4.6% Widowed8.1% DivorcedWomen who gave birth in the past 12 months Now married:
0.0% (0)Unmarried:
100.0% (49)
Women who did not give birth in the past 12 months Now married:
22.0% (65)Unmarried:
78.0% (232)
Marital status - Two or more races population 15 years and over
Males 51.3% Never married40.2% Now married0.0% Separated0.0% Widowed8.5% DivorcedFemales 39.2% Never married48.0% Now married7.0% Separated0.0% Widowed5.7% DivorcedWomen who gave birth in the past 12 months Now married:
0.0% (0)Unmarried:
100.0% (32)
Women who did not give birth in the past 12 months Now married:
48.3% (183)Unmarried:
51.7% (196)
Marital status - White alone, not Hispanic / Latino population 15 years and over
Males 26.9% Never married61.6% Now married0.5% Separated2.1% Widowed8.9% DivorcedFemales 21.3% Never married61.7% Now married1.2% Separated5.7% Widowed10.2% DivorcedWomen who gave birth in the past 12 months Now married:
80.0% (184)Unmarried:
20.0% (46)
Women who did not give birth in the past 12 months Now married:
66.7% (2,079)Unmarried:
33.3% (1,037)
Marital status - Hispanic or Latino population 15 years and over
Males 47.8% Never married45.3% Now married0.0% Separated0.0% Widowed6.9% DivorcedFemales 54.5% Never married30.9% Now married4.6% Separated3.1% Widowed6.9% DivorcedWomen who gave birth in the past 12 months Now married:
28.7% (29)Unmarried:
71.3% (71)
Women who did not give birth in the past 12 months Now married:
30.5% (265)Unmarried:
69.5% (603)
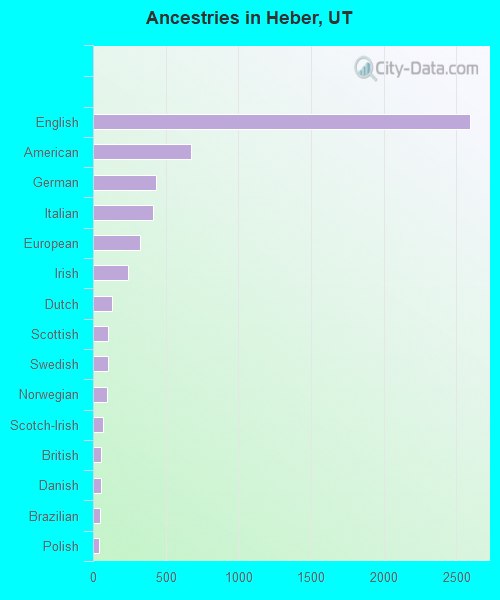
Ancestries in Heber
2,596 33.4% English675 8.7% American432 5.6% German411 5.3% Italian323 4.2% European243 3.1% Irish129 1.7% Dutch106 1.4% Scottish101 1.3% Swedish99 1.3% Norwegian66 0.8% Scotch-Irish52 0.7% British52 0.7% Danish46 0.6% Brazilian44 0.6% Polish21 0.3% French20 0.3% Russian19 0.2% Croatian19 0.2% Swiss17 0.2% Austrian13 0.2% Arab12 0.2% French Canadian7 0.09% Scandinavian6 0.08% Lebanese3 0.04% Romanian2 0.03% Canadian
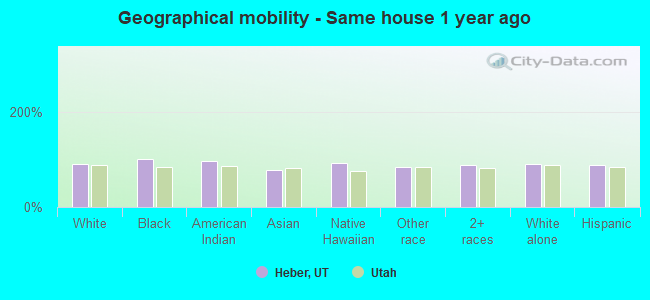
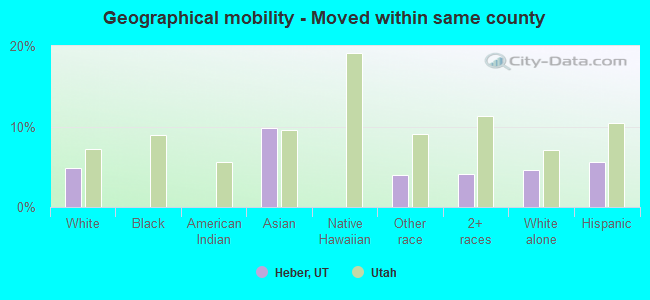
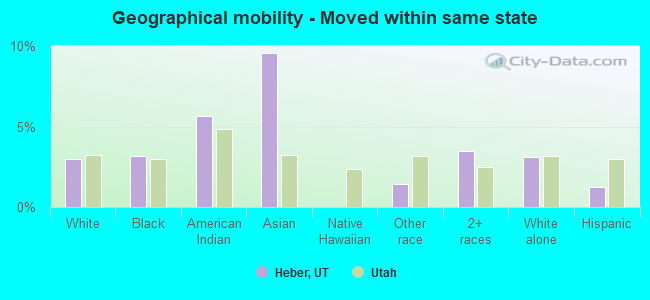
Geographical mobility in Heber Same house 1 year ago 12,621 89.9% White (Caucasian)125 100.0% Black or African American68 95.8% American Indian / Alaska Native279 77.6% Asian3 92.6% Native Hawaiian / Pacific Islander1,032 83.0% Other race1,050 86.5% Two or more races11,848 89.8% White alone, not Hispanic / Latino2,553 87.0% Hispanic or LatinoMoved within same county 684 4.9% White / Caucasian35 9.8% Asian49 3.9% Other race50 4.1% Two or more races606 4.6% White alone, not Hispanic / Latino166 5.6% Hispanic or LatinoMoved within same state 416 3.0% White / Caucasian4 3.2% Black or African American4 5.6% American Indian / Alaska Native34 9.6% Asian17 1.4% Other race42 3.5% Two or more races412 3.1% White alone, not Hispanic / Latino36 1.2% Hispanic or LatinoMoved from different state 331 2.4% White / Caucasian48 3.9% Two or more races341 2.6% White alone, not Hispanic / Latino33 1.1% Hispanic or LatinoMoved from abroad 36 0.3% White13 3.7% Asian216 17.4% Other race13 1.1% Two or more races37 0.3% White alone, not Hispanic / Latino201 6.9% Hispanic or Latino
Children Nativity (place of birth) in Heber
Children under 6 years - Living with two parents Both parents native 815 99.8% Native2 0.2% Foreign-bornBoth parents foreign-born 73 71.7% Native29 28.3% Foreign-bornOne native, one foreign-born parent 298 100.0% NativeChildren under 6 years - Living with one parent Native parent 297 100.0% NativeForeign-born parent 2 100.0% NativeChildren 6 to 17 years - Living with two parents Both parents native 2,690 100.0% NativeBoth parents foreign-born 220 74.3% Native76 25.7% Foreign-bornOne native, one foreign-born parent 271 89.0% Native33 11.0% Foreign-bornChildren 6 to 17 years - Living with one parent Native parent 397 100.0% NativeForeign-born parent 159 50.7% Native154 49.3% Foreign-born
Grandparents responsible for own grandchildren in Heber
Grandparents (30 to 59 years) White / Caucasian 17 40.9% Responsible for grandchildren25 59.1% Not responsible for grandchildrenOther race 4 100.0% Not responsible for grandchildrenWhite alone, not Hispanic / Latino 19 42.1% Responsible for grandchildren26 57.9% Not responsible for grandchildrenHispanic or Latino 5 100.0% Not responsible for grandchildrenGrandparents (60 years and over) White / Caucasian 26 13.7% Responsible for grandchildren162 86.3% Not responsible for grandchildrenWhite alone, not Hispanic / Latino 26 13.3% Responsible for grandchildren168 86.7% Not responsible for grandchildren