Races in Helena, Montana (MT) Detailed Stats
Ancestries, Foreign-born residents, place of birth
Settings
X


Recent posts about races in Helena, Montana on our local forum with over 2,400,000 registered users:
 | East Helena (5 replies) |
| Finding land and subdivisions for mixed-race couple (11 replies) |
| Montana: moving to Helena MT (10 replies) |
| Interesting read for those who want to move to Montana (47 replies) |
| A Different Perspective (20 replies) |
| Possible move from VT to Montana: rural towns near skiing? (31 replies) |
Latest news about races in Helena, MT collected exclusively by city-data.com from local newspapers, TV, and radio stations
According to 2022 data, the most numerous races in Helena, MT are White alone (29,076 residents), American Indian alone (425 residents), and Two or more races (1,615 residents). 95.9% of Helena residents speak English at home. 1.8% of Helena, MT residents are foreign-born , which is 13.9% less than the foreign-born rate of 2.0% across the entire state of Montana.
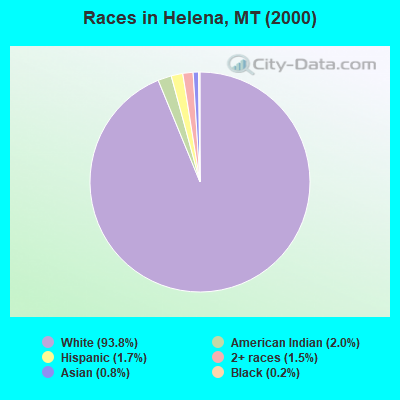
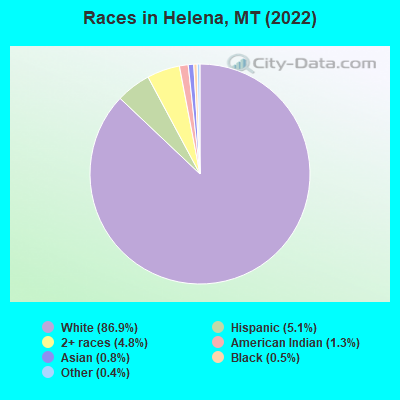
Race distribution in Helena
2000
2022

- 24,19193.8%White alone
- 5042.0%American Indian alone
- 4301.7%Hispanic
- 3741.5%Two or more races
- 1990.8%Asian alone
- 560.2%Black alone
- 170.07%Native Hawaiian and Other
Pacific Islander alone - 90.03%Other race alone
-
- 29,07686.9%White alone
- 1,6915.1%Hispanic
- 1,6154.8%Two or more races
- 4251.3%American Indian alone
- 2620.8%Asian alone
- 1770.5%Black alone
- 1380.4%Other race alone
2000
2022
-
- 807,82389.5%White alone
- 54,4266.0%American Indian alone
- 18,0812.0%Hispanic
- 13,7681.5%Two or more races
- 4,5690.5%Asian alone
- 2,5340.3%Black alone
- 5690.06%Other race alone
- 4250.05%Native Hawaiian and Other
Pacific Islander alone

-
- 937,36583.5%White alone
- 58,7485.2%American Indian alone
- 55,1724.9%Two or more races
- 49,8304.4%Hispanic
- 9,0120.8%Other race alone
- 7,7000.7%Asian alone
- 3,4280.3%Black alone
- 1,6120.1%Native Hawaiian and Other
Pacific Islander alone

Income and house value in Helena
- Median household income in 2022
- $64,185White non-Hispanic householders
- $58,575Black householders
- $102,513Asian householders
- $47,263Some other race householders
- $96,078Two or more races householders
- $98,134Hispanic or Latino race householders
- Median 2022 house value
- $404,051White Non-Hispanic householders
- $247,494Black or African American householders
- $453,264American Indian or Alaska Native householders
- $298,848Asian householders
- $356,620Two or more races householders
- $338,789Hispanic or Latino householders
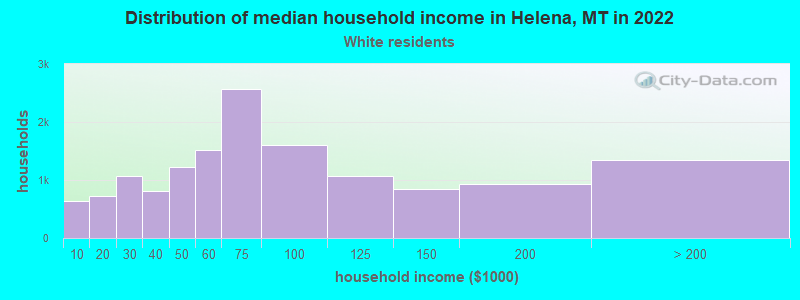
Household income for White non-Hispanic householders
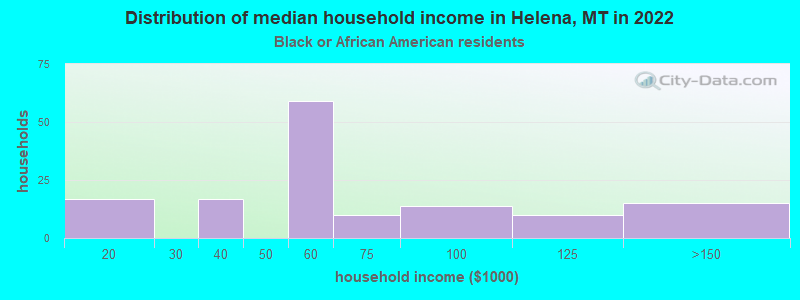
Household income for Black householders
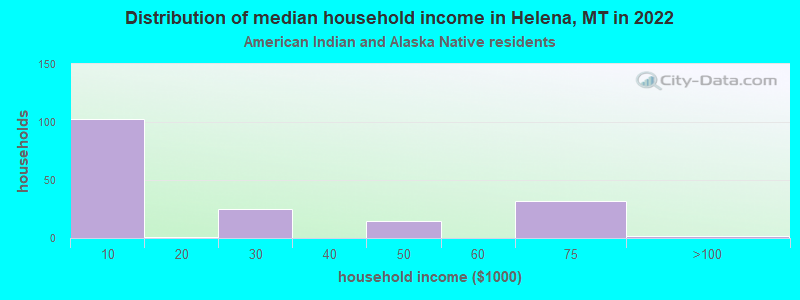
Household income for American Indian and Alaska Native householders
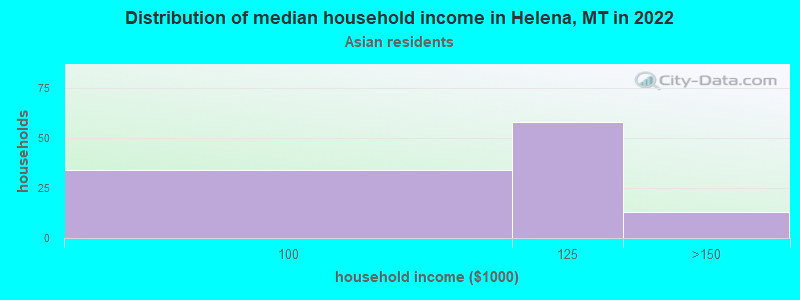
Household income for Asian householders
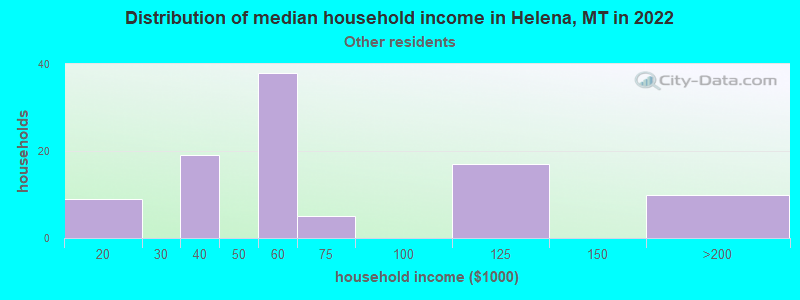
Household income for Some other race householders
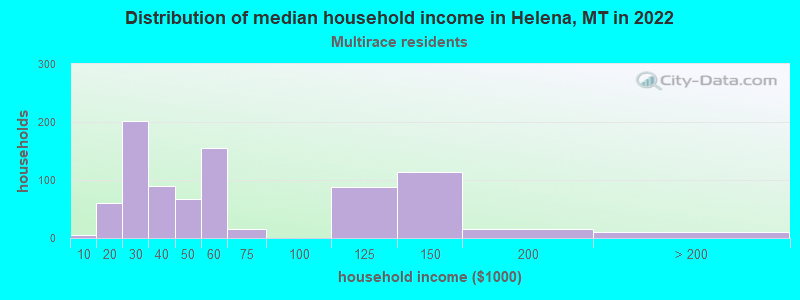
Household income for Two or more races householders
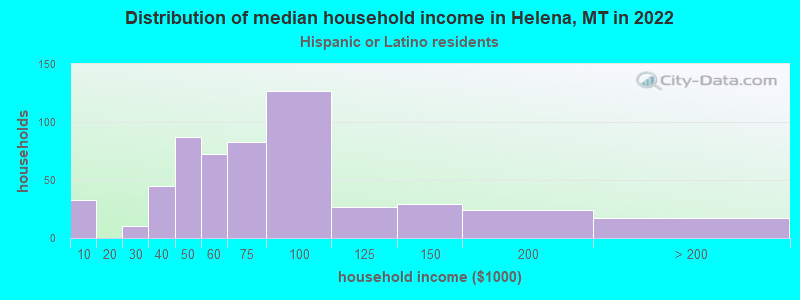
Household income for Hispanic or Latino race householders
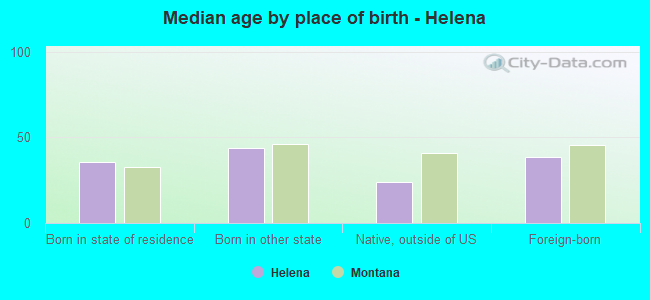
Median age by race in Helena
- 39.6Median age for White residents
- 36.8Males
- 42.6Females
- 51.0Median age for Black or African American residents
- 37.4Males
- 62.7Females
- 56.9Median age for American Indian / Alaska Native residents
- 23.3Males
- 60.7Females
- 46.8Median age for Asian residents
- 49.5Males
- 42.8Females
- -666,666,666.0Median age for Native Hawaiian / Pacific Islander residents
- -666,666,666.0Males
- -666,666,666.0Females
- 33.5Median age for Other race residents
- 40.5Males
- 25.0Females
- 35.9Median age for Two or more races residents
- 30.5Males
- 47.0Females
- 40.5Median age for White alone residents
- 37.1Males
- 43.4Females
- 22.7Median age for Hispanic or Latino residents
- 23.5Males
- 23.0Females
Owner/renter occupied households by race in Helena
- House owners and renters - White residents
- 7,67452.4%Owner occupied
- 6,98047.6%Renter occupied
- House owners and renters - Black or African American residents
- 2418.7%Owner occupied
- 10481.3%Renter occupied
- House owners and renters - American Indian / Alaska Native residents
- 169100.0%Renter occupied
- House owners and renters - Asian residents
- 5958.8%Owner occupied
- 4141.2%Renter occupied
- House owners and renters - Other race residents
- 2732.2%Owner occupied
- 5867.8%Renter occupied
- House owners and renters - Two or more races residents
- 35056.1%Owner occupied
- 27543.9%Renter occupied
- House owners and renters - White alone residents
- 7,51753.2%Owner occupied
- 6,60046.8%Renter occupied
- House owners and renters - Hispanic or Latino residents
- 34050.5%Owner occupied
- 33449.5%Renter occupied
Language usage in Helena
- English speakers - Total
- 95.9% of residents of Helena speak English at home.
- 1.1% of residents speak Spanish at home
- 31292.0%Speak English very well
- 278.0%Speak English less than very well
- 3.0% of residents speak other language at home
- 71375.2%Speak English very well
- 23524.8%Speak English less than very well
- English speakers - Born in the United States
- 97.4% of residents of Helena speak English at home.
- 1.3% of residents speak Spanish at home
- 19595.1%Speak English very well
- 104.9%Speak English less than very well
- 1.0% of residents speak other language at home
- 156100.0%Speak English very well
- English speakers - Native, born elsewhere
- 84.2% of residents of Helena speak English at home.
- 4.3% of residents speak Spanish at home
- 9100.0%Speak English very well
- 6.2% of residents speak other language at home
- 13100.0%Speak English very well
- English speakers - Foreign-born
- 39.4% of residents of Helena speak English at home.
- 11.4% of residents speak Spanish at home
- 5477.1%Speak English very well
- 1622.9%Speak English less than very well
- 45.4% of residents speak other language at home
- 18867.4%Speak English very well
- 9132.6%Speak English less than very well
White (Caucasian) - Speak only English
| Native: | 97.7% (28,257) |
| Foreign-born: | 62.3% (153) |
White (Caucasian) - Speak another language
| Native: | 2.2% (630) |
| Foreign-born: | 38.6% (95) |
Black or African American - Speak only English
| Native: | 100.0% (263) |
| Foreign-born: | 97.4% (31) |
Asian - Speak only English
| Native: | 100.0% (45) |
| Foreign-born: | 3.4% (6) |
Other race - Speak only English
| Native: | 78.0% (138) |
| Foreign-born: | 43.6% (18) |
Other race - Speak another language
| Native: | 22.2% (39) |
| Foreign-born: | 62.3% (26) |
Two or more races - Speak only English
| Native: | 97.7% (1,727) |
| Foreign-born: | 60.7% (28) |
White alone - Speak only English
| Native: | 98.7% (27,523) |
| Foreign-born: | 67.7% (153) |
White alone - Speak another language
| Native: | 1.2% (323) |
| Foreign-born: | 33.3% (75) |
Hispanic or Latino - Speak only English
| Native: | 82.0% (1,146) |
| Foreign-born: | 17.6% (16) |
Hispanic or Latino - Speak another language
| Native: | 17.7% (247) |
| Foreign-born: | 79.2% (71) |
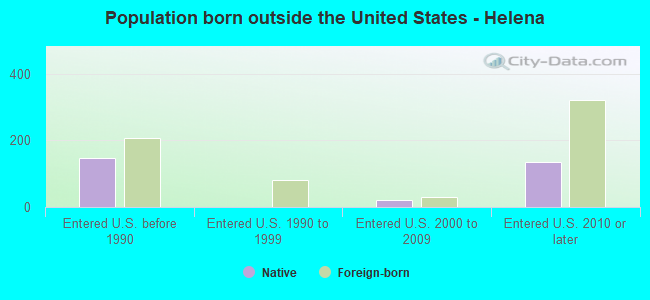
Foreign-born residents in Helena
590 residents are foreign born
| This city: | 1.8% |
| Montana: | 2.3% |

Marital status for residents in Helena
Marital status - White (Caucasian) population 15 years and over
- Males
- 34.5%Never married
- 45.8%Now married
- 1.2%Separated
- 3.3%Widowed
- 15.3%Divorced
- Females
- 27.1%Never married
- 39.7%Now married
- 1.0%Separated
- 10.4%Widowed
- 21.8%Divorced
Women who gave birth in the past 12 months
| Now married: | 91.3% (335) |
| Unmarried: | 8.7% (32) |
Women who did not give birth in the past 12 months
| Now married: | 35.8% (2,437) |
| Unmarried: | 64.2% (4,366) |
Marital status - Black or African American population 15 years and over
- Males
- 58.9%Never married
- 41.1%Now married
- 0.0%Separated
- 0.0%Widowed
- 0.0%Divorced
- Females
- 36.0%Never married
- 38.7%Now married
- 0.0%Separated
- 0.0%Widowed
- 25.2%Divorced
Women who did not give birth in the past 12 months
| Now married: | 35.9% (8) |
| Unmarried: | 64.1% (15) |
Marital status - American Indian / Alaska Native population 15 years and over
- Males
- 72.6%Never married
- 4.5%Now married
- 0.0%Separated
- 0.0%Widowed
- 22.9%Divorced
- Females
- 39.4%Never married
- 6.1%Now married
- 0.0%Separated
- 4.0%Widowed
- 50.5%Divorced
Women who gave birth in the past 12 months
| Now married: | 0.0% (0) |
| Unmarried: | 100.0% (2) |
Women who did not give birth in the past 12 months
| Now married: | 19.7% (11) |
| Unmarried: | 80.3% (47) |
Marital status - Asian population 15 years and over
- Males
- 35.6%Never married
- 64.4%Now married
- 0.0%Separated
- 0.0%Widowed
- 0.0%Divorced
- Females
- 28.1%Never married
- 71.9%Now married
- 0.0%Separated
- 0.0%Widowed
- 0.0%Divorced
Women who did not give birth in the past 12 months
| Now married: | 60.0% (52) |
| Unmarried: | 40.0% (35) |
Marital status - Other race population 15 years and over
- Males
- 35.1%Never married
- 19.3%Now married
- 0.0%Separated
- 0.0%Widowed
- 45.6%Divorced
- Females
- 35.8%Never married
- 38.9%Now married
- 0.0%Separated
- 0.0%Widowed
- 25.3%Divorced
Women who did not give birth in the past 12 months
| Now married: | 40.7% (53) |
| Unmarried: | 59.3% (77) |
Marital status - Two or more races population 15 years and over
- Males
- 68.2%Never married
- 29.8%Now married
- 0.0%Separated
- 0.0%Widowed
- 2.0%Divorced
- Females
- 47.3%Never married
- 24.5%Now married
- 0.0%Separated
- 19.0%Widowed
- 9.2%Divorced
Women who did not give birth in the past 12 months
| Now married: | 17.2% (83) |
| Unmarried: | 82.8% (401) |
Marital status - White alone, not Hispanic / Latino population 15 years and over
- Males
- 34.5%Never married
- 46.0%Now married
- 1.2%Separated
- 3.3%Widowed
- 15.0%Divorced
- Females
- 26.6%Never married
- 39.7%Now married
- 1.0%Separated
- 10.6%Widowed
- 22.1%Divorced
Women who gave birth in the past 12 months
| Now married: | 91.3% (332) |
| Unmarried: | 8.7% (32) |
Women who did not give birth in the past 12 months
| Now married: | 35.8% (2,305) |
| Unmarried: | 64.2% (4,136) |
Marital status - Hispanic or Latino population 15 years and over
- Males
- 48.8%Never married
- 31.3%Now married
- 0.0%Separated
- 0.0%Widowed
- 19.8%Divorced
- Females
- 49.0%Never married
- 36.9%Now married
- 2.0%Separated
- 2.5%Widowed
- 9.6%Divorced
Women who did not give birth in the past 12 months
| Now married: | 32.0% (136) |
| Unmarried: | 68.0% (288) |
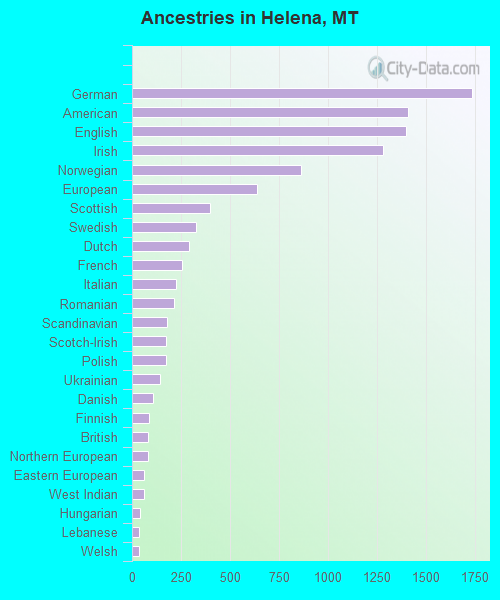
Ancestries in Helena

- 1,73713.4%German
- 1,41010.8%American
- 1,39910.8%English
- 1,2839.9%Irish
- 8616.6%Norwegian
- 6384.9%European
- 4003.1%Scottish
- 3272.5%Swedish
- 2932.3%Dutch
- 2572.0%French
- 2231.7%Italian
- 2161.7%Romanian
- 1811.4%Scandinavian
- 1741.3%Scotch-Irish
- 1741.3%Polish
- 1421.1%Ukrainian
- 1050.8%Danish
- 870.7%Finnish
- 840.6%British
- 830.6%Northern European
- 630.5%Eastern European
- 610.5%West Indian
- 410.3%Hungarian
- 380.3%Lebanese
- 350.3%Welsh
- 310.2%Jamaican
- 290.2%Swiss
- 280.2%Czech
- 230.2%Iranian
- 220.2%Russian
- 190.1%Belgian
- 190.1%French Canadian
- 180.1%Slavic
- 160.1%Armenian
- 160.1%Brazilian
- 150.1%Slovene
- 140.1%Portuguese
- 120.09%Slovak
- 100.08%Macedonian
- 80.06%Basque
- 40.03%Croatian
- 30.02%Canadian
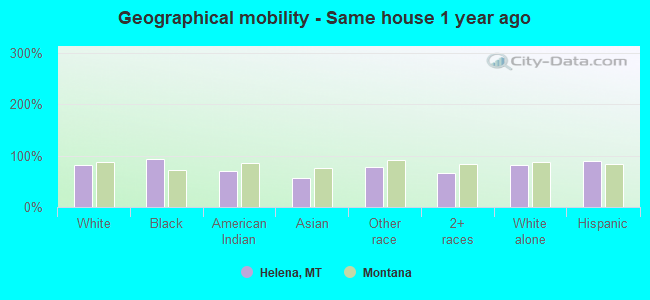
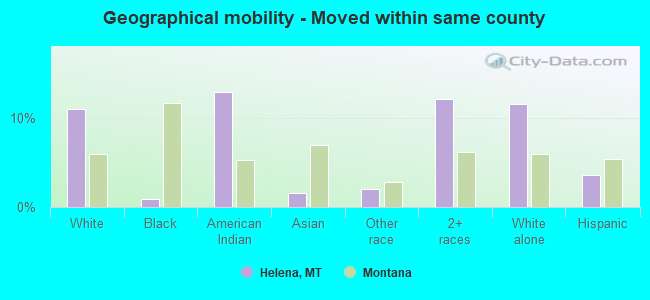
Geographical mobility in Helena

- Same house 1 year ago
- 24,92782.5%White (Caucasian)
- 27693.8%Black or African American
- 30571.0%American Indian / Alaska Native
- 17755.9%Asian
- 19578.1%Other race
- 1,24867.1%Two or more races
- 23,63181.7%White alone, not Hispanic / Latino
- 1,51890.1%Hispanic or Latino
-
- Moved within same county
- 3,30610.9%White / Caucasian
- 30.9%Black or African American
- 5512.8%American Indian / Alaska Native
- 51.5%Asian
- 52.0%Other race
- 22512.1%Two or more races
- 3,34411.6%White alone, not Hispanic / Latino
- 593.5%Hispanic or Latino
-
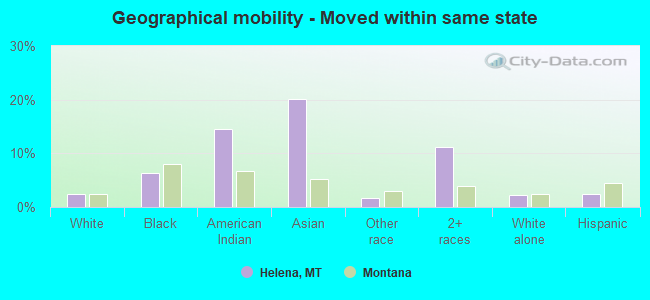
- Moved within same state
- 7032.3%White / Caucasian
- 186.3%Black or African American
- 6314.6%American Indian / Alaska Native
- 6420.1%Asian
- 41.8%Other race
- 20611.1%Two or more races
- 6622.3%White alone, not Hispanic / Latino
- 412.4%Hispanic or Latino
-
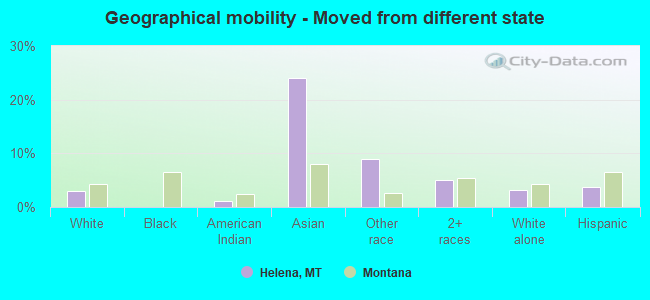
- Moved from different state
- 9073.0%White / Caucasian
- 51.0%American Indian / Alaska Native
- 7624.0%Asian
- 229.0%Other race
- 945.0%Two or more races
- 9063.1%White alone, not Hispanic / Latino
- 633.7%Hispanic or Latino
-
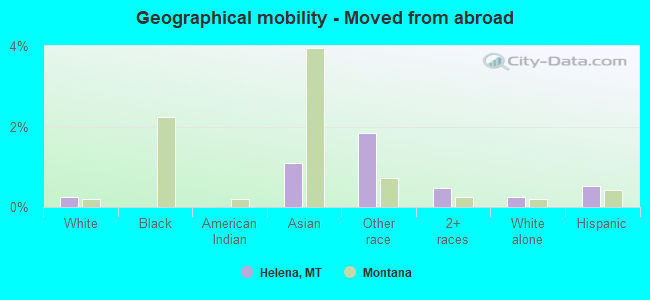
- Moved from abroad
- 720.2%White
- 31.1%Asian
- 51.8%Other race
- 90.5%Two or more races
- 720.2%White alone, not Hispanic / Latino
- 90.5%Hispanic or Latino
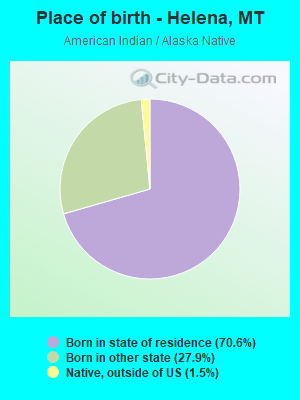
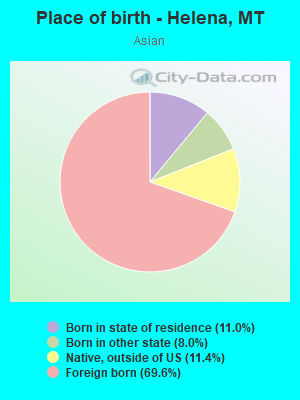
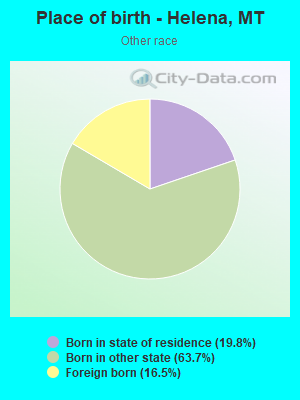
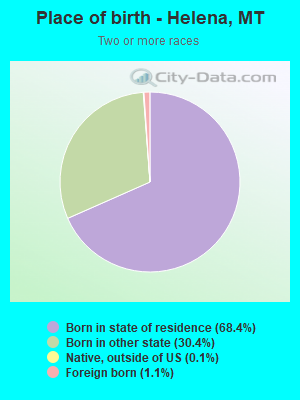
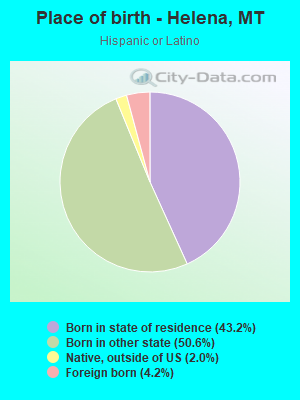
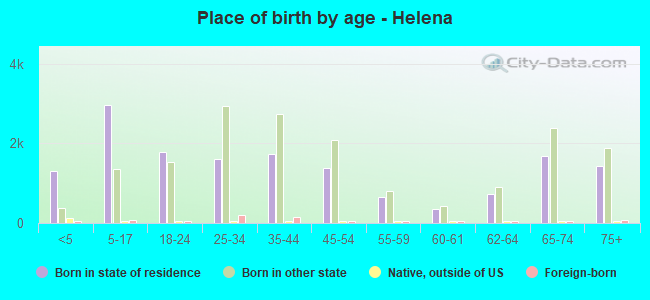
Children Nativity (place of birth) in Helena
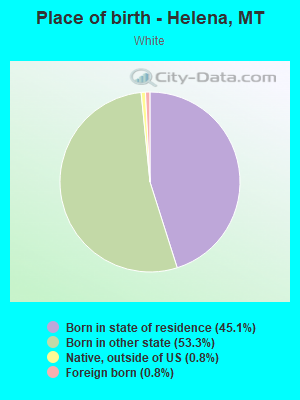
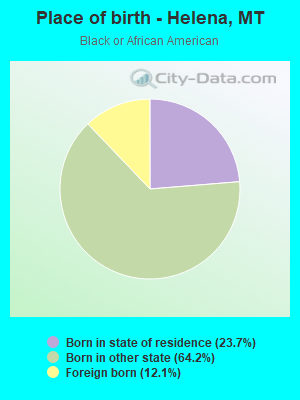
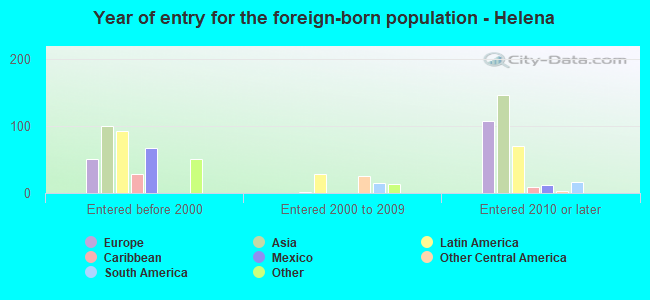
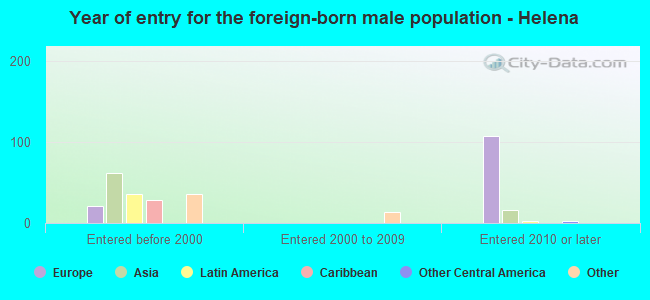
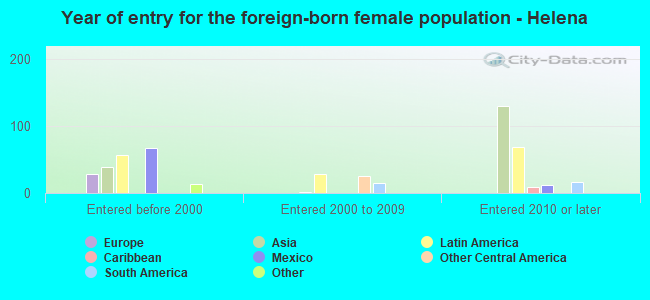
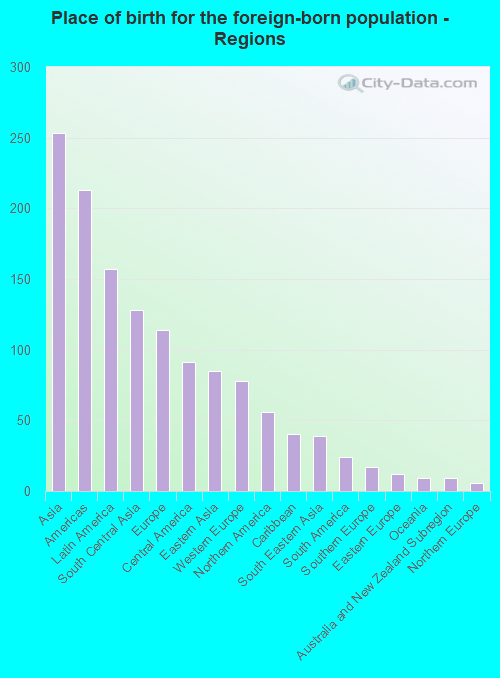
Place of birth for residents in Helena
![Place of birth for the foreign-born population - Regions]()
- 253Asia
- 213Americas
- 157Latin America
- 128South Central Asia
- 114Europe
- 91Central America
- 85Eastern Asia
- 78Western Europe
- 56Northern America
- 40Caribbean
- 39South Eastern Asia
- 24South America
- 17Southern Europe
- 12Eastern Europe
- 9Oceania
- 9Australia and New Zealand Subregion
- 6Northern Europe
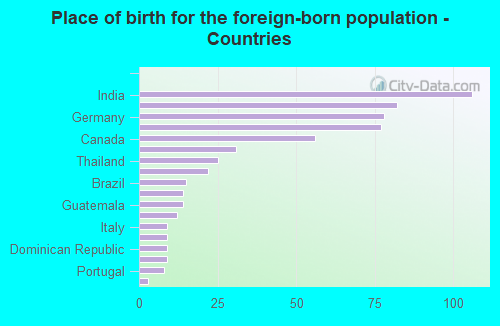
![Place of birth for the foreign-born population - Countries]()
- 106India
- 82Korea
- 78Germany
- 77Mexico
- 56Canada
- 31Jamaica
- 25Thailand
- 22Iran
- 15Brazil
- 14Vietnam
- 14Guatemala
- 12Russia
- 9Italy
- 9Australia
- 9Dominican Republic
- 9Colombia
- 8Portugal
- 3Japan
Grandparents responsible for own grandchildren in Helena
Zip codes: 59602.