Races in Hollis, Maine (ME) Detailed Stats
Ancestries, Foreign-born residents, place of birth
1.0% of Hollis, ME residents are foreign-born , which is 208.6% less than the foreign-born rate of 3.0% across the entire state of Maine.
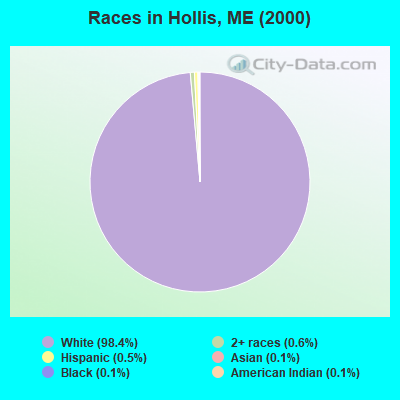
Race distribution in Hollis

- 4,04798.4%White alone
- 230.6%Two or more races
- 220.5%Hispanic
- 50.1%Black alone
- 60.1%Asian alone
- 50.1%American Indian alone
- 40.10%Native Hawaiian and Other
Pacific Islander alone - 20.05%Other race alone
2000
2022
-
- 1,230,29796.5%White alone
- 11,7310.9%Two or more races
- 9,3600.7%Hispanic
- 9,0140.7%Asian alone
- 6,4400.5%Black alone
- 6,9110.5%American Indian alone
- 8360.07%Other race alone
- 3340.03%Native Hawaiian and Other
Pacific Islander alone

-
- 1,249,23390.2%White alone
- 58,3574.2%Two or more races
- 28,7172.1%Hispanic
- 21,5831.6%Black alone
- 16,1511.2%Asian alone
- 5,8730.4%Other race alone
- 5,2050.4%American Indian alone
- 2210.02%Native Hawaiian and Other
Pacific Islander alone

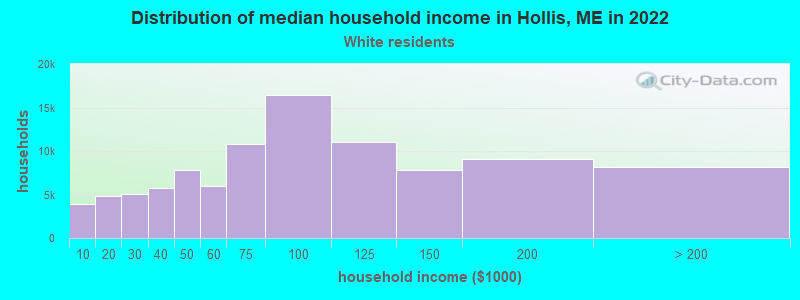
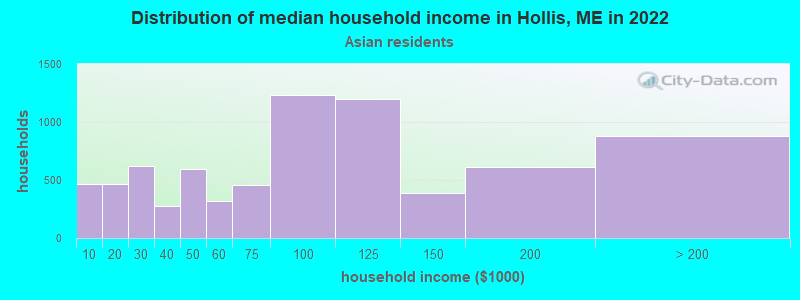
Income and house value in Hollis
- Median household income in 2022
- $92,074White non-Hispanic householders
- $124,756Asian householders
- Median 2022 house value
- $353,272White Non-Hispanic householders
Household income for White non-Hispanic householders
Household income for Asian householders
Foreign-born residents in Hollis
40 residents are foreign born
| This city: | 1.0% |
| Maine: | 2.9% |
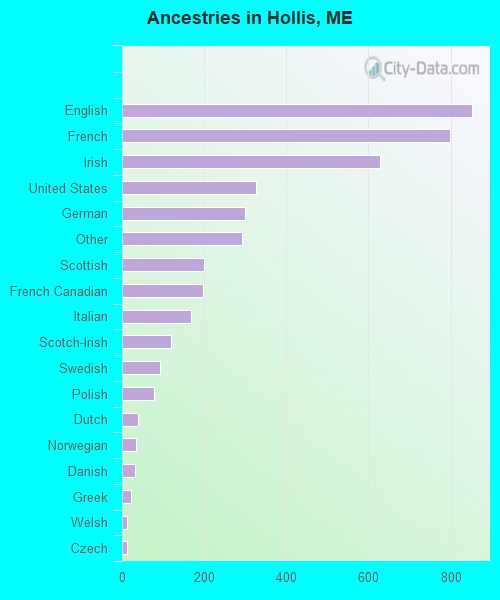
Ancestries in Hollis

- 85120.1%English
- 79818.9%French
- 62714.8%Irish
- 3277.7%United States
- 3007.1%German
- 2936.9%Other
- 2004.7%Scottish
- 1984.7%French Canadian
- 1674.0%Italian
- 1192.8%Scotch-Irish
- 922.2%Swedish
- 781.8%Polish
- 390.9%Dutch
- 350.8%Norwegian
- 320.8%Danish
- 210.5%Greek
- 120.3%Welsh
- 110.3%Czech
- 70.2%Portuguese
- 70.2%West Indian
- 60.1%Russian
- 60.1%Ukrainian
Zip codes: 04042.