Races in Hopewell, New York (NY) Detailed Stats
Ancestries, Foreign-born residents, place of birth
1.9% of Hopewell, NY residents are foreign-born , which is 1087.3% less than the foreign-born rate of 22.0% across the entire state of New York.
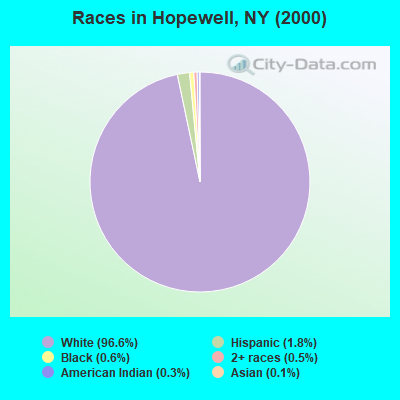
Race distribution in Hopewell

- 3,23196.6%White alone
- 611.8%Hispanic
- 210.6%Black alone
- 170.5%Two or more races
- 100.3%American Indian alone
- 40.1%Asian alone
- 10.03%Other race alone
- 10.03%Native Hawaiian and Other
Pacific Islander alone
2000
2022
-
- 11,760,98162.0%White alone
- 2,867,58315.1%Hispanic
- 2,812,62314.8%Black alone
- 1,035,9265.5%Asian alone
- 366,1161.9%Two or more races
- 75,4990.4%Other race alone
- 52,4990.3%American Indian alone
- 5,2300.03%Native Hawaiian and Other
Pacific Islander alone

-
- 10,408,93352.9%White alone
- 3,867,29919.7%Hispanic
- 2,633,84013.4%Black alone
- 1,776,2869.0%Asian alone
- 732,6703.7%Two or more races
- 216,1101.1%Other race alone
- 35,0820.2%American Indian alone
- 6,9310.04%Native Hawaiian and Other
Pacific Islander alone

Income and house value in Hopewell
- Median household income in 2022
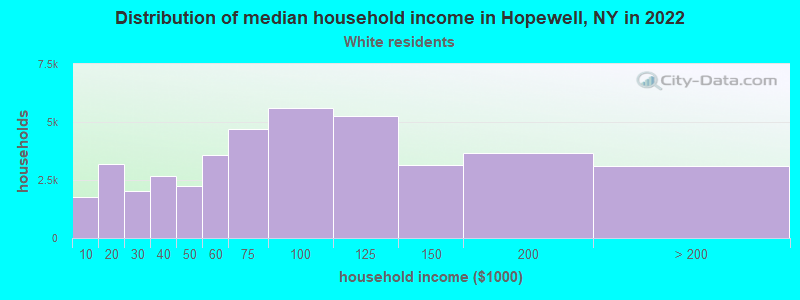
- $70,861White non-Hispanic householders
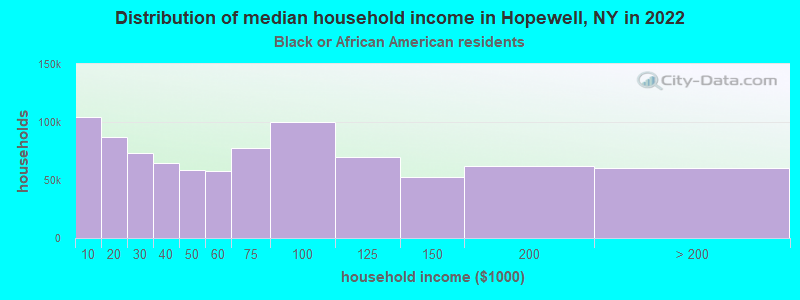
- $104,790Black householders
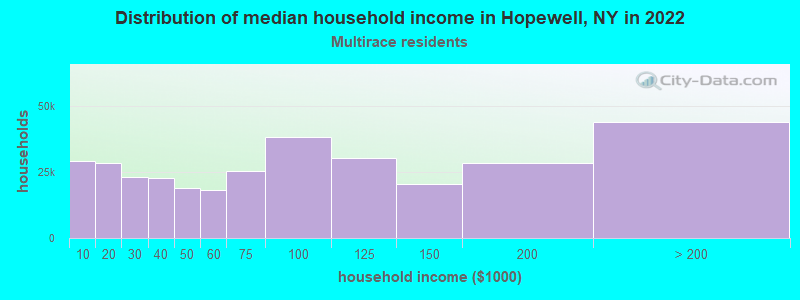
- $73,399Two or more races householders
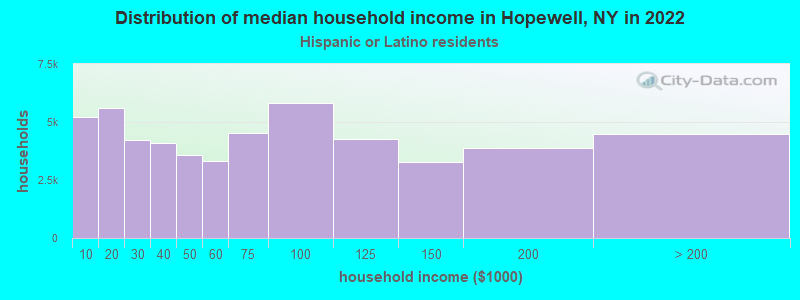
- $4,560Hispanic or Latino race householders
- Median 2022 house value
- $193,165White Non-Hispanic householders
- $208,452Black or African American householders
Household income for White non-Hispanic householders
Household income for Black householders
Household income for Two or more races householders
Household income for Hispanic or Latino race householders
Foreign-born residents in Hopewell
62 residents are foreign born
| This city: | 1.9% |
| New York: | 20.4% |
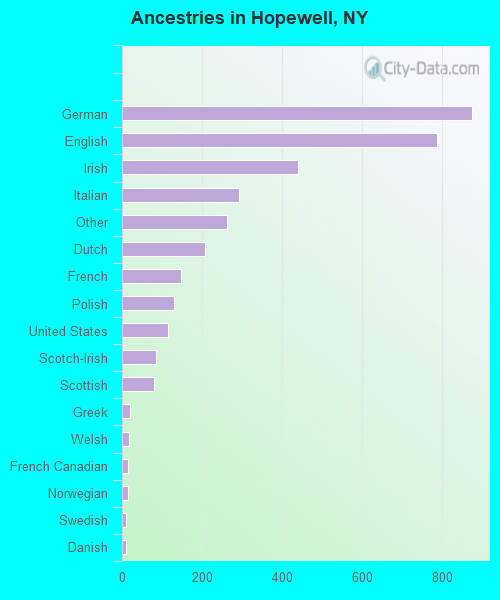
Ancestries in Hopewell

- 87324.8%German
- 78722.3%English
- 44012.5%Irish
- 2928.3%Italian
- 2637.5%Other
- 2075.9%Dutch
- 1474.2%French
- 1293.7%Polish
- 1153.3%United States
- 852.4%Scotch-Irish
- 812.3%Scottish
- 210.6%Greek
- 180.5%Welsh
- 150.4%French Canadian
- 140.4%Norwegian
- 110.3%Swedish
- 100.3%Danish
- 70.2%Lithuanian
- 60.2%Ukrainian
- 50.1%Swiss
Zip codes: 14424.