Races in Horicon, New York (NY) Detailed Stats
Ancestries, Foreign-born residents, place of birth
2.1% of Horicon, NY residents are foreign-born (1.6% born in Europe, 0.3% born in Latin America), which is 949.6% less than the foreign-born rate of 22.0% across the entire state of New York.
Race distribution in Horicon

- 1,45398.2%White alone
- 70.5%Hispanic
- 80.5%Two or more races
- 30.2%Black alone
- 30.2%Asian alone
- 30.2%American Indian alone
- 20.1%Other race alone

2000
2022
-
- 11,760,98162.0%White alone
- 2,867,58315.1%Hispanic
- 2,812,62314.8%Black alone
- 1,035,9265.5%Asian alone
- 366,1161.9%Two or more races
- 75,4990.4%Other race alone
- 52,4990.3%American Indian alone
- 5,2300.03%Native Hawaiian and Other
Pacific Islander alone

-
- 10,408,93352.9%White alone
- 3,867,29919.7%Hispanic
- 2,633,84013.4%Black alone
- 1,776,2869.0%Asian alone
- 732,6703.7%Two or more races
- 216,1101.1%Other race alone
- 35,0820.2%American Indian alone
- 6,9310.04%Native Hawaiian and Other
Pacific Islander alone

Income and house value in Horicon
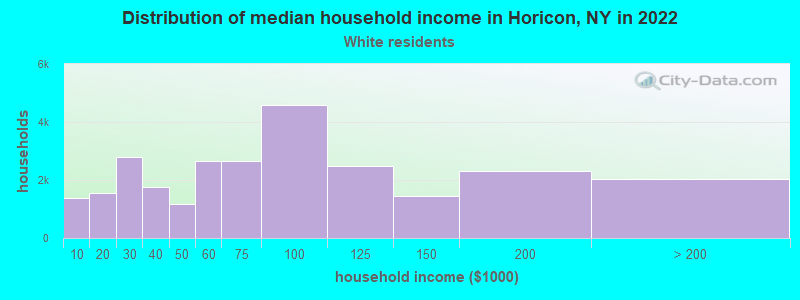
- Median household income in 2022
- $66,705White non-Hispanic householders
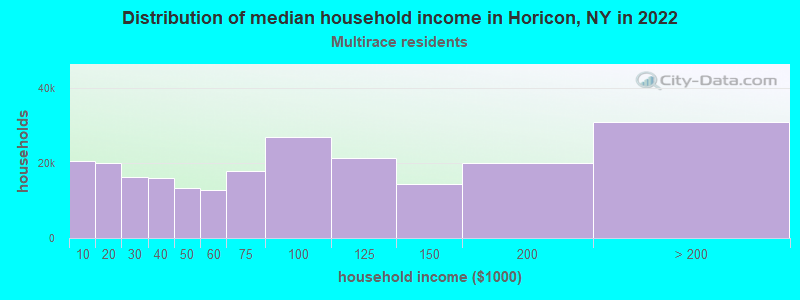
- $41,761Two or more races householders
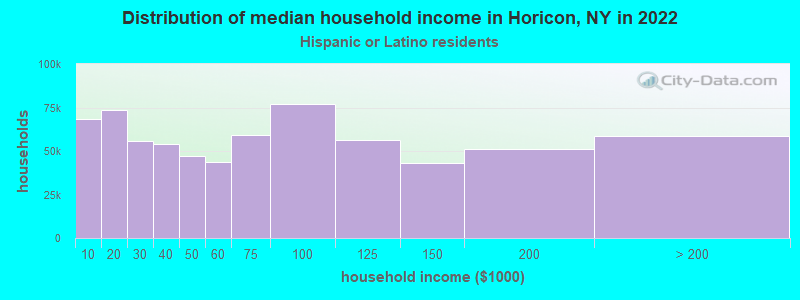
- $100,639Hispanic or Latino race householders
- Median 2022 house value
- $282,873White Non-Hispanic householders
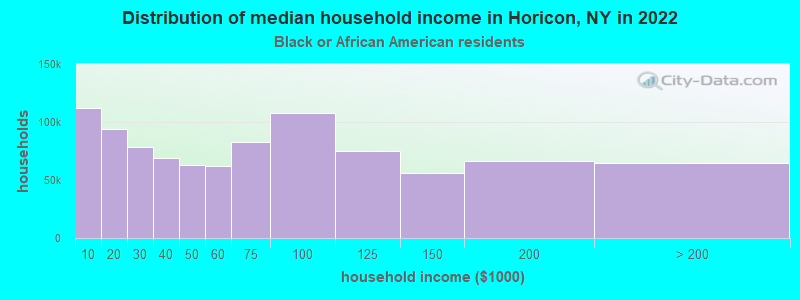
- $614,349Black or African American householders
- $150,174Two or more races householders
Household income for White non-Hispanic householders
Household income for Black householders
Household income for Two or more races householders
Household income for Hispanic or Latino race householders
Foreign-born residents in Horicon
31 residents are foreign born (1.6% Europe, 0.3% Latin America).
| This city: | 2.1% |
| New York: | 20.4% |
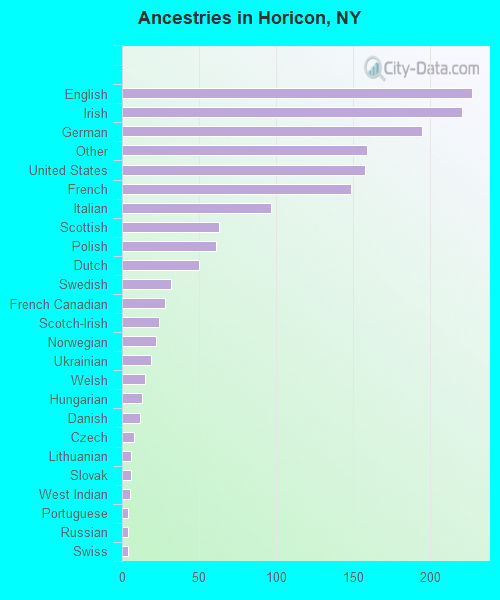
Ancestries in Horicon

- 22714.3%English
- 22113.9%Irish
- 19512.3%German
- 15910.0%Other
- 15810.0%United States
- 1499.4%French
- 976.1%Italian
- 634.0%Scottish
- 613.8%Polish
- 503.2%Dutch
- 322.0%Swedish
- 281.8%French Canadian
- 241.5%Scotch-Irish
- 221.4%Norwegian
- 191.2%Ukrainian
- 150.9%Welsh
- 130.8%Hungarian
- 120.8%Danish
- 80.5%Czech
- 60.4%Lithuanian
- 60.4%Slovak
- 50.3%West Indian
- 40.3%Portuguese
- 40.3%Russian
- 40.3%Swiss
- 30.2%Arab
- 20.1%Subsaharan African
Zip codes: 12815.