Races in Hornsby Bend, Texas (TX) Detailed Stats
Data:
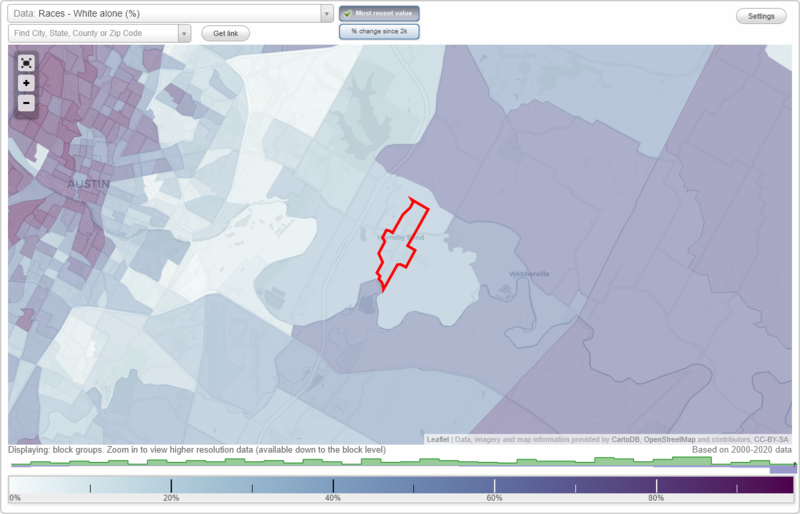
Races - White alone (%)
Races - White alone (% change since 2000)
Races - Black alone (%)
Races - Black alone (% change since 2000)
Races - American Indian alone (%)
Races - American Indian alone (% change since 2000)
Races - Asian alone (%)
Races - Asian alone (% change since 2000)
Races - Hispanic (%)
Races - Hispanic (% change since 2000)
Races - Native Hawaiian and Other Pacific Islander alone (%)
Races - Native Hawaiian and Other Pacific Islander alone (% change since 2000)
Races - Two or more races(%)
Races - Two or more races(% change since 2000)
Races - Other race alone (%)
Races - Other race alone (% change since 2000)
Racial diversity
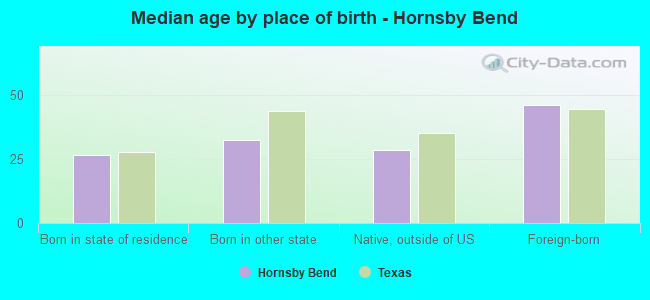
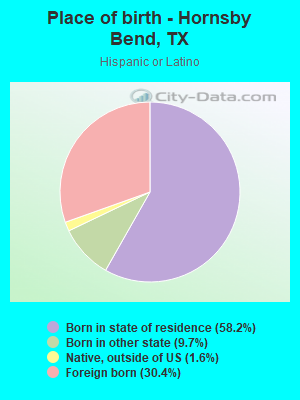
Place of birth - Born in state of residence (%)
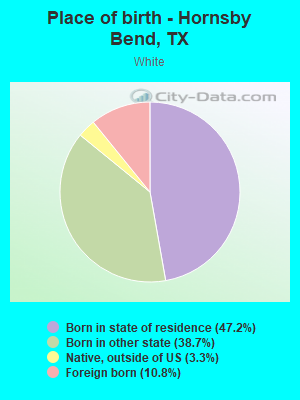
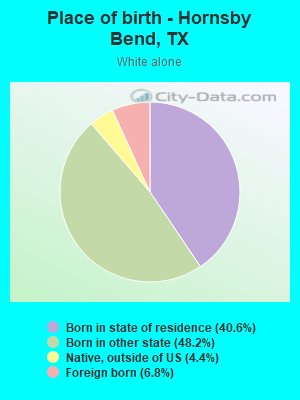
Place of birth - Born in state of residence (%) - White
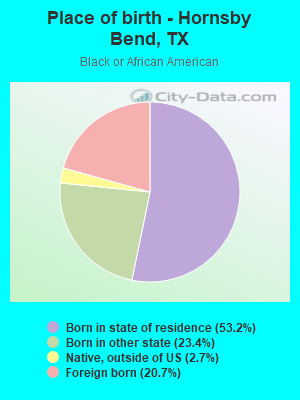
Place of birth - Born in state of residence (%) - Black or African American
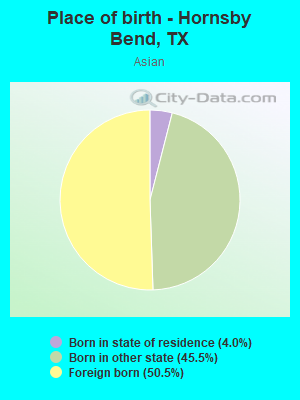
Place of birth - Born in state of residence (%) - Asian
Place of birth - Born in state of residence (%) - Hispanic or Latino
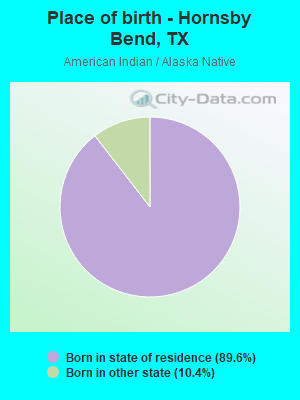
Place of birth - Born in state of residence (%) - American Indian and Alaska Native
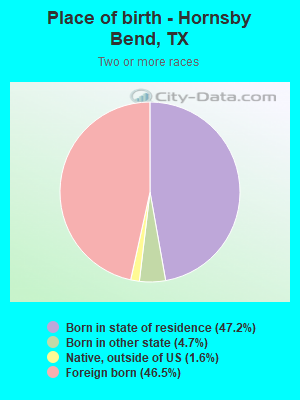
Place of birth - Born in state of residence (%) - Multirace
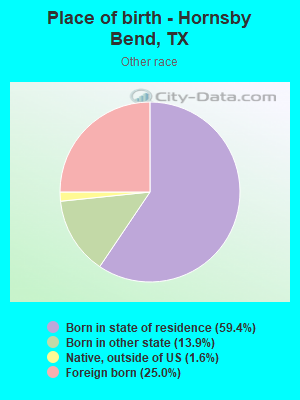
Place of birth - Born in state of residence (%) - Other Race
Place of birth - Born in other state (%)
Place of birth - Born in other state (%) - White
Place of birth - Born in other state (%) - Black or African American
Place of birth - Born in other state (%) - Asian
Place of birth - Born in other state (%) - Hispanic or Latino
Place of birth - Born in other state (%) - American Indian and Alaska Native
Place of birth - Born in other state (%) - Multirace
Place of birth - Born in other state (%) - Other Race
Place of birth - Native, outside of US (%)
Place of birth - Native, outside of US (%) - White
Place of birth - Native, outside of US (%) - Black or African American
Place of birth - Native, outside of US (%) - Asian
Place of birth - Native, outside of US (%) - Hispanic or Latino
Place of birth - Native, outside of US (%) - American Indian and Alaska Native
Place of birth - Native, outside of US (%) - Multirace
Place of birth - Native, outside of US (%) - Other Race
Place of birth - Foreign born (%)
Place of birth - Foreign born (%) - White
Place of birth - Foreign born (%) - Black or African American
Place of birth - Foreign born (%) - Asian
Place of birth - Foreign born (%) - Hispanic or Latino
Place of birth - Foreign born (%) - American Indian and Alaska Native
Place of birth - Foreign born (%) - Multirace
Place of birth - Foreign born (%) - Other Race
Residents speaking English at home (%)
Residents speaking English at home - Born in the United States (%)
Residents speaking English at home - Native, born elsewhere (%)
Residents speaking English at home - Foreign born (%)
Residents speaking Spanish at home (%)
Residents speaking Spanish at home - Born in the United States (%)
Residents speaking Spanish at home - Native, born elsewhere (%)
Residents speaking Spanish at home - Foreign born (%)
Residents speaking other language at home (%)
Residents speaking other language at home - Born in the United States (%)
Residents speaking other language at home - Native, born elsewhere (%)
Residents speaking other language at home - Foreign born (%)
Marital status - Never married (%)
Marital status - Now married (%)
Marital status - Separated (%)
Marital status - Widowed (%)
Marital status - Divorced (%)
Ancestries Reported - Arab (%)
Ancestries Reported - Czech (%)
Ancestries Reported - Danish (%)
Ancestries Reported - Dutch (%)
Ancestries Reported - English (%)
Ancestries Reported - French (%)
Ancestries Reported - French Canadian (%)
Ancestries Reported - German (%)
Ancestries Reported - Greek (%)
Ancestries Reported - Hungarian (%)
Ancestries Reported - Irish (%)
Ancestries Reported - Italian (%)
Ancestries Reported - Lithuanian (%)
Ancestries Reported - Norwegian (%)
Ancestries Reported - Polish (%)
Ancestries Reported - Portuguese (%)
Ancestries Reported - Russian (%)
Ancestries Reported - Scotch-Irish (%)
Ancestries Reported - Scottish (%)
Ancestries Reported - Slovak (%)
Ancestries Reported - Subsaharan African (%)
Ancestries Reported - Swedish (%)
Ancestries Reported - Swiss (%)
Ancestries Reported - Ukrainian (%)
Ancestries Reported - United States (%)
Ancestries Reported - Welsh (%)
Ancestries Reported - West Indian (%)
Ancestries Reported - Other (%)
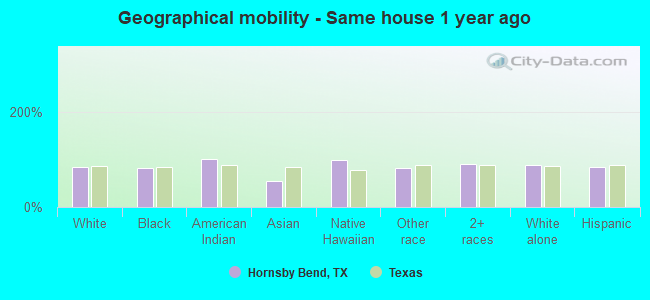
Geographical mobility - Same house 1 year ago (%)
Geographical mobility - Same house 1 year ago (%) - White
Geographical mobility - Same house 1 year ago (%) - Black or African American
Geographical mobility - Same house 1 year ago (%) - Asian
Geographical mobility - Same house 1 year ago (%) - Hispanic or Latino
Geographical mobility - Same house 1 year ago (%) - American Indian and Alaska Native
Geographical mobility - Same house 1 year ago (%) - Multirace
Geographical mobility - Same house 1 year ago (%) - Other Race
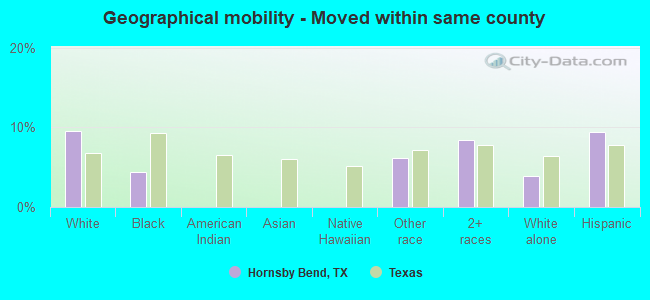
Geographical mobility - Moved within same county (%)
Geographical mobility - Moved within same county (%) - White
Geographical mobility - Moved within same county (%) - Black or African American
Geographical mobility - Moved within same county (%) - Asian
Geographical mobility - Moved within same county (%) - Hispanic or Latino
Geographical mobility - Moved within same county (%) - American Indian and Alaska Native
Geographical mobility - Moved within same county (%) - Multirace
Geographical mobility - Moved within same county (%) - Other Race
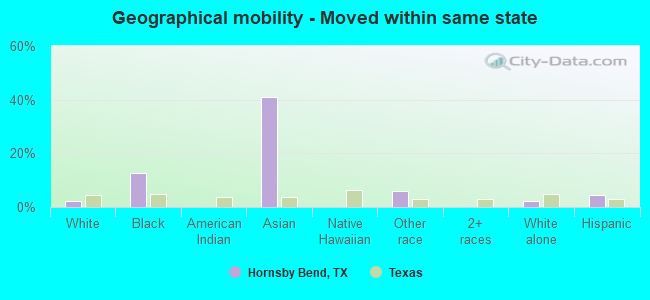
Geographical mobility - Moved from different county within same state (%)
Geographical mobility - Moved from different county within same state (%) - White
Geographical mobility - Moved from different county within same state (%) - Black or African American
Geographical mobility - Moved from different county within same state (%) - Asian
Geographical mobility - Moved from different county within same state (%) - Hispanic or Latino
Geographical mobility - Moved from different county within same state (%) - American Indian and Alaska Native
Geographical mobility - Moved from different county within same state (%) - Multirace
Geographical mobility - Moved from different county within same state (%) - Other Race
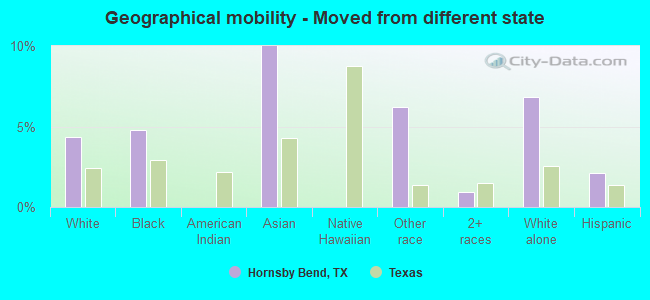
Geographical mobility - Moved from different state (%)
Geographical mobility - Moved from different state (%) - White
Geographical mobility - Moved from different state (%) - Black or African American
Geographical mobility - Moved from different state (%) - Asian
Geographical mobility - Moved from different state (%) - Hispanic or Latino
Geographical mobility - Moved from different state (%) - American Indian and Alaska Native
Geographical mobility - Moved from different state (%) - Multirace
Geographical mobility - Moved from different state (%) - Other Race
Geographical mobility - Moved from abroad (%)
Geographical mobility - Moved from abroad (%) - White
Geographical mobility - Moved from abroad (%) - Black or African American
Geographical mobility - Moved from abroad (%) - Asian
Geographical mobility - Moved from abroad (%) - Hispanic or Latino
Geographical mobility - Moved from abroad (%) - American Indian and Alaska Native
Geographical mobility - Moved from abroad (%) - Multirace
Geographical mobility - Moved from abroad (%) - Other Race
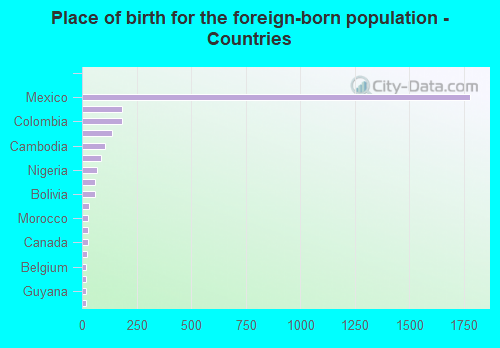
Place of birth for the foreign-born population - Ireland (%)
Place of birth for the foreign-born population - Denmark (%)
Place of birth for the foreign-born population - Norway (%)
Place of birth for the foreign-born population - Sweden (%)
Place of birth for the foreign-born population - United Kingdom (%)
Place of birth for the foreign-born population - England (%)
Place of birth for the foreign-born population - Scotland (%)
Place of birth for the foreign-born population - Other Northern Europe (%)
Place of birth for the foreign-born population - Austria (%)
Place of birth for the foreign-born population - Belgium (%)
Place of birth for the foreign-born population - France (%)
Place of birth for the foreign-born population - Germany (%)
Place of birth for the foreign-born population - Netherlands (%)
Place of birth for the foreign-born population - Switzerland (%)
Place of birth for the foreign-born population - Other Western Europe (%)
Place of birth for the foreign-born population - Greece (%)
Place of birth for the foreign-born population - Italy (%)
Place of birth for the foreign-born population - Portugal (%)
Place of birth for the foreign-born population - Spain (%)
Place of birth for the foreign-born population - Other Southern Europe (%)
Place of birth for the foreign-born population - Albania (%)
Place of birth for the foreign-born population - Belarus (%)
Place of birth for the foreign-born population - Bosnia and Herzegovina (%)
Place of birth for the foreign-born population - Bulgaria (%)
Place of birth for the foreign-born population - Croatia (%)
Place of birth for the foreign-born population - Czechoslovakia (%)
Place of birth for the foreign-born population - Hungary (%)
Place of birth for the foreign-born population - Latvia (%)
Place of birth for the foreign-born population - Lithuania (%)
Place of birth for the foreign-born population - North Macedonia (Macedonia) (%)
Place of birth for the foreign-born population - Moldova (%)
Place of birth for the foreign-born population - Poland (%)
Place of birth for the foreign-born population - Romania (%)
Place of birth for the foreign-born population - Russia (%)
Place of birth for the foreign-born population - Serbia (%)
Place of birth for the foreign-born population - Ukraine (%)
Place of birth for the foreign-born population - Other Eastern Europe (%)
Place of birth for the foreign-born population - China (%)
Place of birth for the foreign-born population - Hong Kong (%)
Place of birth for the foreign-born population - Taiwan (%)
Place of birth for the foreign-born population - Japan (%)
Place of birth for the foreign-born population - Korea (%)
Place of birth for the foreign-born population - Other Eastern Asia (%)
Place of birth for the foreign-born population - Afghanistan (%)
Place of birth for the foreign-born population - Bangladesh (%)
Place of birth for the foreign-born population - India (%)
Place of birth for the foreign-born population - Iran (%)
Place of birth for the foreign-born population - Kazakhstan (%)
Place of birth for the foreign-born population - Nepal (%)
Place of birth for the foreign-born population - Pakistan (%)
Place of birth for the foreign-born population - Sri Lanka (%)
Place of birth for the foreign-born population - Uzbekistan (%)
Place of birth for the foreign-born population - Other South Central Asia (%)
Place of birth for the foreign-born population - Burma (%)
Place of birth for the foreign-born population - Cambodia (%)
Place of birth for the foreign-born population - Indonesia (%)
Place of birth for the foreign-born population - Laos (%)
Place of birth for the foreign-born population - Malaysia (%)
Place of birth for the foreign-born population - Philippines (%)
Place of birth for the foreign-born population - Singapore (%)
Place of birth for the foreign-born population - Thailand (%)
Place of birth for the foreign-born population - Vietnam (%)
Place of birth for the foreign-born population - Other South Eastern Asia (%)
Place of birth for the foreign-born population - Armenia (%)
Place of birth for the foreign-born population - Iraq (%)
Place of birth for the foreign-born population - Israel (%)
Place of birth for the foreign-born population - Jordan (%)
Place of birth for the foreign-born population - Kuwait (%)
Place of birth for the foreign-born population - Lebanon (%)
Place of birth for the foreign-born population - Saudi Arabia (%)
Place of birth for the foreign-born population - Syria (%)
Place of birth for the foreign-born population - Turkey (%)
Place of birth for the foreign-born population - Yemen (%)
Place of birth for the foreign-born population - Other Western Asia (%)
Place of birth for the foreign-born population - Eritrea (%)
Place of birth for the foreign-born population - Ethiopia (%)
Place of birth for the foreign-born population - Kenya (%)
Place of birth for the foreign-born population - Somalia (%)
Place of birth for the foreign-born population - Uganda (%)
Place of birth for the foreign-born population - Zimbabwe (%)
Place of birth for the foreign-born population - Other Eastern Africa (%)
Place of birth for the foreign-born population - Cameroon (%)
Place of birth for the foreign-born population - Congo (%)
Place of birth for the foreign-born population - Democratic Republic of Congo (Zaire) (%)
Place of birth for the foreign-born population - Other Middle Africa (%)
Place of birth for the foreign-born population - Egypt (%)
Place of birth for the foreign-born population - Morocco (%)
Place of birth for the foreign-born population - Sudan (%)
Place of birth for the foreign-born population - Other Northern Africa (%)
Place of birth for the foreign-born population - South Africa (%)
Place of birth for the foreign-born population - Other Southern Africa (%)
Place of birth for the foreign-born population - Cabo Verde (%)
Place of birth for the foreign-born population - Ghana (%)
Place of birth for the foreign-born population - Liberia (%)
Place of birth for the foreign-born population - Nigeria (%)
Place of birth for the foreign-born population - Senegal (%)
Place of birth for the foreign-born population - Sierra Leone (%)
Place of birth for the foreign-born population - Other Western Africa (%)
Place of birth for the foreign-born population - Australia (%)
Place of birth for the foreign-born population - New Zealand (%)
Place of birth for the foreign-born population - Fiji (%)
Place of birth for the foreign-born population - Micronesia (%)
Place of birth for the foreign-born population - Bahamas (%)
Place of birth for the foreign-born population - Barbados (%)
Place of birth for the foreign-born population - Cuba (%)
Place of birth for the foreign-born population - Dominica (%)
Place of birth for the foreign-born population - Dominican Republic (%)
Place of birth for the foreign-born population - Grenada (%)
Place of birth for the foreign-born population - Haiti (%)
Place of birth for the foreign-born population - Jamaica (%)
Place of birth for the foreign-born population - St. Vincent and the Grenadines (%)
Place of birth for the foreign-born population - Trinidad and Tobago (%)
Place of birth for the foreign-born population - West Indies (%)
Place of birth for the foreign-born population - Other Caribbean (%)
Place of birth for the foreign-born population - Belize (%)
Place of birth for the foreign-born population - Costa Rica (%)
Place of birth for the foreign-born population - El Salvador (%)
Place of birth for the foreign-born population - Guatemala (%)
Place of birth for the foreign-born population - Honduras (%)
Place of birth for the foreign-born population - Mexico (%)
Place of birth for the foreign-born population - Nicaragua (%)
Place of birth for the foreign-born population - Panama (%)
Place of birth for the foreign-born population - Other Central America (%)
Place of birth for the foreign-born population - Argentina (%)
Place of birth for the foreign-born population - Bolivia (%)
Place of birth for the foreign-born population - Brazil (%)
Place of birth for the foreign-born population - Chile (%)
Place of birth for the foreign-born population - Colombia (%)
Place of birth for the foreign-born population - Ecuador (%)
Place of birth for the foreign-born population - Guyana (%)
Place of birth for the foreign-born population - Peru (%)
Place of birth for the foreign-born population - Uruguay (%)
Place of birth for the foreign-born population - Venezuela (%)
Place of birth for the foreign-born population - Other South America (%)
Place of birth for the foreign-born population - Canada (%)
Place of birth for the foreign-born population - Other Northern America (%)
Place of birth for the foreign-born population - Other (%)
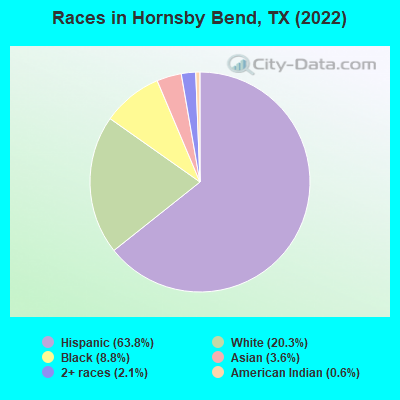
According to 2022 data, the most numerous races in Hornsby Bend, TX are Hispanic (7,238 residents), White alone (2,304 residents), and Black alone (996 residents). 43.0% of Hornsby Bend residents speak English at home.
Race distribution in Hornsby Bend 7,238 63.8% Hispanic 2,304 20.3% White alone 996 8.8% Black alone 413 3.6% Asian alone 242 2.1% Two or more races 70 0.6% American Indian alone
2000 2022
10,933,313 52.4% White alone 6,669,666 32.0% Hispanic 2,364,255 11.3% Black alone 554,445 2.7% Asian alone 230,567 1.1% Two or more races 68,859 0.3% American Indian alone 19,958 0.10% Other race alone 10,757 0.05% Native Hawaiian and Other
12,070,642 40.2% Hispanic 11,683,430 38.9% White alone 3,508,706 11.7% Black alone 1,608,173 5.4% Asian alone 956,560 3.2% Two or more races 125,763 0.4% Other race alone 47,023 0.2% American Indian alone 29,275 0.10% Native Hawaiian and Other
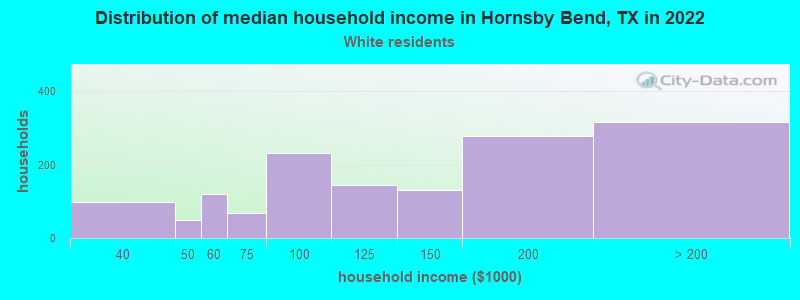
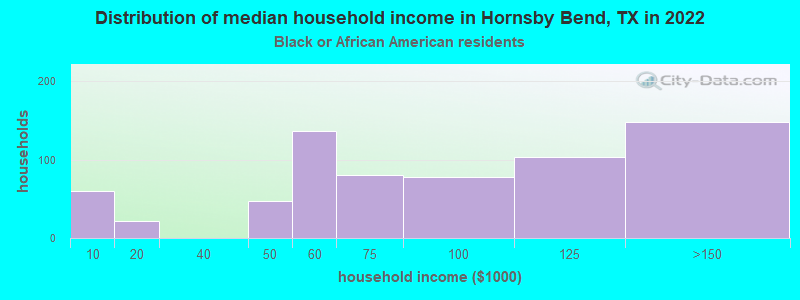
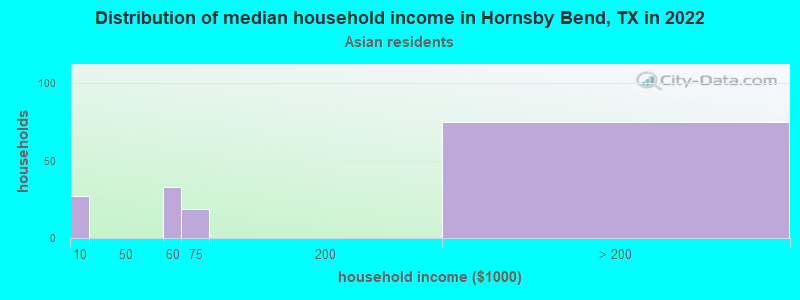
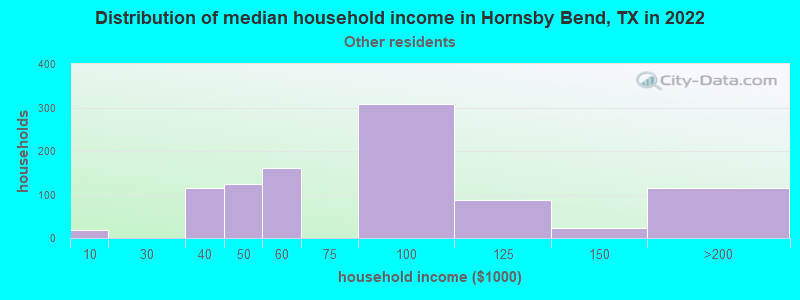
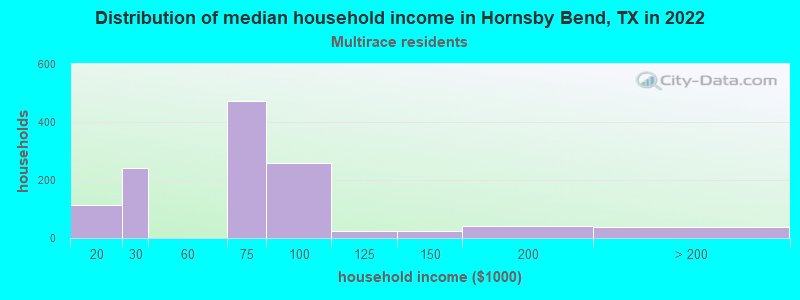
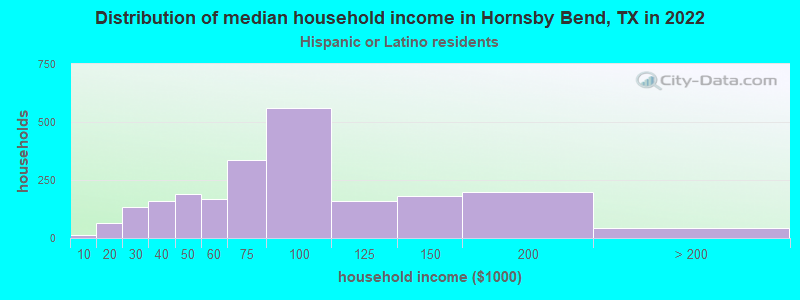
Income and house value in Hornsby Bend Median household income in 2022 $165,048 White non-Hispanic householders$79,876 Black householders$74,044 Some other race householders$65,332 Two or more races householders$79,196 Hispanic or Latino race householders
Median age by race in Hornsby Bend
40.3 Median age for White residents33.9 45.7 52.9 Median age for Black or African American residents62.4 50.9 7.1 Median age for American Indian / Alaska Native residents-793,749,999.2 7.6 37.0 Median age for Asian residents36.5 33.5 -749,403,340.5 Median age for Native Hawaiian / Pacific Islander residents-751,851,851.1 -643,584,520.7 28.8 Median age for Other race residents28.5 28.8 37.1 Median age for Two or more races residents38.9 36.5 43.4 Median age for White alone residents32.9 49.6 34.4 Median age for Hispanic or Latino residents32.5 36.9
Owner/renter occupied households by race in Hornsby Bend
House owners and renters - White residents 1,309 92.1% Owner occupied112 7.9% Renter occupiedHouse owners and renters - Black or African American residents 593 84.3% Owner occupied110 15.7% Renter occupiedHouse owners and renters - Asian residents 146 82.1% Owner occupied32 17.9% Renter occupiedHouse owners and renters - Native Hawaiian / Pacific Islander residents 35 100.0% Renter occupiedHouse owners and renters - Other race residents 658 66.4% Owner occupied333 33.6% Renter occupiedHouse owners and renters - Two or more races residents 1,268 96.8% Owner occupied42 3.2% Renter occupiedHouse owners and renters - White alone residents 824 86.8% Owner occupied125 13.2% Renter occupiedHouse owners and renters - Hispanic or Latino residents 1,897 83.9% Owner occupied364 16.1% Renter occupied
Language usage in Hornsby Bend
English speakers - Total 43.0% of residents of Hornsby Bend speak English at home.
48.7% of residents speak Spanish at home 3,229 62.0% Speak English very well1,980 38.0% Speak English less than very well7.2% of residents speak other language at home 509 66.2% Speak English very well260 33.8% Speak English less than very well
English speakers - Born in the United States 75.2% of residents of Hornsby Bend speak English at home.
14.6% of residents speak Spanish at home 320 100.0% Speak English very well10.8% of residents speak other language at home 237 100.0% Speak English very well
English speakers - Native, born elsewhere 61.8% of residents of Hornsby Bend speak English at home.
31.4% of residents speak Spanish at home 89 100.0% Speak English very well7.4% of residents speak other language at home 21 100.0% Speak English very well
English speakers - Foreign-born 4.8% of residents of Hornsby Bend speak English at home.
75.9% of residents speak Spanish at home 577 26.4% Speak English very well1,609 73.6% Speak English less than very well17.5% of residents speak other language at home 247 49.1% Speak English very well256 50.9% Speak English less than very well
White (Caucasian) - Speak only English Native:
76.4% (2,147)Foreign-born:
15.4% (55)
White (Caucasian) - Speak another language Native:
16.8% (471)Foreign-born:
78.8% (279)
Black or African American - Speak another language Native:
4.7% (39)Foreign-born:
100.0% (217)
Asian - Speak only English Native:
23.9% (49)Foreign-born:
24.5% (54)
Asian - Speak another language Native:
88.7% (184)Foreign-born:
75.8% (168)
Other race - Speak another language Native:
57.1% (1,413)Foreign-born:
99.1% (943)
Two or more races - Speak only English Native:
25.6% (488)Foreign-born:
2.0% (37)
Two or more races - Speak another language Native:
89.9% (1,716)Foreign-born:
98.5% (1,776)
White alone - Speak only English Native:
93.7% (1,946)Foreign-born:
28.9% (46)
White alone - Speak another language Native:
6.0% (124)Foreign-born:
72.2% (114)
Hispanic or Latino - Speak only English Native:
32.8% (1,484)Foreign-born:
0.9% (19)
Hispanic or Latino - Speak another language Native:
66.4% (3,011)Foreign-born:
99.0% (2,166)
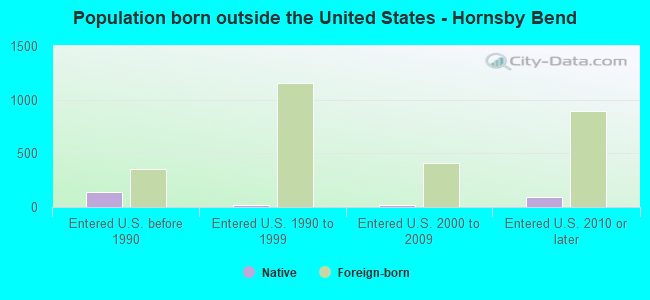
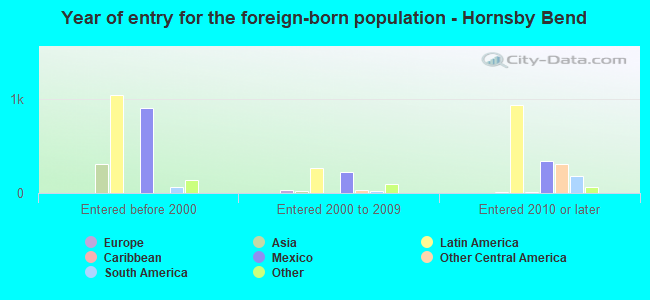
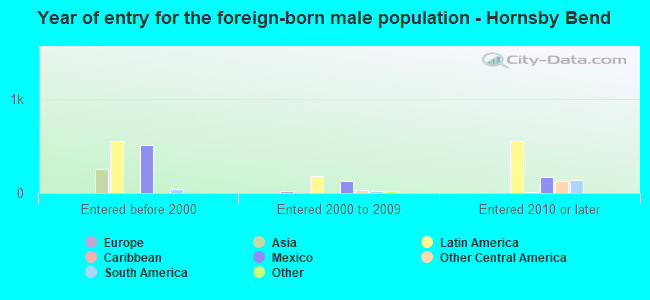
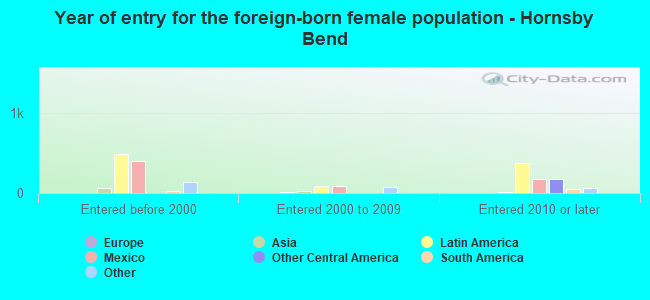
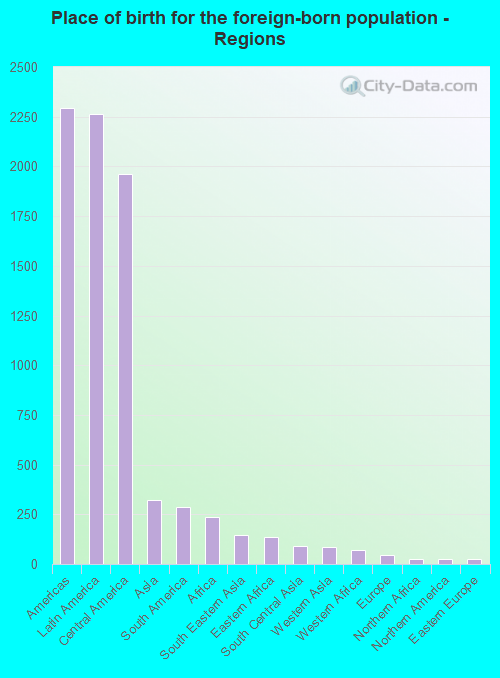
Foreign-born residents in Hornsby Bend
Marital status for residents in Hornsby Bend Marital status - White (Caucasian) population 15 years and over
Males 41.7% Never married37.3% Now married6.2% Separated0.0% Widowed14.7% DivorcedFemales 17.1% Never married72.2% Now married4.0% Separated0.0% Widowed6.8% DivorcedWomen who gave birth in the past 12 months Now married:
0.0% (0)Unmarried:
100.0% (18)
Women who did not give birth in the past 12 months Now married:
70.7% (685)Unmarried:
29.3% (284)
Marital status - Black or African American population 15 years and over
Males 48.7% Never married41.5% Now married0.0% Separated0.0% Widowed9.8% DivorcedFemales 27.9% Never married7.8% Now married13.2% Separated0.0% Widowed51.1% DivorcedWomen who did not give birth in the past 12 months Now married:
7.7% (16)Unmarried:
92.3% (192)
Marital status - Asian population 15 years and over
Males 33.5% Never married66.5% Now married0.0% Separated0.0% Widowed0.0% DivorcedFemales 26.2% Never married73.8% Now married0.0% Separated0.0% Widowed0.0% DivorcedWomen who gave birth in the past 12 months Now married:
100.0% (50)Unmarried:
0.0% (0)
Women who did not give birth in the past 12 months Now married:
65.8% (106)Unmarried:
34.2% (55)
Marital status - Other race population 15 years and over
Males 50.1% Never married40.0% Now married0.0% Separated0.0% Widowed9.9% DivorcedFemales 34.1% Never married37.3% Now married9.6% Separated0.0% Widowed19.0% DivorcedWomen who gave birth in the past 12 months Now married:
26.2% (43)Unmarried:
73.8% (120)
Women who did not give birth in the past 12 months Now married:
25.7% (182)Unmarried:
74.3% (525)
Marital status - Two or more races population 15 years and over
Males 55.2% Never married41.7% Now married1.4% Separated0.0% Widowed1.7% DivorcedFemales 51.9% Never married39.7% Now married0.0% Separated0.0% Widowed8.4% DivorcedWomen who gave birth in the past 12 months Now married:
0.0% (0)Unmarried:
100.0% (19)
Women who did not give birth in the past 12 months Now married:
40.1% (584)Unmarried:
59.9% (871)
Marital status - White alone, not Hispanic / Latino population 15 years and over
Males 42.9% Never married27.2% Now married11.3% Separated0.0% Widowed18.5% DivorcedFemales 17.4% Never married73.3% Now married5.4% Separated0.0% Widowed3.8% DivorcedWomen who gave birth in the past 12 months Now married:
0.0% (0)Unmarried:
100.0% (20)
Women who did not give birth in the past 12 months Now married:
69.5% (502)Unmarried:
30.5% (221)
Marital status - Hispanic or Latino population 15 years and over
Males 49.8% Never married42.7% Now married0.4% Separated0.0% Widowed7.1% DivorcedFemales 36.6% Never married43.6% Now married4.2% Separated0.0% Widowed15.6% DivorcedWomen who gave birth in the past 12 months Now married:
24.3% (38)Unmarried:
75.7% (117)
Women who did not give birth in the past 12 months Now married:
41.4% (777)Unmarried:
58.6% (1,101)
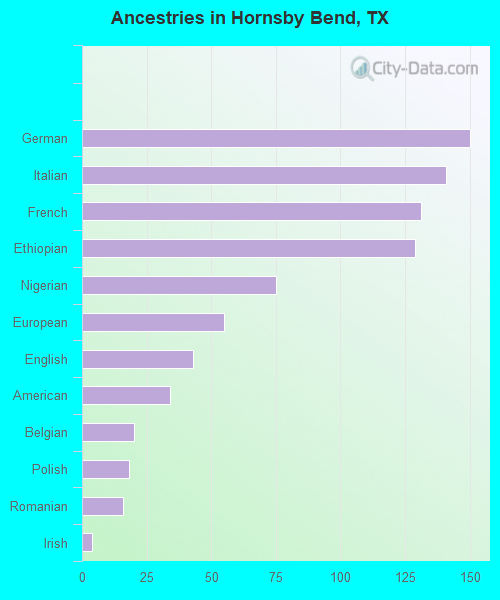
Ancestries in Hornsby Bend
150 2.3% German141 2.1% Italian131 2.0% French129 1.9% Ethiopian75 1.1% Nigerian55 0.8% European43 0.6% English34 0.5% American20 0.3% Belgian18 0.3% Polish16 0.2% Romanian4 0.06% Irish
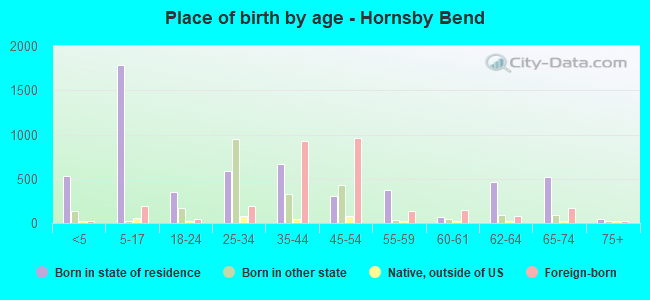
Children Nativity (place of birth) in Hornsby Bend
Children under 6 years - Living with two parents Both parents native 190 100.0% NativeOne native, one foreign-born parent 118 100.0% NativeChildren under 6 years - Living with one parent Native parent 183 100.0% NativeForeign-born parent 89 100.0% NativeChildren 6 to 17 years - Living with two parents Both parents native 253 86.5% Native39 13.5% Foreign-bornBoth parents foreign-born 346 84.1% Native66 15.9% Foreign-bornOne native, one foreign-born parent 224 100.0% NativeChildren 6 to 17 years - Living with one parent Native parent 249 100.0% NativeForeign-born parent 552 57.7% Native404 42.3% Foreign-born
Grandparents responsible for own grandchildren in Hornsby Bend
Grandparents (30 to 59 years) Native Hawaiian / Pacific Islander 36 100.0% Responsible for grandchildrenOther race 75 100.0% Not responsible for grandchildrenTwo or more races 10 100.0% Responsible for grandchildrenHispanic or Latino 39 42.4% Responsible for grandchildren53 57.6% Not responsible for grandchildren
Grandparents (60 years and over) Hispanic or Latino 28 100.0% Not responsible for grandchildren