Races in Houston, Texas (TX) Detailed Stats
Data:
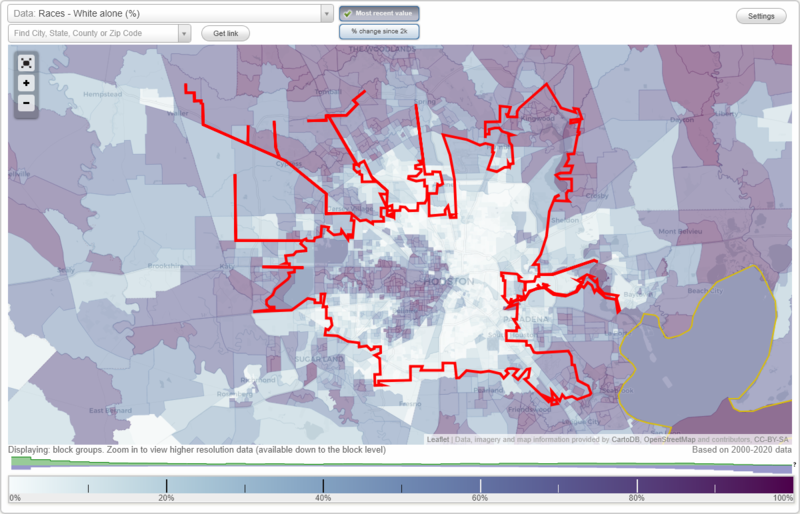
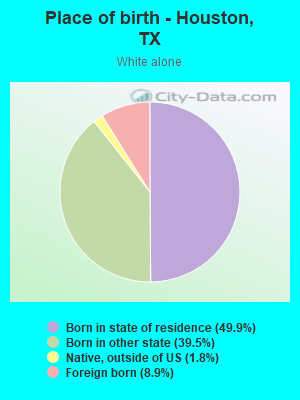
Races - White alone (%)
Races - White alone (% change since 2000)
Races - Black alone (%)
Races - Black alone (% change since 2000)
Races - American Indian alone (%)
Races - American Indian alone (% change since 2000)
Races - Asian alone (%)
Races - Asian alone (% change since 2000)
Races - Hispanic (%)
Races - Hispanic (% change since 2000)
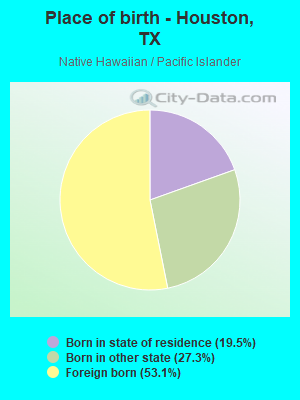
Races - Native Hawaiian and Other Pacific Islander alone (%)
Races - Native Hawaiian and Other Pacific Islander alone (% change since 2000)
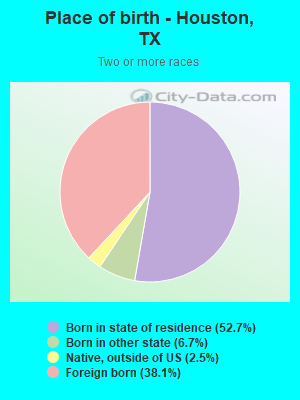
Races - Two or more races(%)
Races - Two or more races(% change since 2000)
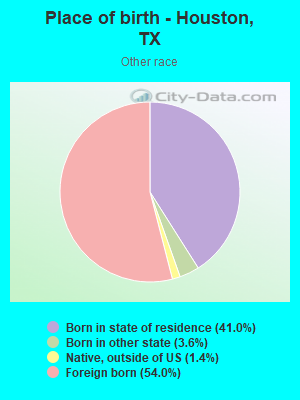
Races - Other race alone (%)
Races - Other race alone (% change since 2000)
Racial diversity
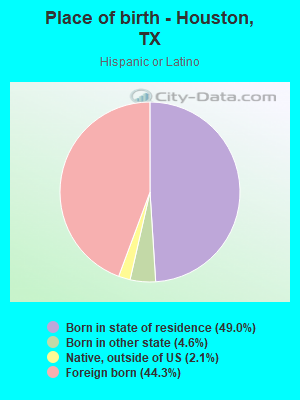
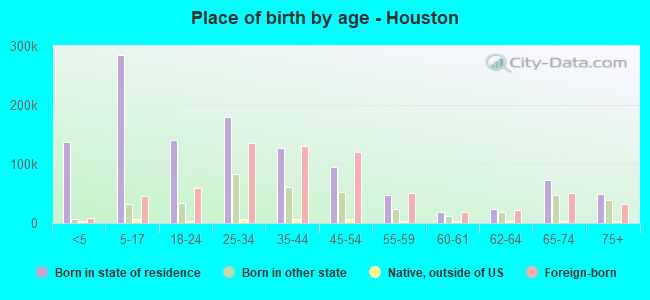
Place of birth - Born in state of residence (%)
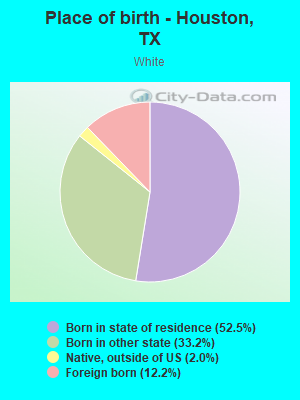
Place of birth - Born in state of residence (%) - White
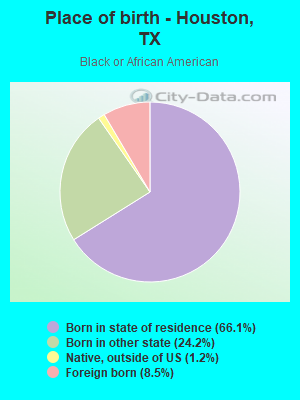
Place of birth - Born in state of residence (%) - Black or African American
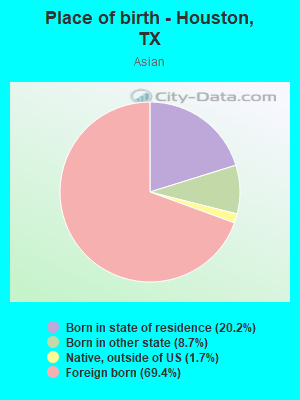
Place of birth - Born in state of residence (%) - Asian
Place of birth - Born in state of residence (%) - Hispanic or Latino
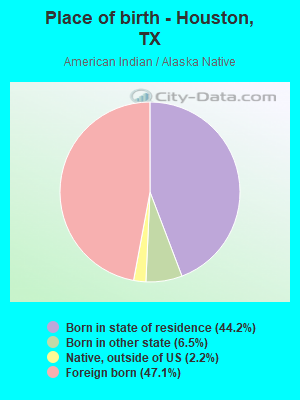
Place of birth - Born in state of residence (%) - American Indian and Alaska Native
Place of birth - Born in state of residence (%) - Multirace
Place of birth - Born in state of residence (%) - Other Race
Place of birth - Born in other state (%)
Place of birth - Born in other state (%) - White
Place of birth - Born in other state (%) - Black or African American
Place of birth - Born in other state (%) - Asian
Place of birth - Born in other state (%) - Hispanic or Latino
Place of birth - Born in other state (%) - American Indian and Alaska Native
Place of birth - Born in other state (%) - Multirace
Place of birth - Born in other state (%) - Other Race
Place of birth - Native, outside of US (%)
Place of birth - Native, outside of US (%) - White
Place of birth - Native, outside of US (%) - Black or African American
Place of birth - Native, outside of US (%) - Asian
Place of birth - Native, outside of US (%) - Hispanic or Latino
Place of birth - Native, outside of US (%) - American Indian and Alaska Native
Place of birth - Native, outside of US (%) - Multirace
Place of birth - Native, outside of US (%) - Other Race
Place of birth - Foreign born (%)
Place of birth - Foreign born (%) - White
Place of birth - Foreign born (%) - Black or African American
Place of birth - Foreign born (%) - Asian
Place of birth - Foreign born (%) - Hispanic or Latino
Place of birth - Foreign born (%) - American Indian and Alaska Native
Place of birth - Foreign born (%) - Multirace
Place of birth - Foreign born (%) - Other Race
Residents speaking English at home (%)
Residents speaking English at home - Born in the United States (%)
Residents speaking English at home - Native, born elsewhere (%)
Residents speaking English at home - Foreign born (%)
Residents speaking Spanish at home (%)
Residents speaking Spanish at home - Born in the United States (%)
Residents speaking Spanish at home - Native, born elsewhere (%)
Residents speaking Spanish at home - Foreign born (%)
Residents speaking other language at home (%)
Residents speaking other language at home - Born in the United States (%)
Residents speaking other language at home - Native, born elsewhere (%)
Residents speaking other language at home - Foreign born (%)
Marital status - Never married (%)
Marital status - Now married (%)
Marital status - Separated (%)
Marital status - Widowed (%)
Marital status - Divorced (%)
Ancestries Reported - Arab (%)
Ancestries Reported - Czech (%)
Ancestries Reported - Danish (%)
Ancestries Reported - Dutch (%)
Ancestries Reported - English (%)
Ancestries Reported - French (%)
Ancestries Reported - French Canadian (%)
Ancestries Reported - German (%)
Ancestries Reported - Greek (%)
Ancestries Reported - Hungarian (%)
Ancestries Reported - Irish (%)
Ancestries Reported - Italian (%)
Ancestries Reported - Lithuanian (%)
Ancestries Reported - Norwegian (%)
Ancestries Reported - Polish (%)
Ancestries Reported - Portuguese (%)
Ancestries Reported - Russian (%)
Ancestries Reported - Scotch-Irish (%)
Ancestries Reported - Scottish (%)
Ancestries Reported - Slovak (%)
Ancestries Reported - Subsaharan African (%)
Ancestries Reported - Swedish (%)
Ancestries Reported - Swiss (%)
Ancestries Reported - Ukrainian (%)
Ancestries Reported - United States (%)
Ancestries Reported - Welsh (%)
Ancestries Reported - West Indian (%)
Ancestries Reported - Other (%)
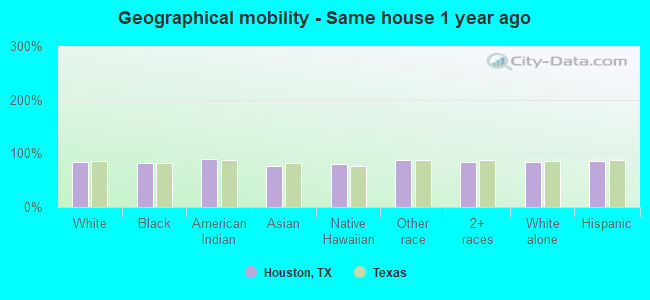
Geographical mobility - Same house 1 year ago (%)
Geographical mobility - Same house 1 year ago (%) - White
Geographical mobility - Same house 1 year ago (%) - Black or African American
Geographical mobility - Same house 1 year ago (%) - Asian
Geographical mobility - Same house 1 year ago (%) - Hispanic or Latino
Geographical mobility - Same house 1 year ago (%) - American Indian and Alaska Native
Geographical mobility - Same house 1 year ago (%) - Multirace
Geographical mobility - Same house 1 year ago (%) - Other Race
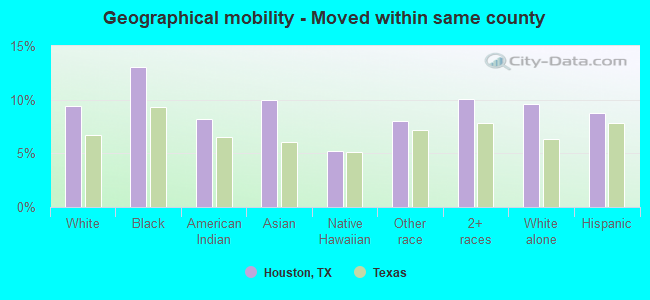
Geographical mobility - Moved within same county (%)
Geographical mobility - Moved within same county (%) - White
Geographical mobility - Moved within same county (%) - Black or African American
Geographical mobility - Moved within same county (%) - Asian
Geographical mobility - Moved within same county (%) - Hispanic or Latino
Geographical mobility - Moved within same county (%) - American Indian and Alaska Native
Geographical mobility - Moved within same county (%) - Multirace
Geographical mobility - Moved within same county (%) - Other Race
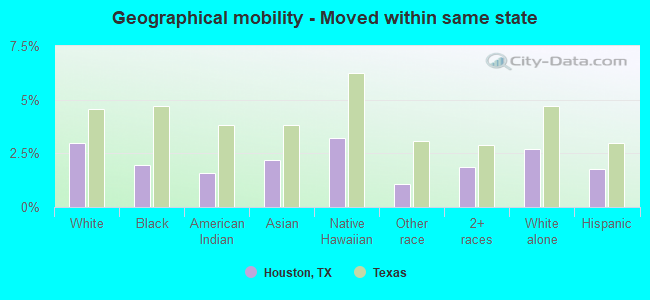
Geographical mobility - Moved from different county within same state (%)
Geographical mobility - Moved from different county within same state (%) - White
Geographical mobility - Moved from different county within same state (%) - Black or African American
Geographical mobility - Moved from different county within same state (%) - Asian
Geographical mobility - Moved from different county within same state (%) - Hispanic or Latino
Geographical mobility - Moved from different county within same state (%) - American Indian and Alaska Native
Geographical mobility - Moved from different county within same state (%) - Multirace
Geographical mobility - Moved from different county within same state (%) - Other Race
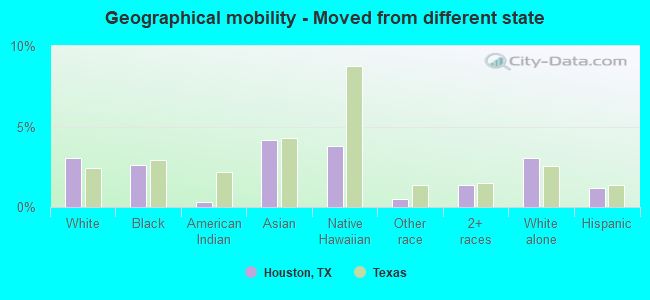
Geographical mobility - Moved from different state (%)
Geographical mobility - Moved from different state (%) - White
Geographical mobility - Moved from different state (%) - Black or African American
Geographical mobility - Moved from different state (%) - Asian
Geographical mobility - Moved from different state (%) - Hispanic or Latino
Geographical mobility - Moved from different state (%) - American Indian and Alaska Native
Geographical mobility - Moved from different state (%) - Multirace
Geographical mobility - Moved from different state (%) - Other Race
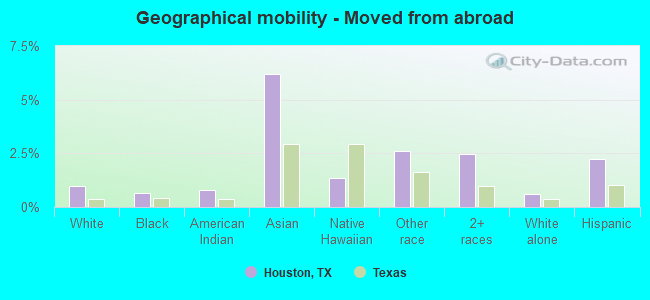
Geographical mobility - Moved from abroad (%)
Geographical mobility - Moved from abroad (%) - White
Geographical mobility - Moved from abroad (%) - Black or African American
Geographical mobility - Moved from abroad (%) - Asian
Geographical mobility - Moved from abroad (%) - Hispanic or Latino
Geographical mobility - Moved from abroad (%) - American Indian and Alaska Native
Geographical mobility - Moved from abroad (%) - Multirace
Geographical mobility - Moved from abroad (%) - Other Race
Place of birth for the foreign-born population - Ireland (%)
Place of birth for the foreign-born population - Denmark (%)
Place of birth for the foreign-born population - Norway (%)
Place of birth for the foreign-born population - Sweden (%)
Place of birth for the foreign-born population - United Kingdom (%)
Place of birth for the foreign-born population - England (%)
Place of birth for the foreign-born population - Scotland (%)
Place of birth for the foreign-born population - Other Northern Europe (%)
Place of birth for the foreign-born population - Austria (%)
Place of birth for the foreign-born population - Belgium (%)
Place of birth for the foreign-born population - France (%)
Place of birth for the foreign-born population - Germany (%)
Place of birth for the foreign-born population - Netherlands (%)
Place of birth for the foreign-born population - Switzerland (%)
Place of birth for the foreign-born population - Other Western Europe (%)
Place of birth for the foreign-born population - Greece (%)
Place of birth for the foreign-born population - Italy (%)
Place of birth for the foreign-born population - Portugal (%)
Place of birth for the foreign-born population - Spain (%)
Place of birth for the foreign-born population - Other Southern Europe (%)
Place of birth for the foreign-born population - Albania (%)
Place of birth for the foreign-born population - Belarus (%)
Place of birth for the foreign-born population - Bosnia and Herzegovina (%)
Place of birth for the foreign-born population - Bulgaria (%)
Place of birth for the foreign-born population - Croatia (%)
Place of birth for the foreign-born population - Czechoslovakia (%)
Place of birth for the foreign-born population - Hungary (%)
Place of birth for the foreign-born population - Latvia (%)
Place of birth for the foreign-born population - Lithuania (%)
Place of birth for the foreign-born population - North Macedonia (Macedonia) (%)
Place of birth for the foreign-born population - Moldova (%)
Place of birth for the foreign-born population - Poland (%)
Place of birth for the foreign-born population - Romania (%)
Place of birth for the foreign-born population - Russia (%)
Place of birth for the foreign-born population - Serbia (%)
Place of birth for the foreign-born population - Ukraine (%)
Place of birth for the foreign-born population - Other Eastern Europe (%)
Place of birth for the foreign-born population - China (%)
Place of birth for the foreign-born population - Hong Kong (%)
Place of birth for the foreign-born population - Taiwan (%)
Place of birth for the foreign-born population - Japan (%)
Place of birth for the foreign-born population - Korea (%)
Place of birth for the foreign-born population - Other Eastern Asia (%)
Place of birth for the foreign-born population - Afghanistan (%)
Place of birth for the foreign-born population - Bangladesh (%)
Place of birth for the foreign-born population - India (%)
Place of birth for the foreign-born population - Iran (%)
Place of birth for the foreign-born population - Kazakhstan (%)
Place of birth for the foreign-born population - Nepal (%)
Place of birth for the foreign-born population - Pakistan (%)
Place of birth for the foreign-born population - Sri Lanka (%)
Place of birth for the foreign-born population - Uzbekistan (%)
Place of birth for the foreign-born population - Other South Central Asia (%)
Place of birth for the foreign-born population - Burma (%)
Place of birth for the foreign-born population - Cambodia (%)
Place of birth for the foreign-born population - Indonesia (%)
Place of birth for the foreign-born population - Laos (%)
Place of birth for the foreign-born population - Malaysia (%)
Place of birth for the foreign-born population - Philippines (%)
Place of birth for the foreign-born population - Singapore (%)
Place of birth for the foreign-born population - Thailand (%)
Place of birth for the foreign-born population - Vietnam (%)
Place of birth for the foreign-born population - Other South Eastern Asia (%)
Place of birth for the foreign-born population - Armenia (%)
Place of birth for the foreign-born population - Iraq (%)
Place of birth for the foreign-born population - Israel (%)
Place of birth for the foreign-born population - Jordan (%)
Place of birth for the foreign-born population - Kuwait (%)
Place of birth for the foreign-born population - Lebanon (%)
Place of birth for the foreign-born population - Saudi Arabia (%)
Place of birth for the foreign-born population - Syria (%)
Place of birth for the foreign-born population - Turkey (%)
Place of birth for the foreign-born population - Yemen (%)
Place of birth for the foreign-born population - Other Western Asia (%)
Place of birth for the foreign-born population - Eritrea (%)
Place of birth for the foreign-born population - Ethiopia (%)
Place of birth for the foreign-born population - Kenya (%)
Place of birth for the foreign-born population - Somalia (%)
Place of birth for the foreign-born population - Uganda (%)
Place of birth for the foreign-born population - Zimbabwe (%)
Place of birth for the foreign-born population - Other Eastern Africa (%)
Place of birth for the foreign-born population - Cameroon (%)
Place of birth for the foreign-born population - Congo (%)
Place of birth for the foreign-born population - Democratic Republic of Congo (Zaire) (%)
Place of birth for the foreign-born population - Other Middle Africa (%)
Place of birth for the foreign-born population - Egypt (%)
Place of birth for the foreign-born population - Morocco (%)
Place of birth for the foreign-born population - Sudan (%)
Place of birth for the foreign-born population - Other Northern Africa (%)
Place of birth for the foreign-born population - South Africa (%)
Place of birth for the foreign-born population - Other Southern Africa (%)
Place of birth for the foreign-born population - Cabo Verde (%)
Place of birth for the foreign-born population - Ghana (%)
Place of birth for the foreign-born population - Liberia (%)
Place of birth for the foreign-born population - Nigeria (%)
Place of birth for the foreign-born population - Senegal (%)
Place of birth for the foreign-born population - Sierra Leone (%)
Place of birth for the foreign-born population - Other Western Africa (%)
Place of birth for the foreign-born population - Australia (%)
Place of birth for the foreign-born population - New Zealand (%)
Place of birth for the foreign-born population - Fiji (%)
Place of birth for the foreign-born population - Micronesia (%)
Place of birth for the foreign-born population - Bahamas (%)
Place of birth for the foreign-born population - Barbados (%)
Place of birth for the foreign-born population - Cuba (%)
Place of birth for the foreign-born population - Dominica (%)
Place of birth for the foreign-born population - Dominican Republic (%)
Place of birth for the foreign-born population - Grenada (%)
Place of birth for the foreign-born population - Haiti (%)
Place of birth for the foreign-born population - Jamaica (%)
Place of birth for the foreign-born population - St. Vincent and the Grenadines (%)
Place of birth for the foreign-born population - Trinidad and Tobago (%)
Place of birth for the foreign-born population - West Indies (%)
Place of birth for the foreign-born population - Other Caribbean (%)
Place of birth for the foreign-born population - Belize (%)
Place of birth for the foreign-born population - Costa Rica (%)
Place of birth for the foreign-born population - El Salvador (%)
Place of birth for the foreign-born population - Guatemala (%)
Place of birth for the foreign-born population - Honduras (%)
Place of birth for the foreign-born population - Mexico (%)
Place of birth for the foreign-born population - Nicaragua (%)
Place of birth for the foreign-born population - Panama (%)
Place of birth for the foreign-born population - Other Central America (%)
Place of birth for the foreign-born population - Argentina (%)
Place of birth for the foreign-born population - Bolivia (%)
Place of birth for the foreign-born population - Brazil (%)
Place of birth for the foreign-born population - Chile (%)
Place of birth for the foreign-born population - Colombia (%)
Place of birth for the foreign-born population - Ecuador (%)
Place of birth for the foreign-born population - Guyana (%)
Place of birth for the foreign-born population - Peru (%)
Place of birth for the foreign-born population - Uruguay (%)
Place of birth for the foreign-born population - Venezuela (%)
Place of birth for the foreign-born population - Other South America (%)
Place of birth for the foreign-born population - Canada (%)
Place of birth for the foreign-born population - Other Northern America (%)
Place of birth for the foreign-born population - Other (%)
Latest news about races in Houston, TX collected exclusively by city-data.com from local newspapers, TV, and radio stations
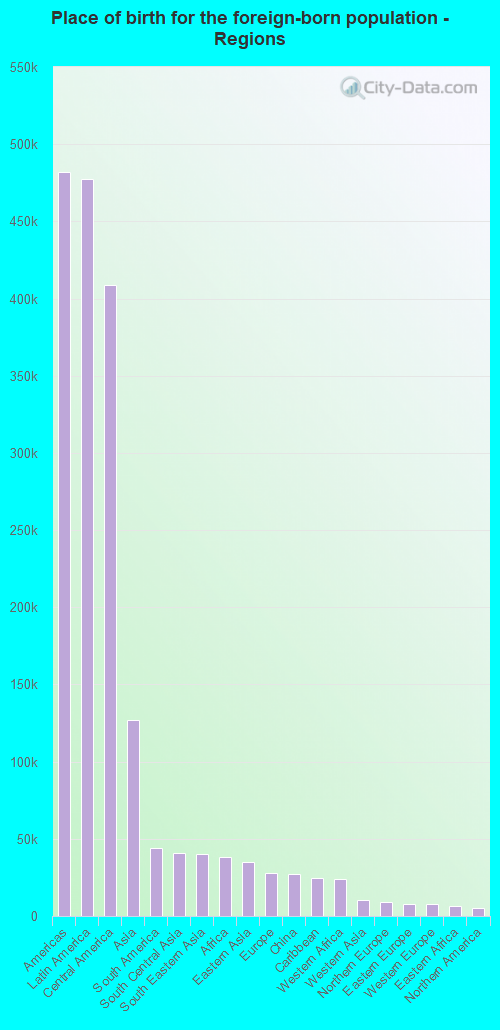
According to 2022 data, the most numerous races in Houston, TX are Hispanic (1,056,414 residents), White alone (529,431 residents), and Black alone (489,368 residents). 51.5% of Houston residents speak English at home. 29.4% of Houston, TX residents are foreign-born (20.7% born in Latin America, 5.5% born in Asia), which is 42.1% greater than the foreign-born rate of 17.0% across the entire state of Texas.
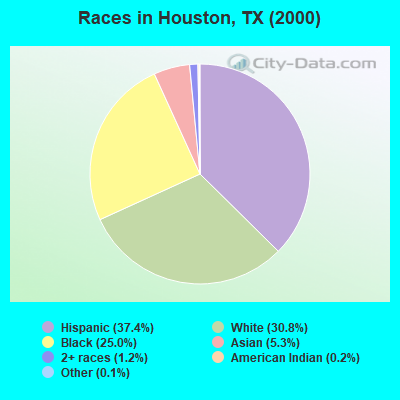
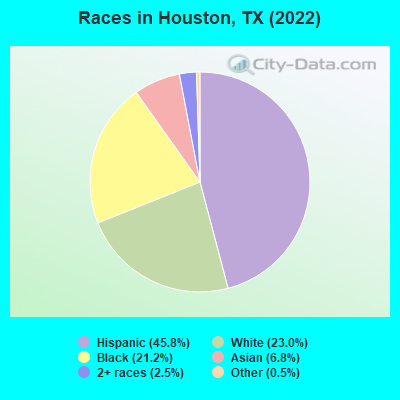
Race distribution in Houston
2000 2022
730,865 37.4% Hispanic 601,851 30.8% White alone 487,851 25.0% Black alone 102,706 5.3% Asian alone 23,830 1.2% Two or more races 3,234 0.2% American Indian alone 2,614 0.1% Other race alone 680 0.03% Native Hawaiian and Other
1,056,414 45.8% Hispanic 529,431 23.0% White alone 489,368 21.2% Black alone 156,739 6.8% Asian alone 57,821 2.5% Two or more races 11,362 0.5% Other race alone 2,250 0.10% American Indian alone 1,029 0.04% Native Hawaiian and Other
2000 2022
10,933,313 52.4% White alone 6,669,666 32.0% Hispanic 2,364,255 11.3% Black alone 554,445 2.7% Asian alone 230,567 1.1% Two or more races 68,859 0.3% American Indian alone 19,958 0.10% Other race alone 10,757 0.05% Native Hawaiian and Other
12,070,642 40.2% Hispanic 11,683,430 38.9% White alone 3,508,706 11.7% Black alone 1,608,173 5.4% Asian alone 956,560 3.2% Two or more races 125,763 0.4% Other race alone 47,023 0.2% American Indian alone 29,275 0.10% Native Hawaiian and Other
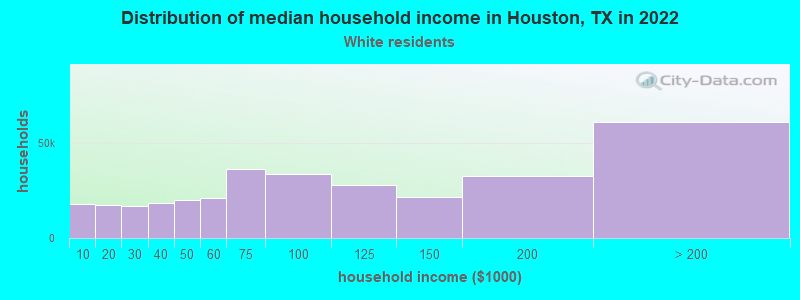
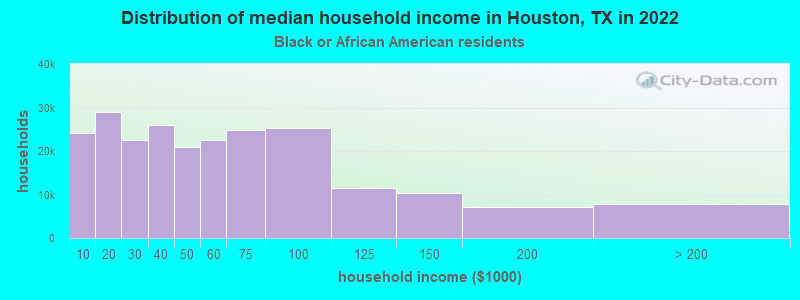
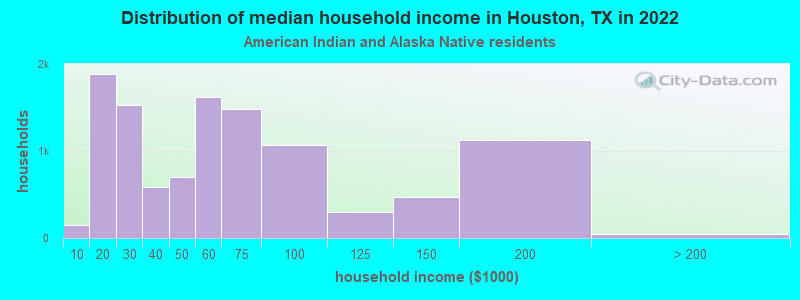
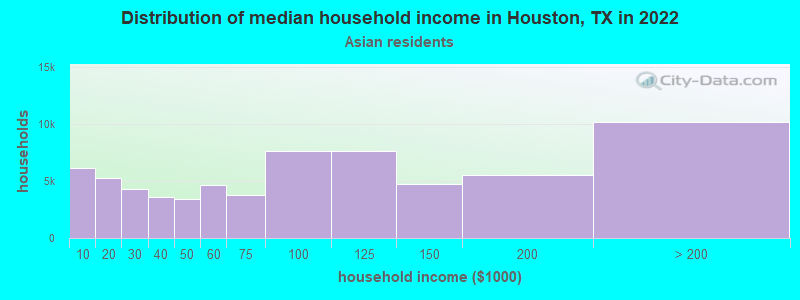
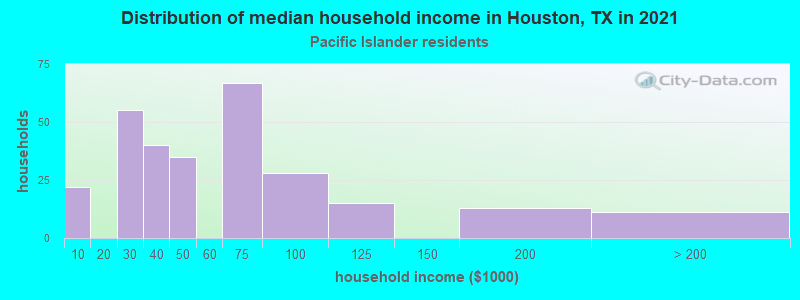
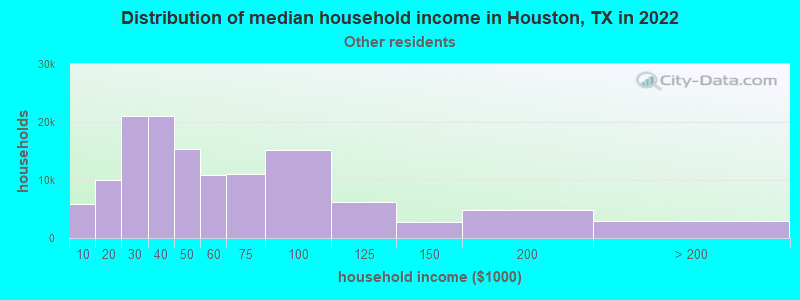
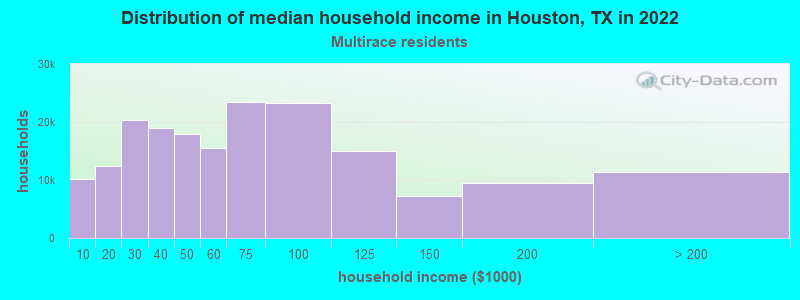
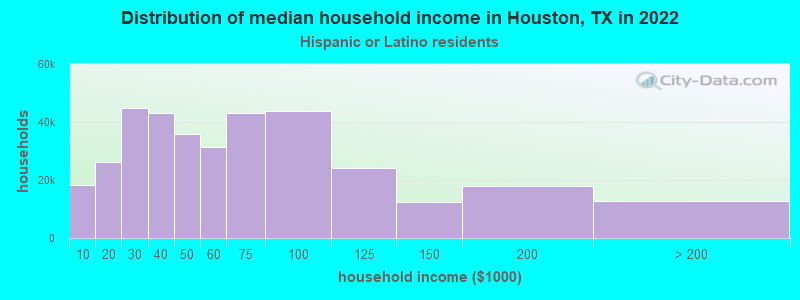
Income and house value in Houston Median household income in 2022 $95,589 White non-Hispanic householders$46,527 Black householders$52,740 American Indian and Alaska Native householders$82,622 Asian householders$43,914 Native Hawaiian and other Pacific Islander householders$42,839 Some other race householders$58,228 Two or more races householders$52,135 Hispanic or Latino race householdersMedian 2022 house value $394,470 White Non-Hispanic householders$182,249 Black or African American householders$238,060 American Indian or Alaska Native householders $296,972 Asian householders$285,259 Native Hawaiian and other Pacific Islander householders$196,718 Some other race householders$237,716 Two or more races householders$204,642 Hispanic or Latino householders
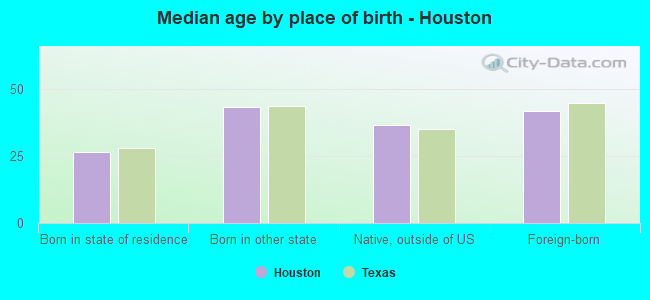
Median age by race in Houston
40.5 Median age for White residents40.4 40.7 34.8 Median age for Black or African American residents33.5 36.3 30.1 Median age for American Indian / Alaska Native residents28.0 32.4 36.1 Median age for Asian residents35.1 37.4 36.4 Median age for Native Hawaiian / Pacific Islander residents29.6 36.7 29.0 Median age for Other race residents29.7 28.3 31.6 Median age for Two or more races residents32.4 30.5 43.3 Median age for White alone residents42.7 44.3 30.6 Median age for Hispanic or Latino residents31.4 29.8
Owner/renter occupied households by race in Houston
House owners and renters - White residents 173,612 53.4% Owner occupied151,394 46.6% Renter occupiedHouse owners and renters - Black or African American residents 65,209 28.1% Owner occupied166,911 71.9% Renter occupiedHouse owners and renters - American Indian / Alaska Native residents 4,966 45.4% Owner occupied5,982 54.6% Renter occupiedHouse owners and renters - Asian residents 31,974 47.7% Owner occupied35,020 52.3% Renter occupiedHouse owners and renters - Native Hawaiian / Pacific Islander residents 341 57.7% Owner occupied250 42.3% Renter occupiedHouse owners and renters - Other race residents 36,280 28.6% Owner occupied90,628 71.4% Renter occupiedHouse owners and renters - Two or more races residents 73,994 40.0% Owner occupied111,071 60.0% Renter occupiedHouse owners and renters - White alone residents 150,848 55.6% Owner occupied120,267 44.4% Renter occupiedHouse owners and renters - Hispanic or Latino residents 129,443 36.6% Owner occupied224,154 63.4% Renter occupied
Language usage in Houston
English speakers - Total 51.5% of residents of Houston speak English at home.
38.9% of residents speak Spanish at home 403,486 48.2% Speak English very well433,007 51.8% Speak English less than very well9.6% of residents speak other language at home 135,087 65.6% Speak English very well70,987 34.4% Speak English less than very well
English speakers - Born in the United States 87.2% of residents of Houston speak English at home.
8.3% of residents speak Spanish at home 26,805 80.5% Speak English very well6,497 19.5% Speak English less than very well4.5% of residents speak other language at home 17,539 96.3% Speak English very well675 3.7% Speak English less than very well
English speakers - Native, born elsewhere 39.3% of residents of Houston speak English at home.
45.4% of residents speak Spanish at home 12,121 66.7% Speak English very well6,042 33.3% Speak English less than very well15.3% of residents speak other language at home 4,017 65.6% Speak English very well2,104 34.4% Speak English less than very well
English speakers - Foreign-born 10.4% of residents of Houston speak English at home.
66.4% of residents speak Spanish at home 103,222 23.3% Speak English very well340,520 76.7% Speak English less than very well23.2% of residents speak other language at home 90,793 58.7% Speak English very well63,940 41.3% Speak English less than very well
White (Caucasian) - Speak only English Native:
84.1% (462,808)Foreign-born:
23.5% (18,668)
White (Caucasian) - Speak another language Native:
15.9% (87,717)Foreign-born:
76.5% (60,681)
Black or African American - Speak only English Native:
96.3% (411,494)Foreign-born:
37.7% (15,868)
Black or African American - Speak another language Native:
3.7% (15,957)Foreign-born:
62.3% (26,219)
American Indian / Alaska Native - Speak only English Native:
37.6% (6,518)Foreign-born:
5.2% (890)
American Indian / Alaska Native - Speak another language Native:
62.4% (10,828)Foreign-born:
94.8% (16,328)
Asian - Speak only English Native:
47.3% (19,488)Foreign-born:
13.6% (14,696)
Asian - Speak another language Native:
52.7% (21,743)Foreign-born:
86.4% (93,232)
Native Hawaiian / Pacific Islander - Speak only English Native:
64.4% (654)Foreign-born:
4.7% (15)
Native Hawaiian / Pacific Islander - Speak another language Native:
36.2% (367)Foreign-born:
100.0% (309)
Other race - Speak only English Native:
19.4% (29,622)Foreign-born:
4.0% (8,755)
Other race - Speak another language Native:
80.6% (123,262)Foreign-born:
96.0% (211,252)
Two or more races - Speak only English Native:
36.8% (107,281)Foreign-born:
5.2% (10,469)
Two or more races - Speak another language Native:
63.2% (184,420)Foreign-born:
94.8% (190,327)
White alone - Speak only English Native:
93.5% (429,328)Foreign-born:
36.1% (16,895)
White alone - Speak another language Native:
6.5% (30,006)Foreign-born:
63.9% (29,871)
Hispanic or Latino - Speak only English Native:
26.2% (132,357)Foreign-born:
4.1% (18,876)
Hispanic or Latino - Speak another language Native:
73.8% (373,776)Foreign-born:
95.9% (443,629)
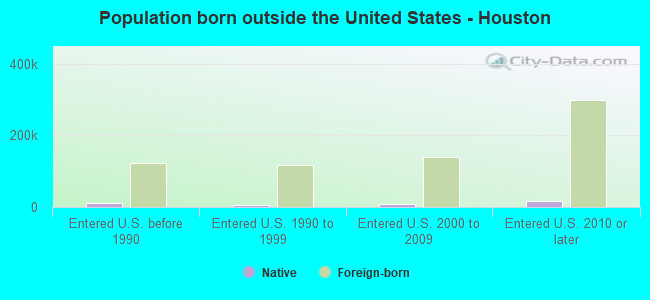
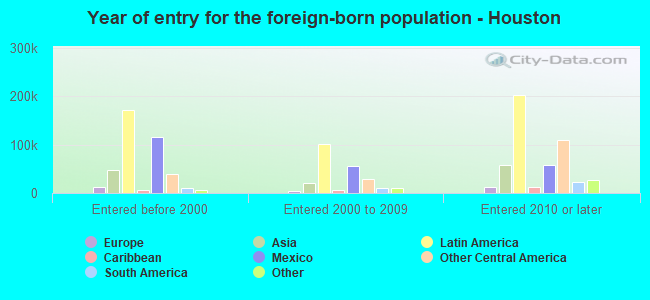
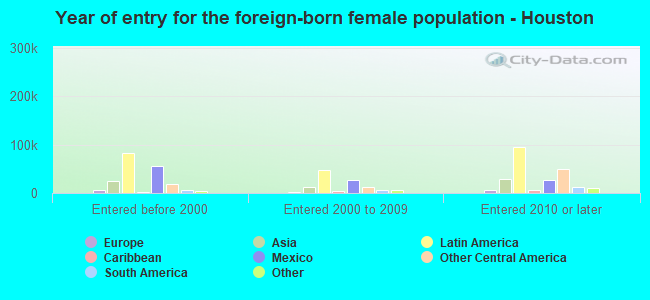
Foreign-born residents in Houston 676,712 residents are foreign born (20.7% Latin America , 5.5% Asia ).
This city:
29.4%Texas:
17.2%
Marital status for residents in Houston Marital status - White (Caucasian) population 15 years and over
Males 37.0% Never married49.8% Now married1.5% Separated2.7% Widowed8.9% DivorcedFemales 31.6% Never married46.0% Now married1.7% Separated8.3% Widowed12.5% DivorcedWomen who gave birth in the past 12 months Now married:
79.2% (8,951)Unmarried:
20.8% (2,346)
Women who did not give birth in the past 12 months Now married:
41.8% (62,569)Unmarried:
58.2% (87,245)
Marital status - Black or African American population 15 years and over
Males 54.6% Never married28.2% Now married4.7% Separated2.9% Widowed9.6% DivorcedFemales 51.2% Never married22.0% Now married3.2% Separated8.0% Widowed15.7% DivorcedWomen who gave birth in the past 12 months Now married:
33.0% (2,433)Unmarried:
67.0% (4,936)
Women who did not give birth in the past 12 months Now married:
21.0% (27,808)Unmarried:
79.0% (104,661)
Marital status - American Indian / Alaska Native population 15 years and over
Males 46.7% Never married38.0% Now married7.0% Separated0.3% Widowed8.1% DivorcedFemales 38.3% Never married39.2% Now married2.1% Separated10.2% Widowed10.2% DivorcedWomen who gave birth in the past 12 months Now married:
69.8% (204)Unmarried:
30.2% (88)
Women who did not give birth in the past 12 months Now married:
33.6% (2,939)Unmarried:
66.4% (5,803)
Marital status - Asian population 15 years and over
Males 37.3% Never married57.0% Now married0.7% Separated0.8% Widowed4.3% DivorcedFemales 29.4% Never married55.3% Now married0.6% Separated7.8% Widowed6.9% DivorcedWomen who gave birth in the past 12 months Now married:
90.6% (2,195)Unmarried:
9.4% (228)
Women who did not give birth in the past 12 months Now married:
52.2% (23,553)Unmarried:
47.8% (21,596)
Marital status - Native Hawaiian / Pacific Islander population 15 years and over
Males 71.1% Never married26.1% Now married0.0% Separated2.1% Widowed0.6% DivorcedFemales 34.2% Never married46.0% Now married3.6% Separated12.7% Widowed3.6% DivorcedWomen who gave birth in the past 12 months Now married:
0.0% (0)Unmarried:
100.0% (44)
Women who did not give birth in the past 12 months Now married:
51.6% (237)Unmarried:
48.4% (223)
Marital status - Other race population 15 years and over
Males 56.0% Never married35.3% Now married2.0% Separated1.5% Widowed5.1% DivorcedFemales 54.2% Never married32.6% Now married2.7% Separated4.6% Widowed5.9% DivorcedWomen who gave birth in the past 12 months Now married:
47.5% (2,238)Unmarried:
52.5% (2,469)
Women who did not give birth in the past 12 months Now married:
29.4% (32,219)Unmarried:
70.6% (77,274)
Marital status - Two or more races population 15 years and over
Males 46.7% Never married40.8% Now married2.8% Separated1.7% Widowed7.9% DivorcedFemales 42.2% Never married40.2% Now married3.5% Separated4.1% Widowed10.0% DivorcedWomen who gave birth in the past 12 months Now married:
69.6% (5,834)Unmarried:
30.4% (2,548)
Women who did not give birth in the past 12 months Now married:
36.6% (47,531)Unmarried:
63.4% (82,210)
Marital status - White alone, not Hispanic / Latino population 15 years and over
Males 35.2% Never married52.0% Now married1.1% Separated2.9% Widowed8.9% DivorcedFemales 28.7% Never married48.1% Now married1.2% Separated9.1% Widowed12.9% DivorcedWomen who gave birth in the past 12 months Now married:
89.5% (7,652)Unmarried:
10.5% (895)
Women who did not give birth in the past 12 months Now married:
43.7% (48,381)Unmarried:
56.3% (62,397)
Marital status - Hispanic or Latino population 15 years and over
Males 50.0% Never married38.6% Now married2.9% Separated1.6% Widowed6.9% DivorcedFemales 46.8% Never married36.9% Now married3.3% Separated4.6% Widowed8.4% DivorcedWomen who gave birth in the past 12 months Now married:
57.5% (8,943)Unmarried:
42.5% (6,601)
Women who did not give birth in the past 12 months Now married:
34.2% (93,184)Unmarried:
65.8% (178,920)
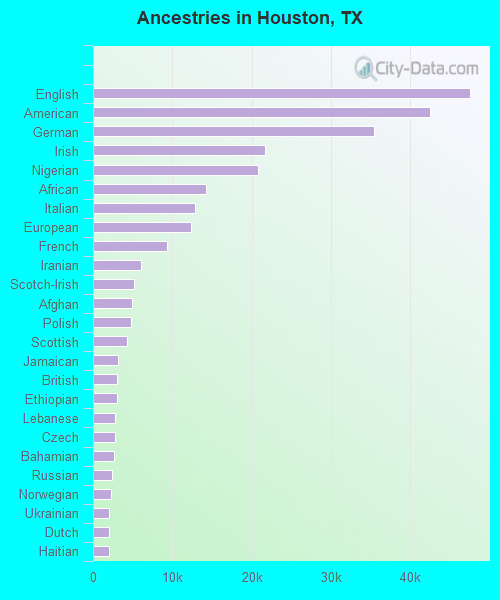
Ancestries in Houston
47,572 3.0% English42,463 2.7% American35,424 2.2% German21,723 1.4% Irish20,797 1.3% Nigerian14,273 0.9% African12,912 0.8% Italian12,334 0.8% European9,325 0.6% French6,065 0.4% Iranian5,172 0.3% Scotch-Irish4,895 0.3% Afghan4,766 0.3% Polish4,250 0.3% Scottish3,208 0.2% Jamaican3,071 0.2% British3,003 0.2% Ethiopian2,812 0.2% Lebanese2,765 0.2% Czech2,638 0.2% Bahamian2,354 0.1% Russian2,314 0.1% Norwegian1,988 0.1% Ukrainian1,967 0.1% Dutch1,966 0.1% Haitian1,843 0.1% Eastern European1,809 0.1% Jordanian1,663 0.1% Greek1,636 0.1% Ghanaian1,617 0.1% French Canadian1,557 0.10% Sudanese1,469 0.09% Turkish1,390 0.09% Palestinian1,348 0.08% Scandinavian1,230 0.08% Egyptian1,176 0.07% Swedish1,086 0.07% Iraqi1,019 0.06% Northern European1,000 0.06% Moroccan969 0.06% Arab903 0.06% Brazilian887 0.06% West Indian865 0.05% Israeli853 0.05% Hungarian778 0.05% Trinidadian and Tobagonian729 0.05% Sierra Leonean720 0.04% Slovak680 0.04% British West Indian680 0.04% Welsh625 0.04% Macedonian585 0.04% Swiss570 0.04% Canadian484 0.03% Basque445 0.03% Australian444 0.03% Guyanese407 0.03% Syrian357 0.02% Romanian356 0.02% South African347 0.02% Serbian344 0.02% Bulgarian312 0.02% Danish306 0.02% Yugoslavian281 0.02% Austrian265 0.02% Finnish259 0.02% Belgian254 0.02% Icelander242 0.02% Croatian237 0.01% Celtic236 0.01% Belizean227 0.01% Kenyan212 0.01% Slovene203 0.01% Lithuanian189 0.01% Czechoslovakian138 0.01% Slavic137 0.01% Cajun131 0.01% U.S. Virgin Islander116 0.01% Barbadian111 0.01% Latvian106 0.01% Armenian95 0.01% Liberian
Geographical mobility in Houston Same house 1 year ago 548,643 83.6% White (Caucasian)403,109 81.8% Black or African American32,508 89.1% American Indian / Alaska Native121,713 77.4% Asian1,192 80.3% Native Hawaiian / Pacific Islander356,253 87.8% Other race441,318 84.2% Two or more races440,115 84.0% White alone, not Hispanic / Latino894,171 86.1% Hispanic or LatinoMoved within same county 61,878 9.4% White / Caucasian64,236 13.0% Black or African American3,006 8.2% American Indian / Alaska Native15,694 10.0% Asian77 5.2% Native Hawaiian / Pacific Islander32,331 8.0% Other race52,564 10.0% Two or more races50,486 9.6% White alone, not Hispanic / Latino91,081 8.8% Hispanic or LatinoMoved within same state 19,698 3.0% White / Caucasian9,584 1.9% Black or African American575 1.6% American Indian / Alaska Native3,445 2.2% Asian48 3.2% Native Hawaiian / Pacific Islander4,275 1.1% Other race9,808 1.9% Two or more races14,256 2.7% White alone, not Hispanic / Latino18,151 1.7% Hispanic or LatinoMoved from different state 20,062 3.1% White / Caucasian12,795 2.6% Black or African American113 0.3% American Indian / Alaska Native6,579 4.2% Asian56 3.8% Native Hawaiian / Pacific Islander2,118 0.5% Other race7,171 1.4% Two or more races15,972 3.0% White alone, not Hispanic / Latino12,437 1.2% Hispanic or LatinoMoved from abroad 6,365 1.0% White3,247 0.7% Black or African American293 0.8% American Indian / Alaska Native9,758 6.2% Asian20 1.4% Native Hawaiian / Pacific Islander10,607 2.6% Other race13,026 2.5% Two or more races3,221 0.6% White alone, not Hispanic / Latino23,288 2.2% Hispanic or Latino
Children Nativity (place of birth) in Houston
Children under 6 years - Living with two parents Both parents native 43,310 100.0% NativeBoth parents foreign-born 26,935 78.8% Native7,266 21.2% Foreign-bornOne native, one foreign-born parent 16,898 96.2% Native664 3.8% Foreign-bornChildren under 6 years - Living with one parent Native parent 46,623 99.3% Native312 0.7% Foreign-bornForeign-born parent 36,047 91.7% Native3,243 8.3% Foreign-bornChildren 6 to 17 years - Living with two parents Both parents native 61,352 99.5% Native335 0.5% Foreign-bornBoth parents foreign-born 53,050 74.6% Native18,093 25.4% Foreign-bornOne native, one foreign-born parent 30,368 92.5% Native2,447 7.5% Foreign-bornChildren 6 to 17 years - Living with one parent Native parent 62,543 100.0% NativeForeign-born parent 66,374 57.1% Native49,923 42.9% Foreign-born
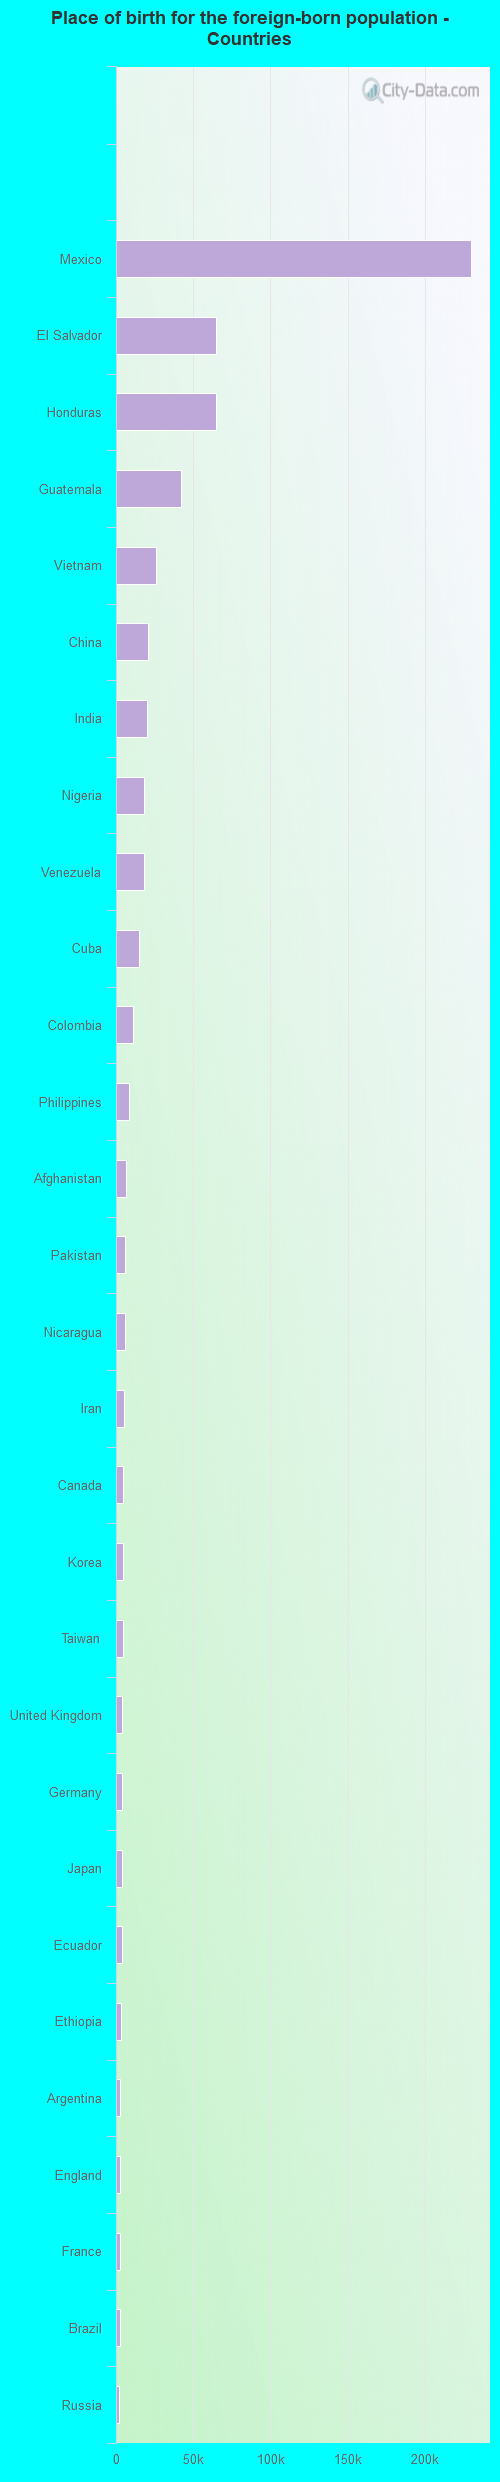
Place of birth for residents in Houston 482,220 Americas477,291 Latin America408,959 Central America126,866 Asia43,967 South America41,109 South Central Asia39,951 South Eastern Asia38,446 Africa35,217 Eastern Asia27,848 Europe27,016 China24,365 Caribbean23,675 Western Africa10,260 Western Asia8,929 Northern Europe7,994 Eastern Europe7,552 Western Europe6,594 Eastern Africa4,929 Northern America4,157 Northern Africa3,256 Southern Europe2,002 Middle Africa1,332 Oceania1,184 Southern Africa1,016 Australia and New Zealand Subregion230,074 Mexico65,055 El Salvador64,611 Honduras42,012 Guatemala25,975 Vietnam20,817 China20,347 India18,300 Nigeria17,906 Venezuela15,036 Cuba11,183 Colombia8,352 Philippines6,198 Afghanistan5,624 Pakistan5,591 Nicaragua5,275 Iran4,853 Canada4,582 Korea4,411 Taiwan4,113 United Kingdom3,773 Germany3,619 Japan3,617 Ecuador3,126 Ethiopia2,904 Argentina2,707 England2,643 France2,603 Brazil2,178 Russia1,957 Indonesia1,914 Spain1,825 Peru1,802 Dominican Republic1,788 Hong Kong1,758 Jamaica1,690 Kenya1,649 Bolivia1,641 Lebanon1,513 Ghana1,465 Turkey1,405 Sudan1,381 Iraq1,372 Bangladesh1,337 Jordan1,289 Ukraine1,216 Haiti1,184 South Africa1,169 Egypt1,146 Sri Lanka1,137 Trinidad and Tobago1,111 Malaysia1,107 Israel1,067 Cameroon878 Australia848 Morocco848 Sierra Leone831 Netherlands770 Saudi Arabia751 Burma (Myanmar)744 United Arab Emirates713 Greece699 Syria699 Belize689 Scotland676 St. Lucia629 Italy629 Bahamas584 Nepal575 Cambodia567 Sweden564 Thailand558 Uruguay555 Czechoslovakia546 Guyana531 West Indies527 Poland504 Algeria489 Azerbaijan472 Dominica448 Norway435 Singapore427 Costa Rica417 Romania404 Croatia379 Panama378 North Macedonia (Macedonia)367 Eritrea366 Ivory Coast366 Chile365 Uganda365 Hungary356 Kazakhstan354 Bosnia and Herzegovina344 Kuwait336 Togo287 Bulgaria236 Denmark231 Laos199 Austria171 Belarus169 Ireland168 Micronesia141 Liberia138 New Zealand116 Barbados112 Congo106 Serbia97 Albania94 Georgia75 Latvia74 Fiji66 Yemen57 Belgium57 Democratic Republic of Congo (Zaire)49 Switzerland27 Zimbabwe
Grandparents responsible for own grandchildren in Houston
Grandparents (30 to 59 years) White / Caucasian 1,585 70.9% Responsible for grandchildren650 29.1% Not responsible for grandchildrenBlack or African American 2,950 66.4% Responsible for grandchildren1,496 33.6% Not responsible for grandchildrenAmerican Indian / Alaska Native 124 30.5% Responsible for grandchildren282 69.5% Not responsible for grandchildrenAsian 163 72.1% Responsible for grandchildren63 27.9% Not responsible for grandchildrenNative Hawaiian / Pacific Islander 14 100.0% Responsible for grandchildrenOther race 1,618 28.3% Responsible for grandchildren4,093 71.7% Not responsible for grandchildrenTwo or more races 3,078 48.7% Responsible for grandchildren3,244 51.3% Not responsible for grandchildrenWhite alone, not Hispanic / Latino 494 62.3% Responsible for grandchildren299 37.7% Not responsible for grandchildrenHispanic or Latino 5,941 40.6% Responsible for grandchildren8,684 59.4% Not responsible for grandchildrenGrandparents (60 years and over) White / Caucasian 1,046 33.8% Responsible for grandchildren2,052 66.2% Not responsible for grandchildrenBlack or African American 1,455 29.0% Responsible for grandchildren3,564 71.0% Not responsible for grandchildrenAmerican Indian / Alaska Native 24 6.7% Responsible for grandchildren334 93.3% Not responsible for grandchildrenAsian 508 23.1% Responsible for grandchildren1,688 76.9% Not responsible for grandchildrenOther race 1,949 34.4% Responsible for grandchildren3,724 65.6% Not responsible for grandchildrenTwo or more races 1,361 23.3% Responsible for grandchildren4,485 76.7% Not responsible for grandchildrenWhite alone, not Hispanic / Latino 799 36.7% Responsible for grandchildren1,379 63.3% Not responsible for grandchildrenHispanic or Latino 3,501 27.0% Responsible for grandchildren9,447 73.0% Not responsible for grandchildren
Zip codes: 77002 , 77003 , 77004 , 77005 , 77006 , 77007 , 77008 , 77009 , 77010 , 77011 , 77012 , 77013 , 77014 , 77016 , 77017 , 77018 , 77019 , 77020 , 77021 , 77022 , 77023 , 77025 , 77026 , 77027 , 77028 , 77030 , 77031 , 77033 , 77034 , 77035 , 77036 , 77038 , 77040 , 77041 , 77042 , 77043 , 77045 , 77046 , 77047 , 77048 , 77050 , 77051 , 77053 , 77054 , 77056 , 77057 , 77058 , 77059 , 77061 , 77062 , 77063 , 77064 , 77065 , 77066 , 77067 , 77068 , 77069 , 77070 , 77071 , 77072 , 77073 , 77074 , 77075 , 77076 , 77077 , 77078 , 77079 , 77080 , 77081 , 77082 , 77084 , 77085 , 77086 , 77087 , 77088 , 77090 , 77091 , 77092 , 77093 , 77094 , 77095 , 77096 , 77098 , 77099 , 77201, 77336 , 77339 , 77345 , 77357 , 77365 , 77373 , 77375 , 77377 , 77379 , 77386 , 77388 , 77407 , 77429 , 77433 , 77447 , 77449 , 77478 , 77484 , 77489 , 77493 , 77504 , 77506 , 77587 .