Races in Huntington Beach, California (CA) Detailed Stats
Data:
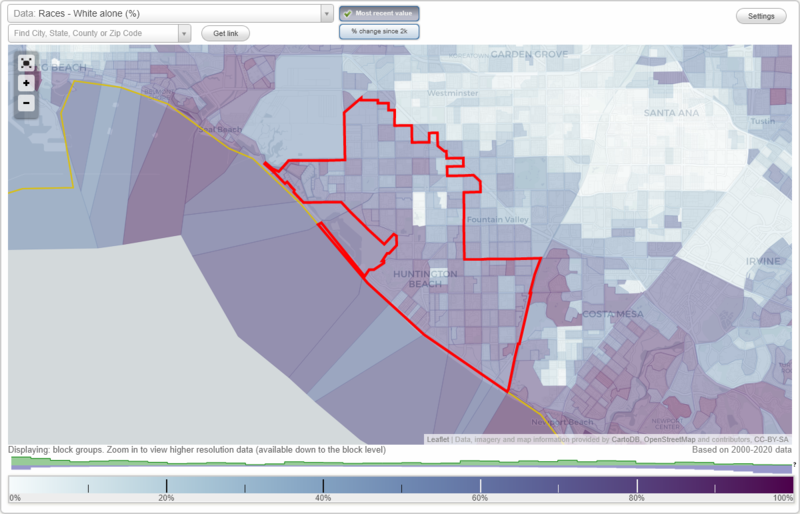
Races - White alone (%)
Races - White alone (% change since 2000)
Races - Black alone (%)
Races - Black alone (% change since 2000)
Races - American Indian alone (%)
Races - American Indian alone (% change since 2000)
Races - Asian alone (%)
Races - Asian alone (% change since 2000)
Races - Hispanic (%)
Races - Hispanic (% change since 2000)
Races - Native Hawaiian and Other Pacific Islander alone (%)
Races - Native Hawaiian and Other Pacific Islander alone (% change since 2000)
Races - Two or more races(%)
Races - Two or more races(% change since 2000)
Races - Other race alone (%)
Races - Other race alone (% change since 2000)
Racial diversity
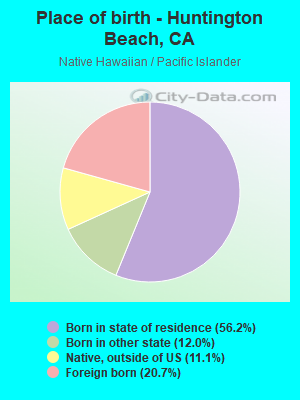
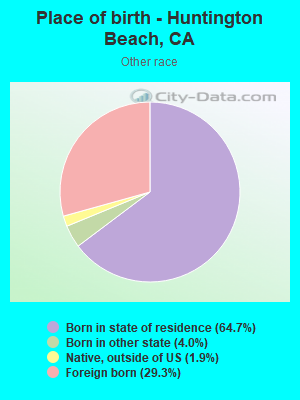
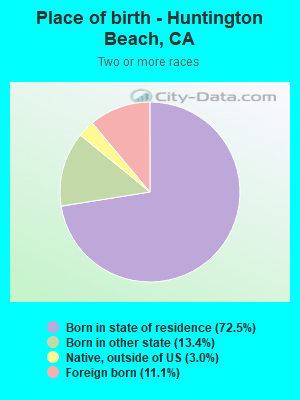
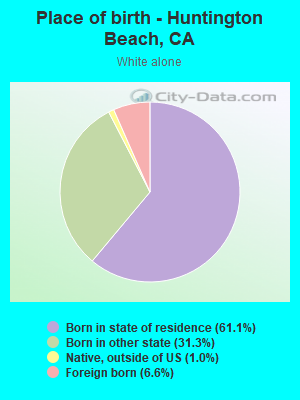
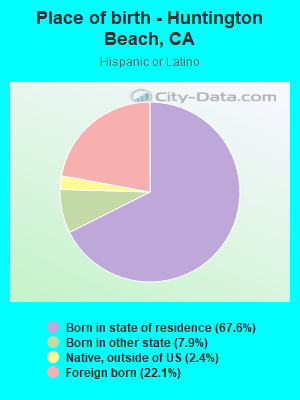
Place of birth - Born in state of residence (%)
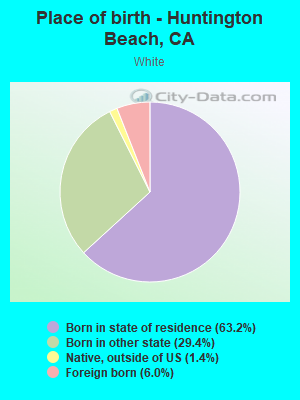
Place of birth - Born in state of residence (%) - White
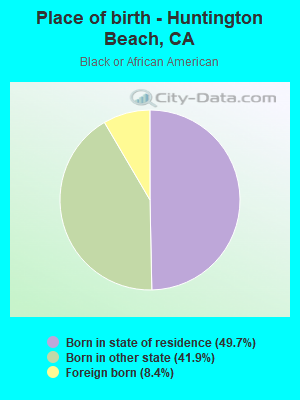
Place of birth - Born in state of residence (%) - Black or African American
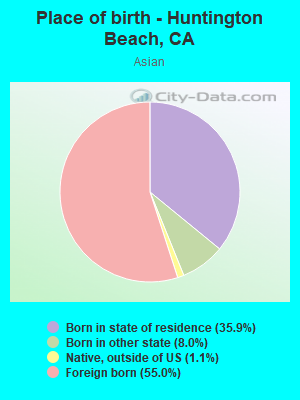
Place of birth - Born in state of residence (%) - Asian
Place of birth - Born in state of residence (%) - Hispanic or Latino
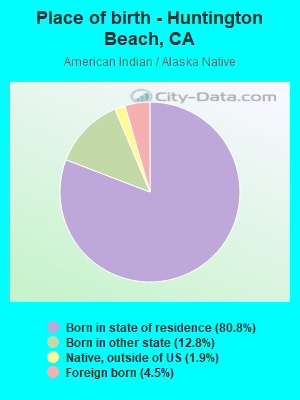
Place of birth - Born in state of residence (%) - American Indian and Alaska Native
Place of birth - Born in state of residence (%) - Multirace
Place of birth - Born in state of residence (%) - Other Race
Place of birth - Born in other state (%)
Place of birth - Born in other state (%) - White
Place of birth - Born in other state (%) - Black or African American
Place of birth - Born in other state (%) - Asian
Place of birth - Born in other state (%) - Hispanic or Latino
Place of birth - Born in other state (%) - American Indian and Alaska Native
Place of birth - Born in other state (%) - Multirace
Place of birth - Born in other state (%) - Other Race
Place of birth - Native, outside of US (%)
Place of birth - Native, outside of US (%) - White
Place of birth - Native, outside of US (%) - Black or African American
Place of birth - Native, outside of US (%) - Asian
Place of birth - Native, outside of US (%) - Hispanic or Latino
Place of birth - Native, outside of US (%) - American Indian and Alaska Native
Place of birth - Native, outside of US (%) - Multirace
Place of birth - Native, outside of US (%) - Other Race
Place of birth - Foreign born (%)
Place of birth - Foreign born (%) - White
Place of birth - Foreign born (%) - Black or African American
Place of birth - Foreign born (%) - Asian
Place of birth - Foreign born (%) - Hispanic or Latino
Place of birth - Foreign born (%) - American Indian and Alaska Native
Place of birth - Foreign born (%) - Multirace
Place of birth - Foreign born (%) - Other Race
Residents speaking English at home (%)
Residents speaking English at home - Born in the United States (%)
Residents speaking English at home - Native, born elsewhere (%)
Residents speaking English at home - Foreign born (%)
Residents speaking Spanish at home (%)
Residents speaking Spanish at home - Born in the United States (%)
Residents speaking Spanish at home - Native, born elsewhere (%)
Residents speaking Spanish at home - Foreign born (%)
Residents speaking other language at home (%)
Residents speaking other language at home - Born in the United States (%)
Residents speaking other language at home - Native, born elsewhere (%)
Residents speaking other language at home - Foreign born (%)
Marital status - Never married (%)
Marital status - Now married (%)
Marital status - Separated (%)
Marital status - Widowed (%)
Marital status - Divorced (%)
Ancestries Reported - Arab (%)
Ancestries Reported - Czech (%)
Ancestries Reported - Danish (%)
Ancestries Reported - Dutch (%)
Ancestries Reported - English (%)
Ancestries Reported - French (%)
Ancestries Reported - French Canadian (%)
Ancestries Reported - German (%)
Ancestries Reported - Greek (%)
Ancestries Reported - Hungarian (%)
Ancestries Reported - Irish (%)
Ancestries Reported - Italian (%)
Ancestries Reported - Lithuanian (%)
Ancestries Reported - Norwegian (%)
Ancestries Reported - Polish (%)
Ancestries Reported - Portuguese (%)
Ancestries Reported - Russian (%)
Ancestries Reported - Scotch-Irish (%)
Ancestries Reported - Scottish (%)
Ancestries Reported - Slovak (%)
Ancestries Reported - Subsaharan African (%)
Ancestries Reported - Swedish (%)
Ancestries Reported - Swiss (%)
Ancestries Reported - Ukrainian (%)
Ancestries Reported - United States (%)
Ancestries Reported - Welsh (%)
Ancestries Reported - West Indian (%)
Ancestries Reported - Other (%)
Geographical mobility - Same house 1 year ago (%)
Geographical mobility - Same house 1 year ago (%) - White
Geographical mobility - Same house 1 year ago (%) - Black or African American
Geographical mobility - Same house 1 year ago (%) - Asian
Geographical mobility - Same house 1 year ago (%) - Hispanic or Latino
Geographical mobility - Same house 1 year ago (%) - American Indian and Alaska Native
Geographical mobility - Same house 1 year ago (%) - Multirace
Geographical mobility - Same house 1 year ago (%) - Other Race
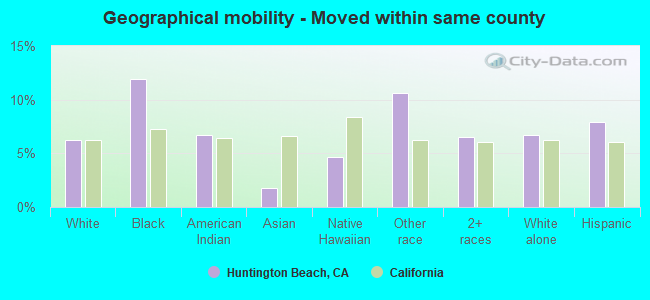
Geographical mobility - Moved within same county (%)
Geographical mobility - Moved within same county (%) - White
Geographical mobility - Moved within same county (%) - Black or African American
Geographical mobility - Moved within same county (%) - Asian
Geographical mobility - Moved within same county (%) - Hispanic or Latino
Geographical mobility - Moved within same county (%) - American Indian and Alaska Native
Geographical mobility - Moved within same county (%) - Multirace
Geographical mobility - Moved within same county (%) - Other Race
Geographical mobility - Moved from different county within same state (%)
Geographical mobility - Moved from different county within same state (%) - White
Geographical mobility - Moved from different county within same state (%) - Black or African American
Geographical mobility - Moved from different county within same state (%) - Asian
Geographical mobility - Moved from different county within same state (%) - Hispanic or Latino
Geographical mobility - Moved from different county within same state (%) - American Indian and Alaska Native
Geographical mobility - Moved from different county within same state (%) - Multirace
Geographical mobility - Moved from different county within same state (%) - Other Race
Geographical mobility - Moved from different state (%)
Geographical mobility - Moved from different state (%) - White
Geographical mobility - Moved from different state (%) - Black or African American
Geographical mobility - Moved from different state (%) - Asian
Geographical mobility - Moved from different state (%) - Hispanic or Latino
Geographical mobility - Moved from different state (%) - American Indian and Alaska Native
Geographical mobility - Moved from different state (%) - Multirace
Geographical mobility - Moved from different state (%) - Other Race
Geographical mobility - Moved from abroad (%)
Geographical mobility - Moved from abroad (%) - White
Geographical mobility - Moved from abroad (%) - Black or African American
Geographical mobility - Moved from abroad (%) - Asian
Geographical mobility - Moved from abroad (%) - Hispanic or Latino
Geographical mobility - Moved from abroad (%) - American Indian and Alaska Native
Geographical mobility - Moved from abroad (%) - Multirace
Geographical mobility - Moved from abroad (%) - Other Race
Place of birth for the foreign-born population - Ireland (%)
Place of birth for the foreign-born population - Denmark (%)
Place of birth for the foreign-born population - Norway (%)
Place of birth for the foreign-born population - Sweden (%)
Place of birth for the foreign-born population - United Kingdom (%)
Place of birth for the foreign-born population - England (%)
Place of birth for the foreign-born population - Scotland (%)
Place of birth for the foreign-born population - Other Northern Europe (%)
Place of birth for the foreign-born population - Austria (%)
Place of birth for the foreign-born population - Belgium (%)
Place of birth for the foreign-born population - France (%)
Place of birth for the foreign-born population - Germany (%)
Place of birth for the foreign-born population - Netherlands (%)
Place of birth for the foreign-born population - Switzerland (%)
Place of birth for the foreign-born population - Other Western Europe (%)
Place of birth for the foreign-born population - Greece (%)
Place of birth for the foreign-born population - Italy (%)
Place of birth for the foreign-born population - Portugal (%)
Place of birth for the foreign-born population - Spain (%)
Place of birth for the foreign-born population - Other Southern Europe (%)
Place of birth for the foreign-born population - Albania (%)
Place of birth for the foreign-born population - Belarus (%)
Place of birth for the foreign-born population - Bosnia and Herzegovina (%)
Place of birth for the foreign-born population - Bulgaria (%)
Place of birth for the foreign-born population - Croatia (%)
Place of birth for the foreign-born population - Czechoslovakia (%)
Place of birth for the foreign-born population - Hungary (%)
Place of birth for the foreign-born population - Latvia (%)
Place of birth for the foreign-born population - Lithuania (%)
Place of birth for the foreign-born population - North Macedonia (Macedonia) (%)
Place of birth for the foreign-born population - Moldova (%)
Place of birth for the foreign-born population - Poland (%)
Place of birth for the foreign-born population - Romania (%)
Place of birth for the foreign-born population - Russia (%)
Place of birth for the foreign-born population - Serbia (%)
Place of birth for the foreign-born population - Ukraine (%)
Place of birth for the foreign-born population - Other Eastern Europe (%)
Place of birth for the foreign-born population - China (%)
Place of birth for the foreign-born population - Hong Kong (%)
Place of birth for the foreign-born population - Taiwan (%)
Place of birth for the foreign-born population - Japan (%)
Place of birth for the foreign-born population - Korea (%)
Place of birth for the foreign-born population - Other Eastern Asia (%)
Place of birth for the foreign-born population - Afghanistan (%)
Place of birth for the foreign-born population - Bangladesh (%)
Place of birth for the foreign-born population - India (%)
Place of birth for the foreign-born population - Iran (%)
Place of birth for the foreign-born population - Kazakhstan (%)
Place of birth for the foreign-born population - Nepal (%)
Place of birth for the foreign-born population - Pakistan (%)
Place of birth for the foreign-born population - Sri Lanka (%)
Place of birth for the foreign-born population - Uzbekistan (%)
Place of birth for the foreign-born population - Other South Central Asia (%)
Place of birth for the foreign-born population - Burma (%)
Place of birth for the foreign-born population - Cambodia (%)
Place of birth for the foreign-born population - Indonesia (%)
Place of birth for the foreign-born population - Laos (%)
Place of birth for the foreign-born population - Malaysia (%)
Place of birth for the foreign-born population - Philippines (%)
Place of birth for the foreign-born population - Singapore (%)
Place of birth for the foreign-born population - Thailand (%)
Place of birth for the foreign-born population - Vietnam (%)
Place of birth for the foreign-born population - Other South Eastern Asia (%)
Place of birth for the foreign-born population - Armenia (%)
Place of birth for the foreign-born population - Iraq (%)
Place of birth for the foreign-born population - Israel (%)
Place of birth for the foreign-born population - Jordan (%)
Place of birth for the foreign-born population - Kuwait (%)
Place of birth for the foreign-born population - Lebanon (%)
Place of birth for the foreign-born population - Saudi Arabia (%)
Place of birth for the foreign-born population - Syria (%)
Place of birth for the foreign-born population - Turkey (%)
Place of birth for the foreign-born population - Yemen (%)
Place of birth for the foreign-born population - Other Western Asia (%)
Place of birth for the foreign-born population - Eritrea (%)
Place of birth for the foreign-born population - Ethiopia (%)
Place of birth for the foreign-born population - Kenya (%)
Place of birth for the foreign-born population - Somalia (%)
Place of birth for the foreign-born population - Uganda (%)
Place of birth for the foreign-born population - Zimbabwe (%)
Place of birth for the foreign-born population - Other Eastern Africa (%)
Place of birth for the foreign-born population - Cameroon (%)
Place of birth for the foreign-born population - Congo (%)
Place of birth for the foreign-born population - Democratic Republic of Congo (Zaire) (%)
Place of birth for the foreign-born population - Other Middle Africa (%)
Place of birth for the foreign-born population - Egypt (%)
Place of birth for the foreign-born population - Morocco (%)
Place of birth for the foreign-born population - Sudan (%)
Place of birth for the foreign-born population - Other Northern Africa (%)
Place of birth for the foreign-born population - South Africa (%)
Place of birth for the foreign-born population - Other Southern Africa (%)
Place of birth for the foreign-born population - Cabo Verde (%)
Place of birth for the foreign-born population - Ghana (%)
Place of birth for the foreign-born population - Liberia (%)
Place of birth for the foreign-born population - Nigeria (%)
Place of birth for the foreign-born population - Senegal (%)
Place of birth for the foreign-born population - Sierra Leone (%)
Place of birth for the foreign-born population - Other Western Africa (%)
Place of birth for the foreign-born population - Australia (%)
Place of birth for the foreign-born population - New Zealand (%)
Place of birth for the foreign-born population - Fiji (%)
Place of birth for the foreign-born population - Micronesia (%)
Place of birth for the foreign-born population - Bahamas (%)
Place of birth for the foreign-born population - Barbados (%)
Place of birth for the foreign-born population - Cuba (%)
Place of birth for the foreign-born population - Dominica (%)
Place of birth for the foreign-born population - Dominican Republic (%)
Place of birth for the foreign-born population - Grenada (%)
Place of birth for the foreign-born population - Haiti (%)
Place of birth for the foreign-born population - Jamaica (%)
Place of birth for the foreign-born population - St. Vincent and the Grenadines (%)
Place of birth for the foreign-born population - Trinidad and Tobago (%)
Place of birth for the foreign-born population - West Indies (%)
Place of birth for the foreign-born population - Other Caribbean (%)
Place of birth for the foreign-born population - Belize (%)
Place of birth for the foreign-born population - Costa Rica (%)
Place of birth for the foreign-born population - El Salvador (%)
Place of birth for the foreign-born population - Guatemala (%)
Place of birth for the foreign-born population - Honduras (%)
Place of birth for the foreign-born population - Mexico (%)
Place of birth for the foreign-born population - Nicaragua (%)
Place of birth for the foreign-born population - Panama (%)
Place of birth for the foreign-born population - Other Central America (%)
Place of birth for the foreign-born population - Argentina (%)
Place of birth for the foreign-born population - Bolivia (%)
Place of birth for the foreign-born population - Brazil (%)
Place of birth for the foreign-born population - Chile (%)
Place of birth for the foreign-born population - Colombia (%)
Place of birth for the foreign-born population - Ecuador (%)
Place of birth for the foreign-born population - Guyana (%)
Place of birth for the foreign-born population - Peru (%)
Place of birth for the foreign-born population - Uruguay (%)
Place of birth for the foreign-born population - Venezuela (%)
Place of birth for the foreign-born population - Other South America (%)
Place of birth for the foreign-born population - Canada (%)
Place of birth for the foreign-born population - Other Northern America (%)
Place of birth for the foreign-born population - Other (%)
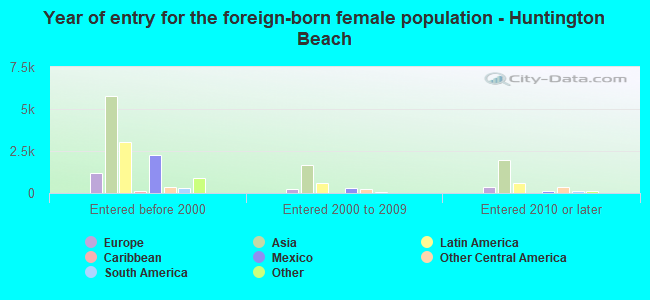
According to 2022 data, the most numerous races in Huntington Beach, CA are Hispanic (44,434 residents), White alone (111,077 residents), and Asian alone (26,518 residents). 78.0% of Huntington Beach residents speak English at home. 16.3% of Huntington Beach, CA residents are foreign-born (7.5% born in Asia, 5.1% born in Latin America, 2.1% born in Europe), which is 59.8% less than the foreign-born rate of 26.0% across the entire state of California.
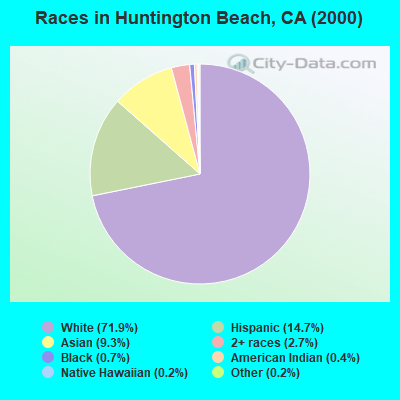
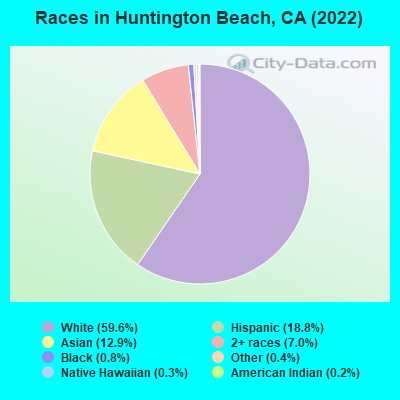
Race distribution in Huntington Beach
2000 2022
136,237 71.9% White alone 27,798 14.7% Hispanic 17,544 9.3% Asian alone 5,109 2.7% Two or more races 1,383 0.7% Black alone 777 0.4% American Indian alone 314 0.2% Other race alone 432 0.2% Native Hawaiian and Other
111,077 55.7% White alone 44,434 22.3% Hispanic 26,518 13.3% Asian alone 10,933 5.5% Two or more races 1,989 1.0% Black alone 1,331 0.7% Native Hawaiian and Other 735 0.4% American Indian alone 128 0.06% Other race alone
2000 2022
15,816,790 46.7% White alone 10,966,556 32.4% Hispanic 3,648,860 10.8% Asian alone 2,181,926 6.4% Black alone 903,115 2.7% Two or more races 178,984 0.5% American Indian alone 103,736 0.3% Native Hawaiian and Other 71,681 0.2% Other race alone
15,732,184 40.3% Hispanic 13,160,426 33.7% White alone 5,957,867 15.3% Asian alone 2,025,218 5.2% Black alone 1,663,222 4.3% Two or more races 251,618 0.6% Other race alone 135,777 0.3% Native Hawaiian and Other 103,030 0.3% American Indian alone
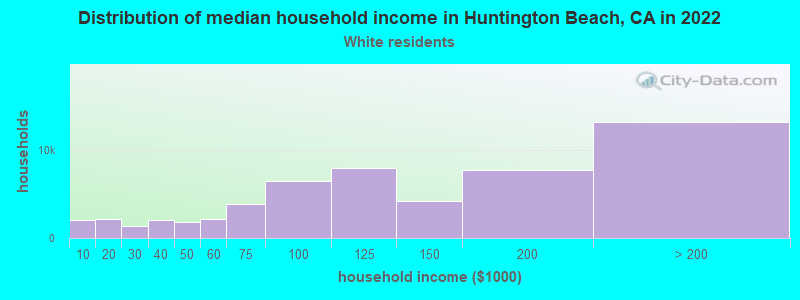
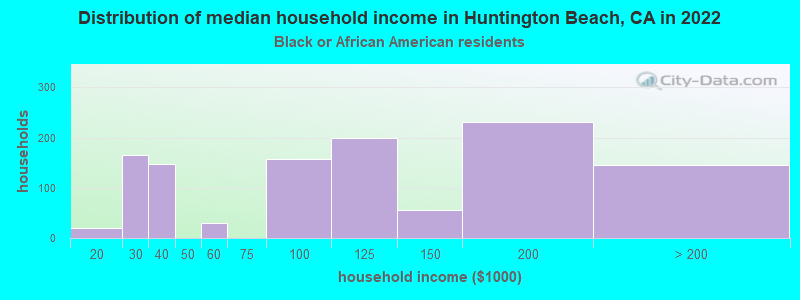
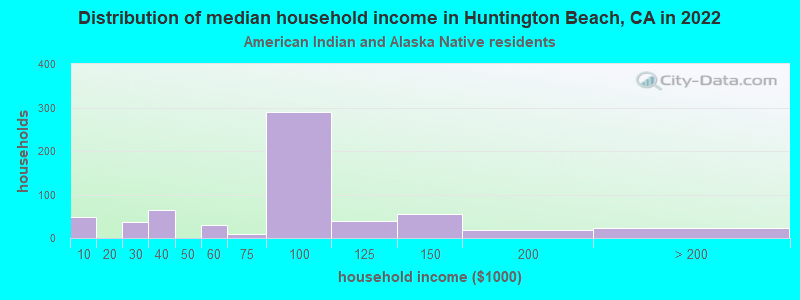
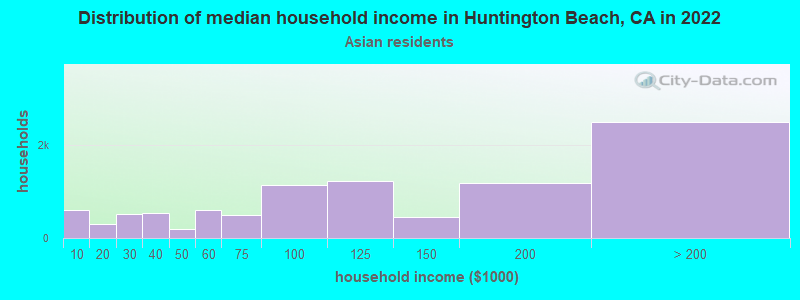
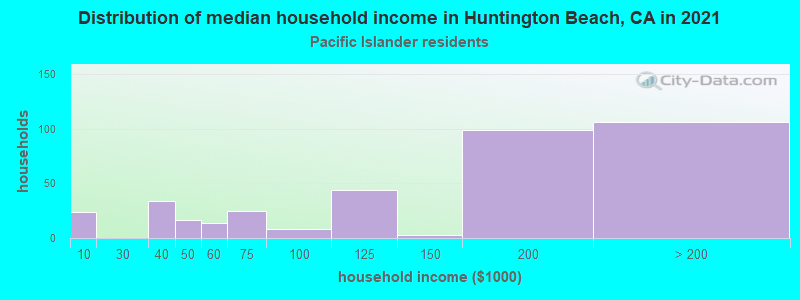
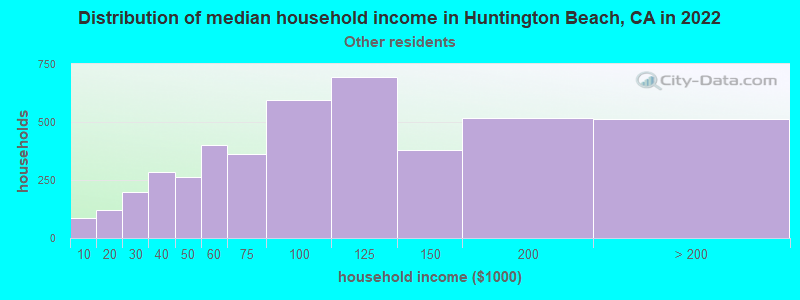
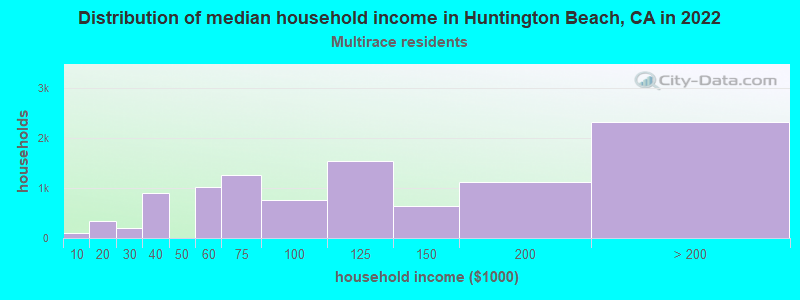
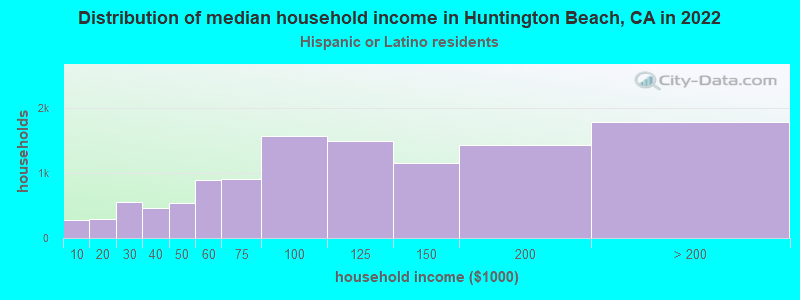
Income and house value in Huntington Beach Median household income in 2022 $132,777 White non-Hispanic householders$96,389 Black householders$121,485 American Indian and Alaska Native householders$139,944 Asian householders$199,036 Native Hawaiian and other Pacific Islander householders$87,167 Some other race householders$73,501 Two or more races householders$108,248 Hispanic or Latino race householdersMedian 2022 house value over $1,000,000 White Non-Hispanic householdersover $1,000,000 Black or African American householders$902,343 American Indian or Alaska Native householders over $1,000,000 Asian householders$702,582 Native Hawaiian and other Pacific Islander householdersover $1,000,000 Some other race householdersover $1,000,000 Two or more races householdersover $1,000,000 Hispanic or Latino householders
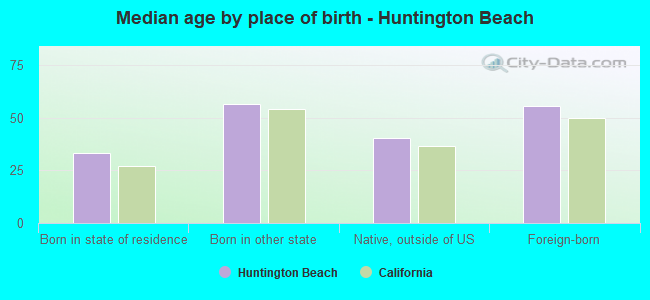
Median age by race in Huntington Beach
49.9 Median age for White residents49.7 50.1 49.0 Median age for Black or African American residents51.2 41.6 17.9 Median age for American Indian / Alaska Native residents2.1 27.7 50.7 Median age for Asian residents47.1 52.0 25.4 Median age for Native Hawaiian / Pacific Islander residents23.1 51.8 28.9 Median age for Other race residents29.4 28.1 38.4 Median age for Two or more races residents39.3 37.3 49.4 Median age for White alone residents48.4 50.1 31.4 Median age for Hispanic or Latino residents30.9 31.9
Owner/renter occupied households by race in Huntington Beach
House owners and renters - White residents 29,611 60.8% Owner occupied19,123 39.2% Renter occupiedHouse owners and renters - Black or African American residents 398 37.3% Owner occupied668 62.7% Renter occupiedHouse owners and renters - American Indian / Alaska Native residents 156 46.0% Owner occupied183 54.0% Renter occupiedHouse owners and renters - Asian residents 6,613 69.9% Owner occupied2,841 30.1% Renter occupiedHouse owners and renters - Native Hawaiian / Pacific Islander residents 405 61.9% Owner occupied250 38.1% Renter occupiedHouse owners and renters - Other race residents 822 15.8% Owner occupied4,369 84.2% Renter occupiedHouse owners and renters - Two or more races residents 2,694 20.9% Owner occupied10,195 79.1% Renter occupiedHouse owners and renters - White alone residents 29,570 60.4% Owner occupied19,348 39.6% Renter occupiedHouse owners and renters - Hispanic or Latino residents 3,798 33.1% Owner occupied7,666 66.9% Renter occupied
Language usage in Huntington Beach
English speakers - Total 78.0% of residents of Huntington Beach speak English at home.
10.4% of residents speak Spanish at home 14,279 71.7% Speak English very well5,646 28.3% Speak English less than very well12.0% of residents speak other language at home 14,666 63.8% Speak English very well8,310 36.2% Speak English less than very well
English speakers - Born in the United States 93.8% of residents of Huntington Beach speak English at home.
2.8% of residents speak Spanish at home 1,153 91.1% Speak English very well112 8.9% Speak English less than very well3.3% of residents speak other language at home 1,277 86.2% Speak English very well204 13.8% Speak English less than very well
English speakers - Native, born elsewhere 77.6% of residents of Huntington Beach speak English at home.
12.9% of residents speak Spanish at home 306 82.7% Speak English very well64 17.3% Speak English less than very well9.8% of residents speak other language at home 171 60.9% Speak English very well110 39.1% Speak English less than very well
English speakers - Foreign-born 25.6% of residents of Huntington Beach speak English at home.
25.3% of residents speak Spanish at home 3,794 47.1% Speak English very well4,265 52.9% Speak English less than very well51.7% of residents speak other language at home 9,211 56.1% Speak English very well7,219 43.9% Speak English less than very well
White (Caucasian) - Speak only English Native:
100.0% (101,036)Foreign-born:
45.3% (2,992)
White (Caucasian) - Speak another language Native:
4.0% (4,021)Foreign-born:
62.9% (4,154)
Black or African American - Speak only English Native:
95.2% (2,239)Foreign-born:
66.3% (199)
Black or African American - Speak another language Native:
4.8% (114)Foreign-born:
24.8% (74)
American Indian / Alaska Native - Speak another language Native:
5.2% (49)Foreign-born:
100.0% (49)
Asian - Speak only English Native:
71.5% (7,343)Foreign-born:
17.1% (2,646)
Asian - Speak another language Native:
29.4% (3,022)Foreign-born:
83.5% (12,942)
Native Hawaiian / Pacific Islander - Speak only English Native:
68.6% (447)Foreign-born:
16.3% (33)
Native Hawaiian / Pacific Islander - Speak another language Native:
30.3% (198)Foreign-born:
83.9% (171)
Other race - Speak only English Native:
57.3% (10,335)Foreign-born:
28.4% (1,915)
Other race - Speak another language Native:
46.1% (8,310)Foreign-born:
78.4% (5,280)
Two or more races - Speak only English Native:
64.4% (14,936)Foreign-born:
18.9% (628)
Two or more races - Speak another language Native:
33.6% (7,785)Foreign-born:
75.8% (2,515)
White alone - Speak only English Native:
96.6% (97,825)Foreign-born:
45.1% (2,888)
White alone - Speak another language Native:
3.3% (3,324)Foreign-born:
54.6% (3,500)
Hispanic or Latino - Speak only English Native:
66.3% (20,977)Foreign-born:
21.3% (2,063)
Hispanic or Latino - Speak another language Native:
35.6% (11,273)Foreign-born:
82.8% (8,029)
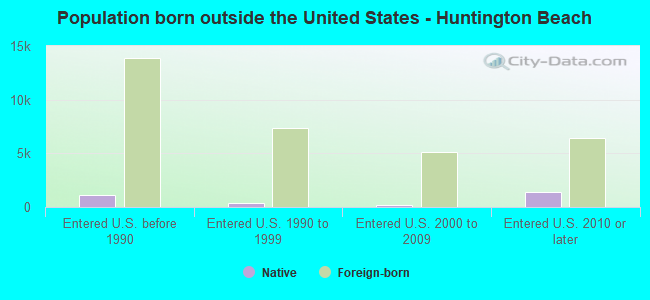
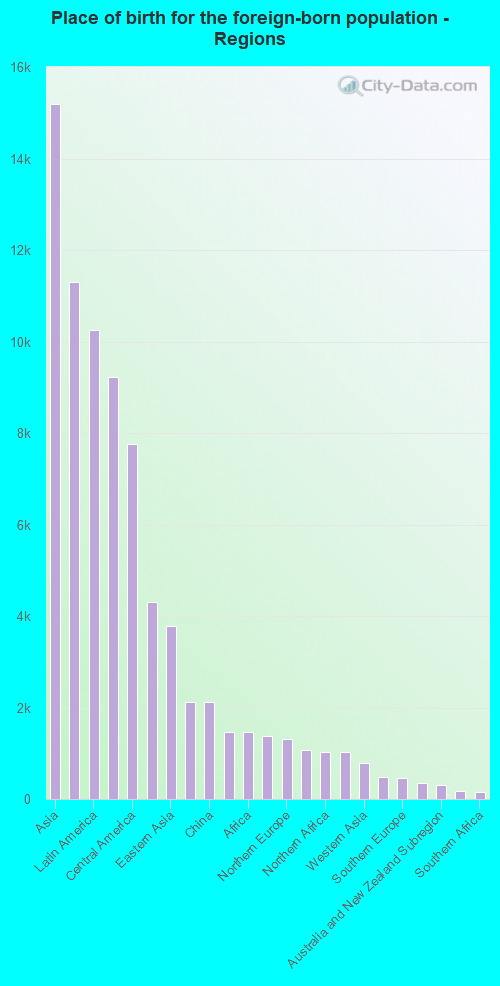
Foreign-born residents in Huntington Beach 32,731 residents are foreign born (7.5% Asia , 5.1% Latin America , 2.1% Europe ).
This city:
16.3%California:
100.0%
Marital status for residents in Huntington Beach Marital status - White (Caucasian) population 15 years and over
Males 36.6% Never married49.2% Now married1.2% Separated2.2% Widowed10.8% DivorcedFemales 30.4% Never married46.3% Now married0.8% Separated7.8% Widowed14.6% DivorcedWomen who gave birth in the past 12 months Now married:
67.4% (810)Unmarried:
32.6% (392)
Women who did not give birth in the past 12 months Now married:
36.8% (7,954)Unmarried:
63.2% (13,665)
Marital status - Black or African American population 15 years and over
Males 43.9% Never married39.8% Now married4.7% Separated2.1% Widowed9.5% DivorcedFemales 48.2% Never married31.6% Now married1.2% Separated5.6% Widowed13.4% DivorcedWomen who gave birth in the past 12 months Now married:
0.0% (0)Unmarried:
100.0% (11)
Women who did not give birth in the past 12 months Now married:
32.2% (214)Unmarried:
67.8% (451)
Marital status - American Indian / Alaska Native population 15 years and over
Males 30.0% Never married47.5% Now married5.4% Separated0.0% Widowed17.0% DivorcedFemales 21.4% Never married62.2% Now married0.0% Separated0.0% Widowed16.4% DivorcedWomen who gave birth in the past 12 months Now married:
100.0% (8)Unmarried:
0.0% (0)
Women who did not give birth in the past 12 months Now married:
62.3% (303)Unmarried:
37.7% (183)
Marital status - Asian population 15 years and over
Males 28.8% Never married64.1% Now married2.3% Separated2.1% Widowed2.6% DivorcedFemales 24.3% Never married55.5% Now married1.5% Separated11.5% Widowed7.2% DivorcedWomen who gave birth in the past 12 months Now married:
100.0% (221)Unmarried:
0.0% (0)
Women who did not give birth in the past 12 months Now married:
49.1% (2,957)Unmarried:
50.9% (3,066)
Marital status - Native Hawaiian / Pacific Islander population 15 years and over
Males 51.5% Never married33.9% Now married0.0% Separated0.0% Widowed14.5% DivorcedFemales 46.4% Never married42.7% Now married1.8% Separated0.0% Widowed9.0% DivorcedWomen who gave birth in the past 12 months Now married:
100.0% (9)Unmarried:
0.0% (0)
Women who did not give birth in the past 12 months Now married:
23.2% (62)Unmarried:
76.8% (204)
Marital status - Other race population 15 years and over
Males 46.3% Never married43.0% Now married0.0% Separated0.0% Widowed10.7% DivorcedFemales 49.5% Never married39.8% Now married0.0% Separated3.1% Widowed7.6% DivorcedWomen who gave birth in the past 12 months Now married:
100.0% (590)Unmarried:
0.0% (0)
Women who did not give birth in the past 12 months Now married:
32.1% (1,859)Unmarried:
67.9% (3,925)
Marital status - Two or more races population 15 years and over
Males 39.2% Never married51.0% Now married0.0% Separated5.3% Widowed4.5% DivorcedFemales 50.5% Never married28.6% Now married0.0% Separated1.7% Widowed19.2% DivorcedWomen who gave birth in the past 12 months Now married:
100.0% (358)Unmarried:
0.0% (0)
Women who did not give birth in the past 12 months Now married:
30.6% (2,395)Unmarried:
69.4% (5,441)
Marital status - White alone, not Hispanic / Latino population 15 years and over
Males 35.1% Never married50.4% Now married1.4% Separated2.5% Widowed10.6% DivorcedFemales 29.1% Never married47.2% Now married1.0% Separated8.5% Widowed14.3% DivorcedWomen who gave birth in the past 12 months Now married:
65.1% (870)Unmarried:
34.9% (467)
Women who did not give birth in the past 12 months Now married:
39.2% (8,511)Unmarried:
60.8% (13,199)
Marital status - Hispanic or Latino population 15 years and over
Males 45.6% Never married42.3% Now married0.0% Separated0.9% Widowed11.2% DivorcedFemales 45.3% Never married39.9% Now married0.0% Separated2.7% Widowed12.1% DivorcedWomen who gave birth in the past 12 months Now married:
100.0% (626)Unmarried:
0.0% (0)
Women who did not give birth in the past 12 months Now married:
29.0% (3,109)Unmarried:
71.0% (7,626)
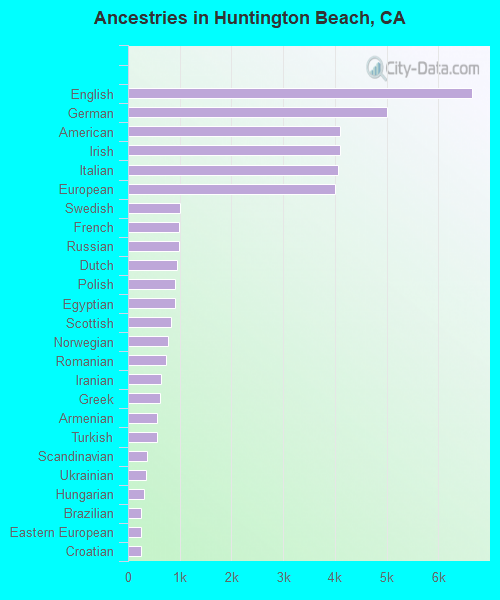
Ancestries in Huntington Beach
4,780 5.7% German4,722 5.7% English4,597 5.5% American4,157 5.0% Irish4,004 4.8% European3,482 4.2% Italian1,222 1.5% Egyptian974 1.2% Scottish951 1.1% Russian898 1.1% Polish787 0.9% Norwegian635 0.8% Dutch592 0.7% French583 0.7% Northern European575 0.7% British542 0.6% Swedish449 0.5% Iranian384 0.5% Eastern European373 0.4% Greek356 0.4% Brazilian344 0.4% Scandinavian307 0.4% Hungarian307 0.4% Scotch-Irish303 0.4% Armenian301 0.4% French Canadian290 0.3% Ukrainian273 0.3% Turkish251 0.3% Danish232 0.3% Welsh220 0.3% Portuguese211 0.3% African188 0.2% Canadian167 0.2% Czech167 0.2% Romanian123 0.1% Austrian120 0.1% Croatian116 0.1% Finnish109 0.1% Iraqi108 0.1% Syrian99 0.1% Swiss96 0.1% Lithuanian94 0.1% Slovak89 0.1% Lebanese81 0.10% Arab74 0.09% Slavic70 0.08% Belgian64 0.08% Basque64 0.08% Australian49 0.06% Afghan47 0.06% Serbian47 0.06% Slovene46 0.06% Cajun45 0.05% Palestinian38 0.05% Latvian38 0.05% Ethiopian30 0.04% Czechoslovakian29 0.03% Israeli24 0.03% Moroccan23 0.03% Estonian23 0.03% South African20 0.02% Jamaican18 0.02% Haitian18 0.02% Bulgarian17 0.02% West Indian15 0.02% Maltese15 0.02% Assyrian12 0.01% Belizean11 0.01% Cypriot11 0.01% Jordanian7 0.01% Albanian7 0.01% Soviet Union6 0.01% Macedonian
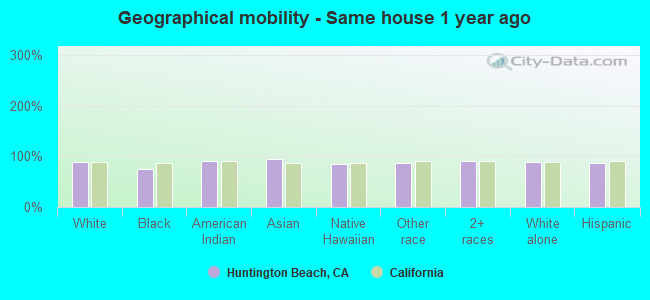
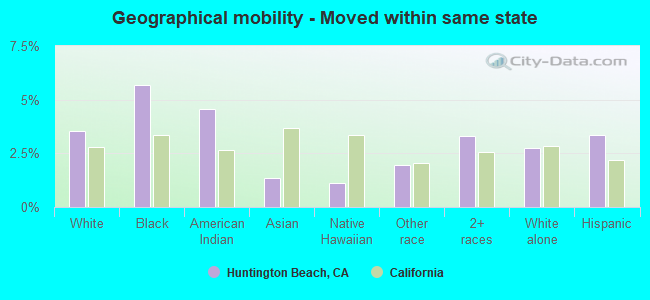
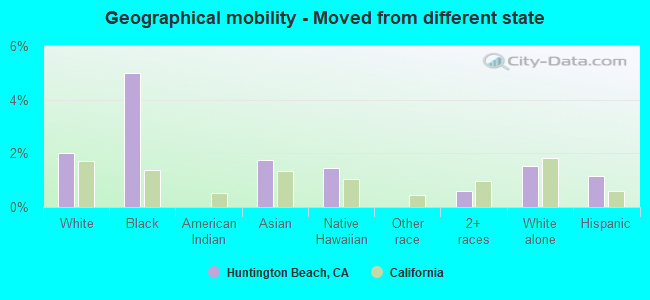
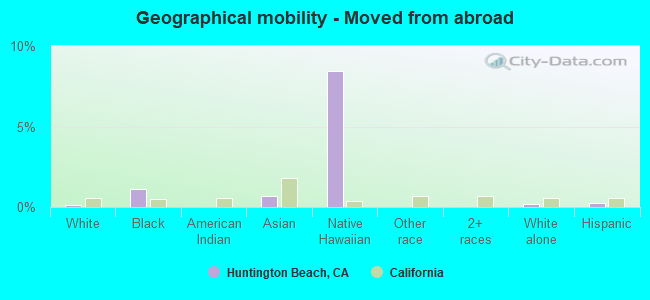
Geographical mobility in Huntington Beach Same house 1 year ago 94,520 88.3% White (Caucasian)2,075 74.9% Black or African American1,265 89.7% American Indian / Alaska Native25,070 94.9% Asian809 84.9% Native Hawaiian / Pacific Islander22,213 86.6% Other race27,800 89.9% Two or more races103,077 89.0% White alone, not Hispanic / Latino35,189 87.0% Hispanic or LatinoMoved within same county 6,728 6.3% White / Caucasian331 11.9% Black or African American94 6.7% American Indian / Alaska Native469 1.8% Asian45 4.7% Native Hawaiian / Pacific Islander2,717 10.6% Other race2,018 6.5% Two or more races7,815 6.7% White alone, not Hispanic / Latino3,199 7.9% Hispanic or LatinoMoved within same state 3,787 3.5% White / Caucasian157 5.7% Black or African American64 4.6% American Indian / Alaska Native361 1.4% Asian11 1.1% Native Hawaiian / Pacific Islander497 1.9% Other race1,021 3.3% Two or more races3,190 2.8% White alone, not Hispanic / Latino1,362 3.4% Hispanic or LatinoMoved from different state 2,168 2.0% White / Caucasian138 5.0% Black or African American460 1.7% Asian14 1.5% Native Hawaiian / Pacific Islander182 0.6% Two or more races1,753 1.5% White alone, not Hispanic / Latino463 1.1% Hispanic or LatinoMoved from abroad 125 0.1% White31 1.1% Black or African American179 0.7% Asian81 8.5% Native Hawaiian / Pacific Islander222 0.2% White alone, not Hispanic / Latino111 0.3% Hispanic or Latino
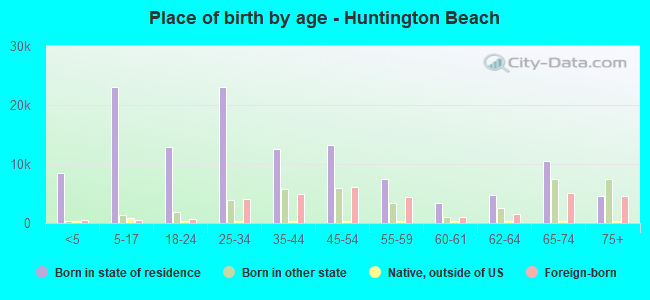
Children Nativity (place of birth) in Huntington Beach
Children under 6 years - Living with two parents Both parents native 4,789 100.0% NativeBoth parents foreign-born 948 95.8% Native42 4.2% Foreign-bornOne native, one foreign-born parent 1,588 100.0% NativeChildren under 6 years - Living with one parent Native parent 2,235 99.7% Native7 0.3% Foreign-bornForeign-born parent 514 50.4% Native506 49.6% Foreign-bornChildren 6 to 17 years - Living with two parents Both parents native 11,321 99.5% Native61 0.5% Foreign-bornBoth parents foreign-born 2,255 88.4% Native296 11.6% Foreign-bornOne native, one foreign-born parent 3,902 100.0% NativeChildren 6 to 17 years - Living with one parent Native parent 3,564 100.0% NativeForeign-born parent 1,566 51.4% Native1,480 48.6% Foreign-born
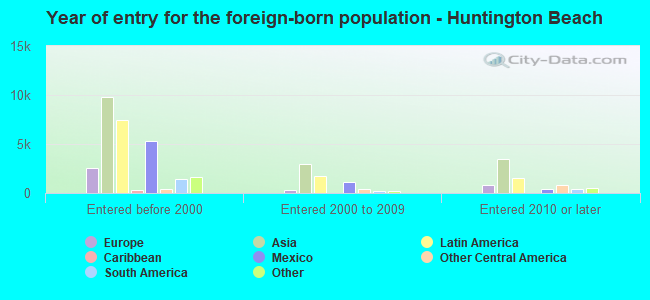
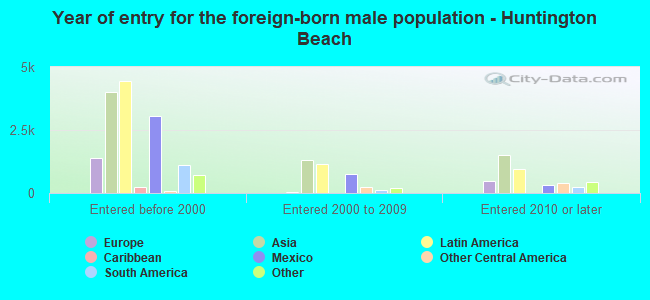
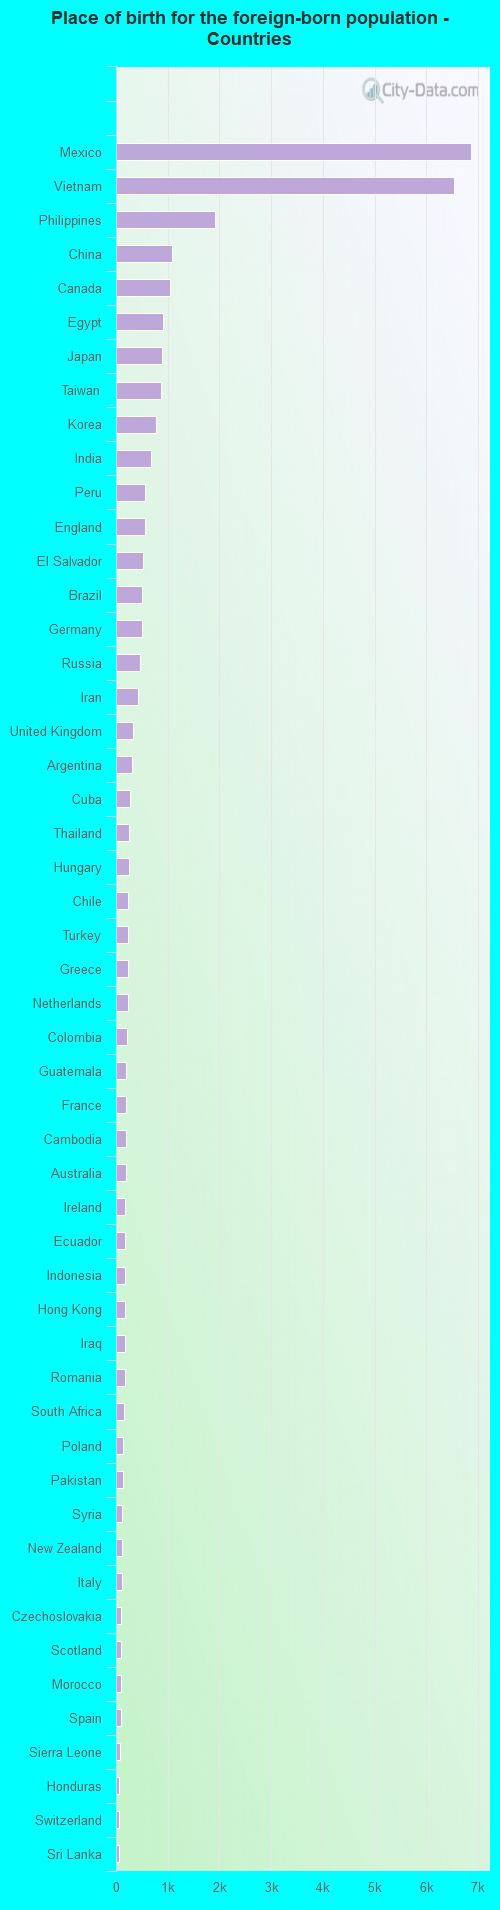
Place of birth for residents in Huntington Beach 15,189 Asia11,295 Americas10,257 Latin America9,214 South Eastern Asia7,767 Central America4,314 Europe3,782 Eastern Asia2,130 South America2,126 China1,469 Eastern Europe1,456 Africa1,382 South Central Asia1,319 Northern Europe1,064 Western Europe1,038 Northern Africa1,038 Northern America785 Western Asia475 Oceania454 Southern Europe359 Caribbean311 Australia and New Zealand Subregion173 Eastern Africa163 Southern Africa82 Western Africa6,871 Mexico6,529 Vietnam1,906 Philippines1,091 China1,038 Canada908 Egypt881 Japan861 Taiwan766 Korea677 India559 Peru557 England522 El Salvador504 Brazil502 Germany467 Russia430 Iran335 United Kingdom305 Argentina263 Cuba250 Thailand247 Hungary240 Chile240 Turkey239 Greece235 Netherlands214 Colombia201 Guatemala189 France187 Cambodia186 Australia180 Ireland176 Ecuador174 Indonesia172 Hong Kong171 Iraq169 Romania163 South Africa131 Poland127 Pakistan125 Syria125 New Zealand113 Italy103 Czechoslovakia97 Scotland96 Morocco88 Spain71 Sierra Leone67 Honduras65 Switzerland63 Sri Lanka60 Armenia60 Nicaragua60 Israel58 Singapore57 Belarus53 Ukraine49 Dominica48 Sweden45 Laos44 Austria43 Denmark37 Venezuela37 Eritrea35 Bolivia35 Croatia35 Bangladesh35 Kuwait34 Afghanistan34 Costa Rica34 Serbia33 Malaysia32 Ethiopia29 Norway29 Bulgaria26 Belgium26 Lebanon25 Jordan24 Kenya22 Uruguay20 Jamaica17 Burma14 Portugal13 Lithuania13 Nepal10 Nigeria10 Trinidad and Tobago9 Panama8 St. Vincent and the Grenadines8 Haiti
Grandparents responsible for own grandchildren in Huntington Beach
Grandparents (30 to 59 years) White / Caucasian 36 17.7% Responsible for grandchildren167 82.3% Not responsible for grandchildrenAmerican Indian / Alaska Native 33 100.0% Not responsible for grandchildrenAsian 35 42.5% Responsible for grandchildren48 57.5% Not responsible for grandchildrenNative Hawaiian / Pacific Islander 30 100.0% Not responsible for grandchildrenOther race 28 12.1% Responsible for grandchildren203 87.9% Not responsible for grandchildrenTwo or more races 514 100.0% Not responsible for grandchildrenWhite alone, not Hispanic / Latino 38 17.8% Responsible for grandchildren177 82.2% Not responsible for grandchildrenHispanic or Latino 54 15.6% Responsible for grandchildren292 84.4% Not responsible for grandchildrenGrandparents (60 years and over) White / Caucasian 129 14.6% Responsible for grandchildren754 85.4% Not responsible for grandchildrenAsian 152 28.1% Responsible for grandchildren388 71.9% Not responsible for grandchildrenNative Hawaiian / Pacific Islander 6 100.0% Not responsible for grandchildrenOther race 20 20.6% Responsible for grandchildren79 79.4% Not responsible for grandchildrenTwo or more races 285 100.0% Not responsible for grandchildrenWhite alone, not Hispanic / Latino 351 30.4% Responsible for grandchildren804 69.6% Not responsible for grandchildrenHispanic or Latino 72 19.3% Responsible for grandchildren299 80.7% Not responsible for grandchildren