Races in Huntington, Vermont (VT) Detailed Stats
Ancestries, Foreign-born residents, place of birth

Recent posts about races in Huntington, Vermont on our local forum with over 2,400,000 registered users:
 | Need Advice. May move to Burlington for a Job (9 replies) |
| Builders, Real estate agents (3 replies) |
| Rural and affordable near Burlington? (5 replies) |
| Goat boarding - preferably near Huntington (6 replies) |
| I had a wonderful time in Burlington & Stowe (7 replies) |
| North or south of Burlington? (12 replies) |
1.2% of Huntington, VT residents are foreign-born , which is 238.4% less than the foreign-born rate of 4.0% across the entire state of Vermont.
Race distribution in Huntington

- 1,81097.3%White alone
- 251.3%Two or more races
- 90.5%Asian alone
- 70.4%Hispanic
- 70.4%Black alone
- 30.2%American Indian alone
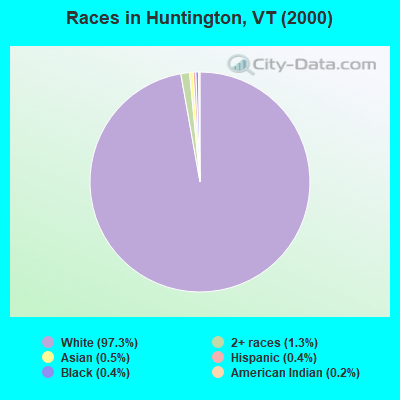
2000
2022
-
- 585,43196.2%White alone
- 6,8091.1%Two or more races
- 5,5040.9%Hispanic
- 5,1600.8%Asian alone
- 2,9210.5%Black alone
- 2,3250.4%American Indian alone
- 5570.09%Other race alone
- 1200.02%Native Hawaiian and Other
Pacific Islander alone

-
- 583,54690.2%White alone
- 27,3404.2%Two or more races
- 14,7702.3%Hispanic
- 11,5121.8%Asian alone
- 6,2641.0%Black alone
- 2,5210.4%Other race alone
- 1,0520.2%American Indian alone
- 590.01%Native Hawaiian and Other
Pacific Islander alone

Income and house value in Huntington
- Median household income in 2022
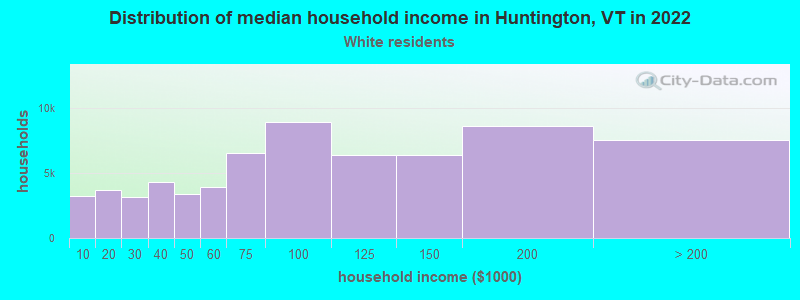
- $90,557White non-Hispanic householders
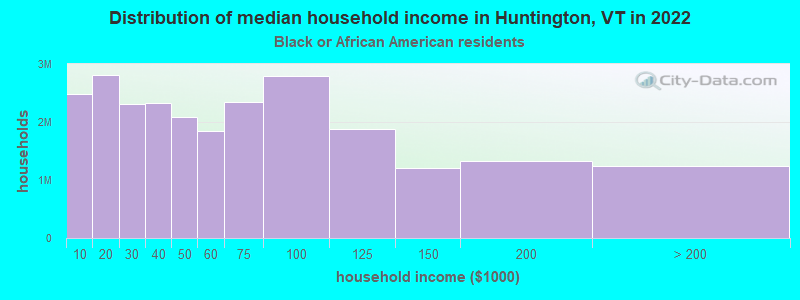
- $85,207Black householders
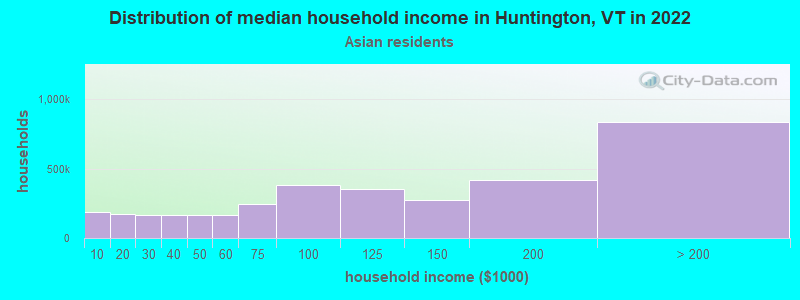
- $55,977Asian householders
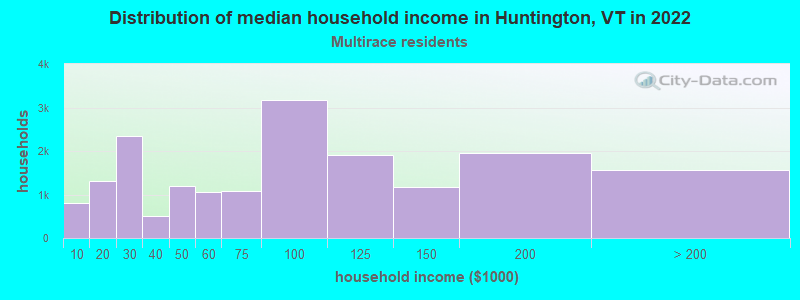
- $97,966Two or more races householders
- Median 2022 house value
- $345,054White Non-Hispanic householders
- $484,129Asian householders
Household income for White non-Hispanic householders
Household income for Black householders
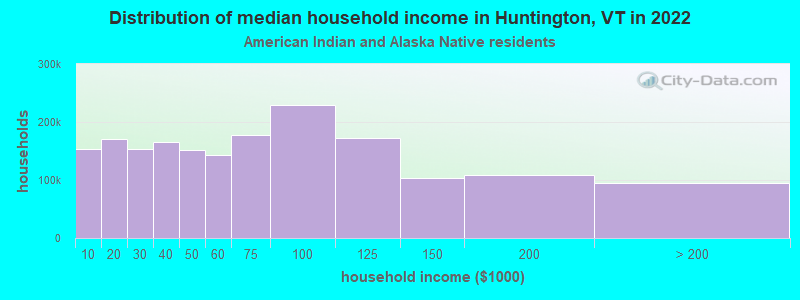
Household income for American Indian and Alaska Native householders
Household income for Asian householders
Household income for Two or more races householders
Foreign-born residents in Huntington
22 residents are foreign born
| This city: | 1.2% |
| Vermont: | 3.8% |
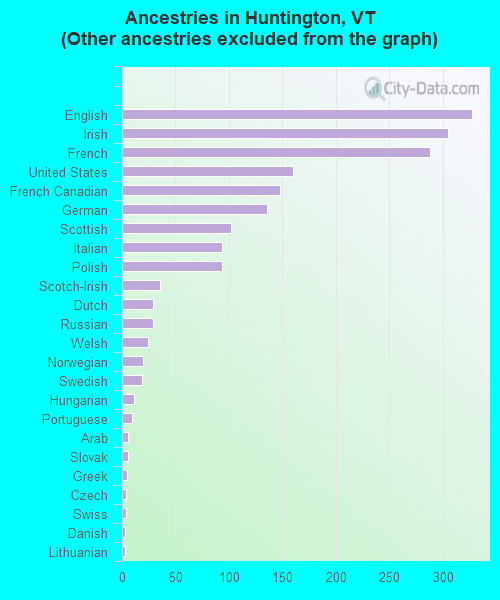
Ancestries in Huntington

- 33515.2%Other
- 32714.9%English
- 30513.9%Irish
- 28813.1%French
- 1607.3%United States
- 1486.7%French Canadian
- 1366.2%German
- 1024.6%Scottish
- 944.3%Italian
- 944.3%Polish
- 361.6%Scotch-Irish
- 291.3%Dutch
- 291.3%Russian
- 241.1%Welsh
- 200.9%Norwegian
- 190.9%Swedish
- 110.5%Hungarian
- 90.4%Portuguese
- 60.3%Arab
- 60.3%Slovak
- 50.2%Greek
- 40.2%Czech
- 40.2%Swiss
- 30.1%Danish
- 30.1%Lithuanian
- 20.09%Ukrainian
Zip codes: 05462.