Races in Imperial-Enlow, Pennsylvania (PA) Detailed Stats
Ancestries, Foreign-born residents, place of birth

Discuss Imperial-Enlow, Pennsylvania races on our local forum with over 2,400,000 registered users
0.5% of Imperial-Enlow, PA residents are foreign-born , which is 1346.9% less than the foreign-born rate of 7.0% across the entire state of Pennsylvania.
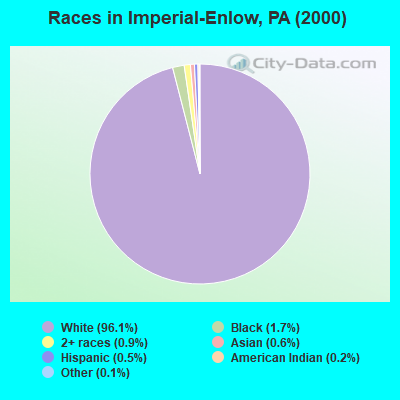
Race distribution in Imperial-Enlow

- 3,37696.1%White alone
- 581.7%Black alone
- 320.9%Two or more races
- 200.6%Asian alone
- 170.5%Hispanic
- 60.2%American Indian alone
- 40.1%Other race alone
- 10.03%Native Hawaiian and Other
Pacific Islander alone
2000
2022
-
- 10,322,45584.1%White alone
- 1,202,4379.8%Black alone
- 394,0883.2%Hispanic
- 218,2961.8%Asian alone
- 113,0970.9%Two or more races
- 13,0860.1%Other race alone
- 14,9040.1%American Indian alone
- 2,6910.02%Native Hawaiian and Other
Pacific Islander alone

-
- 9,487,22873.1%White alone
- 1,311,58110.1%Black alone
- 1,115,9978.6%Hispanic
- 493,9423.8%Two or more races
- 487,1243.8%Asian alone
- 63,5820.5%Other race alone
- 10,1300.08%American Indian alone
- 2,4240.02%Native Hawaiian and Other
Pacific Islander alone

Income and house value in Imperial-Enlow
- Median household income in 2022
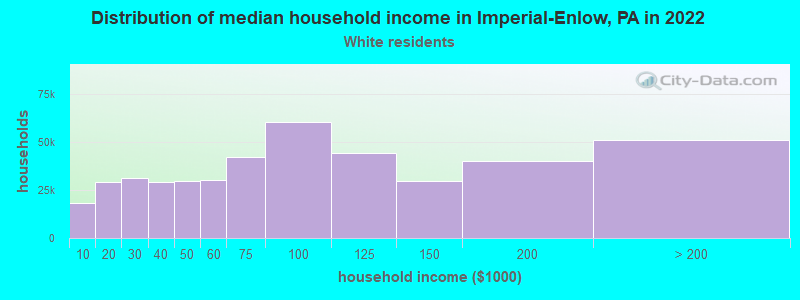
- $78,497White non-Hispanic householders
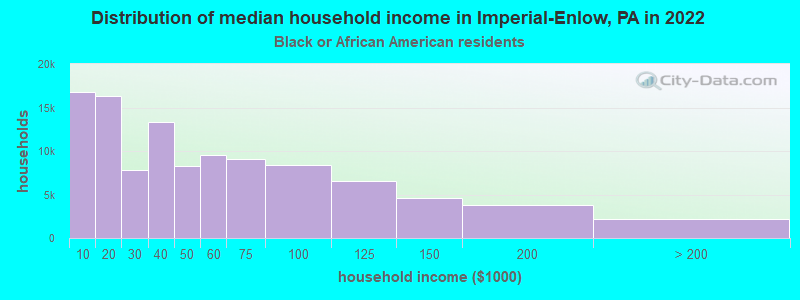
- $69,972Black householders
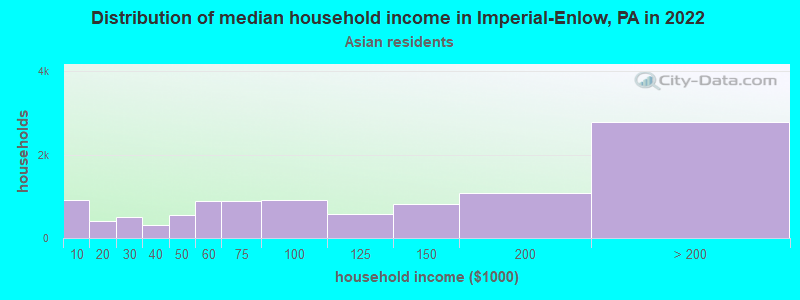
- $54,632Asian householders
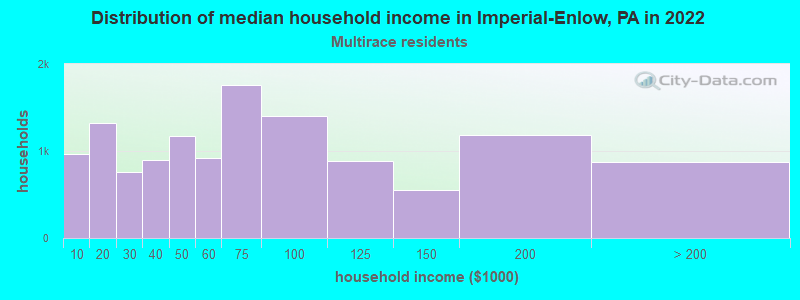
- $33,023Two or more races householders
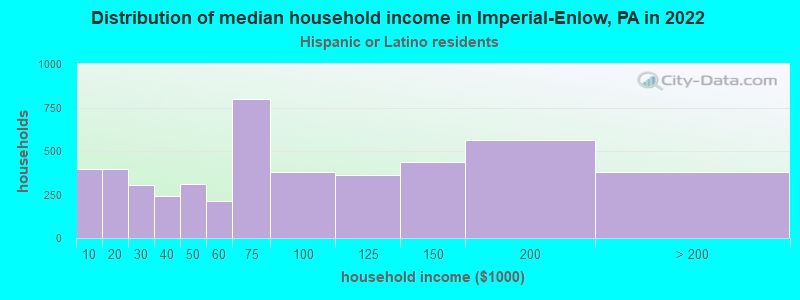
- $28,384Hispanic or Latino race householders
- Median 2022 house value
- $269,491White Non-Hispanic householders
- $298,697Black or African American householders
- $59,739Asian householders
- $86,290Hispanic or Latino householders
Household income for White non-Hispanic householders
Household income for Black householders
Household income for Asian householders
Household income for Two or more races householders
Household income for Hispanic or Latino race householders
Foreign-born residents in Imperial-Enlow
17 residents are foreign born
| This city: | 0.5% |
| Pennsylvania: | 4.1% |
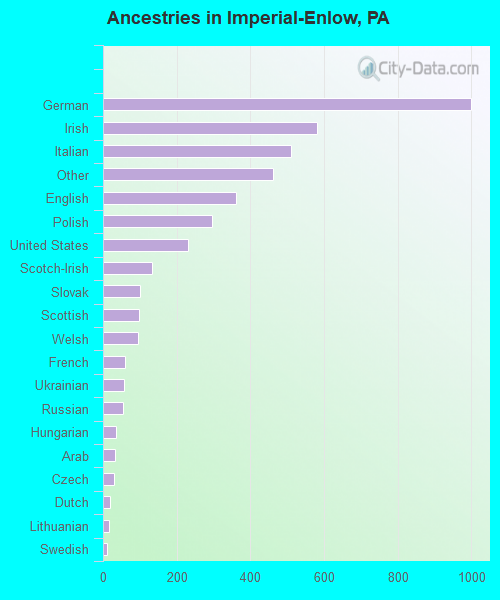
Ancestries in Imperial-Enlow

- 99823.8%German
- 58113.9%Irish
- 51012.2%Italian
- 46111.0%Other
- 3628.6%English
- 2967.1%Polish
- 2315.5%United States
- 1323.1%Scotch-Irish
- 1012.4%Slovak
- 972.3%Scottish
- 952.3%Welsh
- 591.4%French
- 571.4%Ukrainian
- 541.3%Russian
- 350.8%Hungarian
- 330.8%Arab
- 310.7%Czech
- 180.4%Dutch
- 170.4%Lithuanian
- 120.3%Swedish
- 70.2%French Canadian
- 70.2%Swiss
Zip codes: 15126.