Races in Inwood, New York (NY) Detailed Stats
Data:
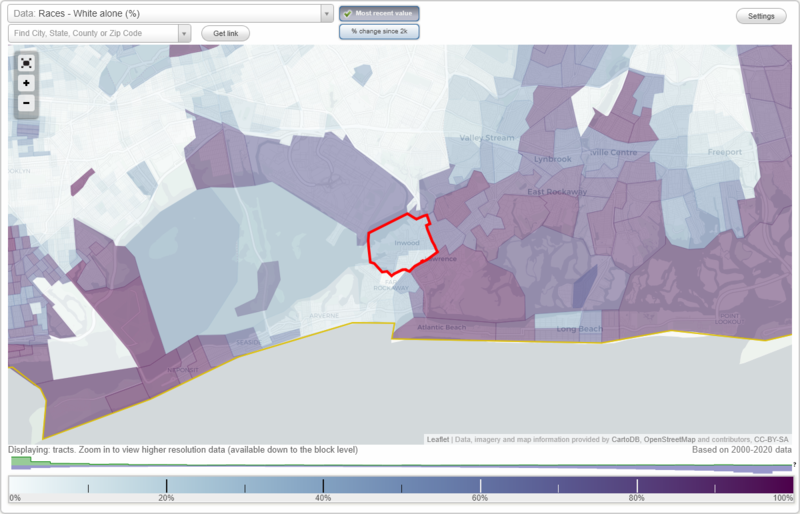
Races - White alone (%)
Races - White alone (% change since 2000)
Races - Black alone (%)
Races - Black alone (% change since 2000)
Races - American Indian alone (%)
Races - American Indian alone (% change since 2000)
Races - Asian alone (%)
Races - Asian alone (% change since 2000)
Races - Hispanic (%)
Races - Hispanic (% change since 2000)
Races - Native Hawaiian and Other Pacific Islander alone (%)
Races - Native Hawaiian and Other Pacific Islander alone (% change since 2000)
Races - Two or more races(%)
Races - Two or more races(% change since 2000)
Races - Other race alone (%)
Races - Other race alone (% change since 2000)
Racial diversity
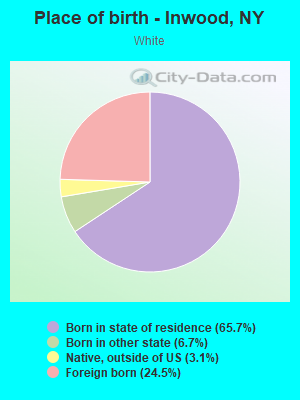
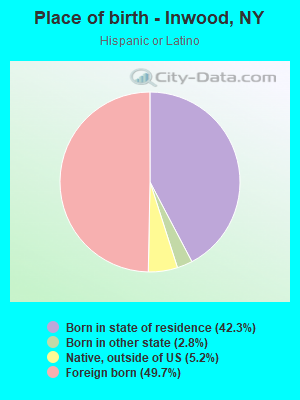
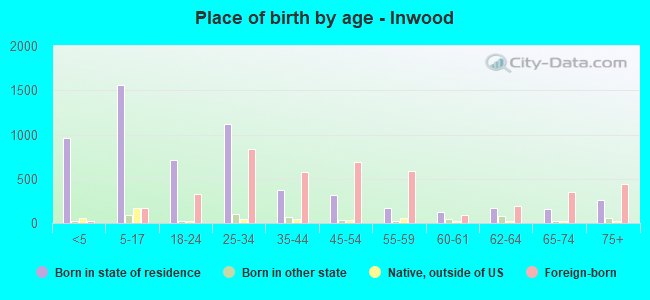
Place of birth - Born in state of residence (%)
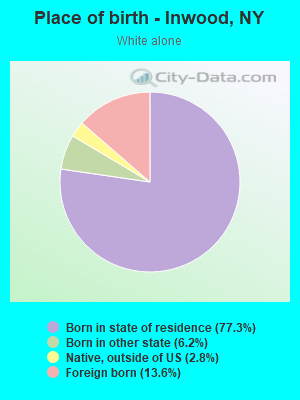
Place of birth - Born in state of residence (%) - White
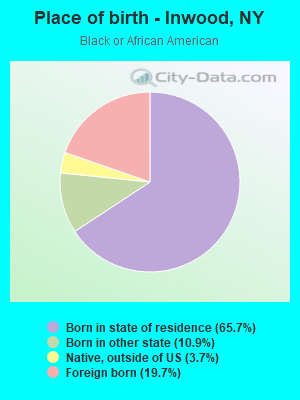
Place of birth - Born in state of residence (%) - Black or African American
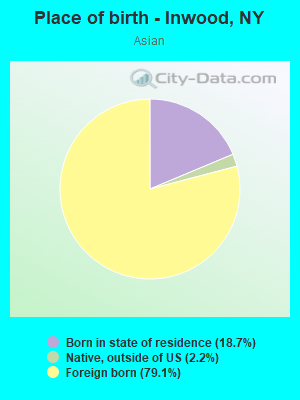
Place of birth - Born in state of residence (%) - Asian
Place of birth - Born in state of residence (%) - Hispanic or Latino
Place of birth - Born in state of residence (%) - American Indian and Alaska Native
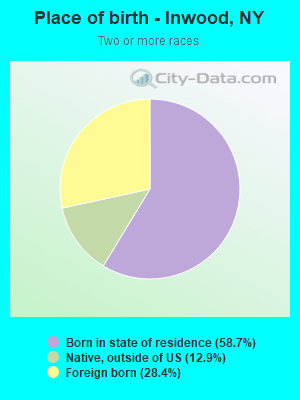
Place of birth - Born in state of residence (%) - Multirace
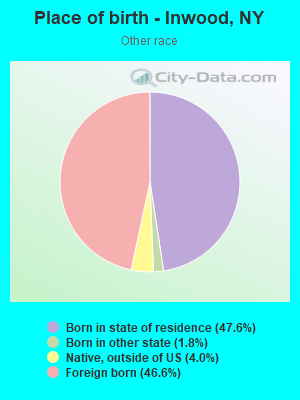
Place of birth - Born in state of residence (%) - Other Race
Place of birth - Born in other state (%)
Place of birth - Born in other state (%) - White
Place of birth - Born in other state (%) - Black or African American
Place of birth - Born in other state (%) - Asian
Place of birth - Born in other state (%) - Hispanic or Latino
Place of birth - Born in other state (%) - American Indian and Alaska Native
Place of birth - Born in other state (%) - Multirace
Place of birth - Born in other state (%) - Other Race
Place of birth - Native, outside of US (%)
Place of birth - Native, outside of US (%) - White
Place of birth - Native, outside of US (%) - Black or African American
Place of birth - Native, outside of US (%) - Asian
Place of birth - Native, outside of US (%) - Hispanic or Latino
Place of birth - Native, outside of US (%) - American Indian and Alaska Native
Place of birth - Native, outside of US (%) - Multirace
Place of birth - Native, outside of US (%) - Other Race
Place of birth - Foreign born (%)
Place of birth - Foreign born (%) - White
Place of birth - Foreign born (%) - Black or African American
Place of birth - Foreign born (%) - Asian
Place of birth - Foreign born (%) - Hispanic or Latino
Place of birth - Foreign born (%) - American Indian and Alaska Native
Place of birth - Foreign born (%) - Multirace
Place of birth - Foreign born (%) - Other Race
Residents speaking English at home (%)
Residents speaking English at home - Born in the United States (%)
Residents speaking English at home - Native, born elsewhere (%)
Residents speaking English at home - Foreign born (%)
Residents speaking Spanish at home (%)
Residents speaking Spanish at home - Born in the United States (%)
Residents speaking Spanish at home - Native, born elsewhere (%)
Residents speaking Spanish at home - Foreign born (%)
Residents speaking other language at home (%)
Residents speaking other language at home - Born in the United States (%)
Residents speaking other language at home - Native, born elsewhere (%)
Residents speaking other language at home - Foreign born (%)
Marital status - Never married (%)
Marital status - Now married (%)
Marital status - Separated (%)
Marital status - Widowed (%)
Marital status - Divorced (%)
Ancestries Reported - Arab (%)
Ancestries Reported - Czech (%)
Ancestries Reported - Danish (%)
Ancestries Reported - Dutch (%)
Ancestries Reported - English (%)
Ancestries Reported - French (%)
Ancestries Reported - French Canadian (%)
Ancestries Reported - German (%)
Ancestries Reported - Greek (%)
Ancestries Reported - Hungarian (%)
Ancestries Reported - Irish (%)
Ancestries Reported - Italian (%)
Ancestries Reported - Lithuanian (%)
Ancestries Reported - Norwegian (%)
Ancestries Reported - Polish (%)
Ancestries Reported - Portuguese (%)
Ancestries Reported - Russian (%)
Ancestries Reported - Scotch-Irish (%)
Ancestries Reported - Scottish (%)
Ancestries Reported - Slovak (%)
Ancestries Reported - Subsaharan African (%)
Ancestries Reported - Swedish (%)
Ancestries Reported - Swiss (%)
Ancestries Reported - Ukrainian (%)
Ancestries Reported - United States (%)
Ancestries Reported - Welsh (%)
Ancestries Reported - West Indian (%)
Ancestries Reported - Other (%)
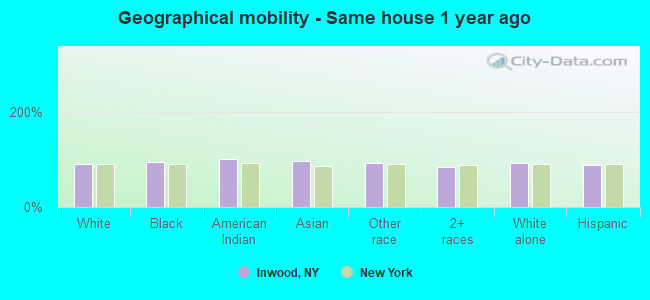
Geographical mobility - Same house 1 year ago (%)
Geographical mobility - Same house 1 year ago (%) - White
Geographical mobility - Same house 1 year ago (%) - Black or African American
Geographical mobility - Same house 1 year ago (%) - Asian
Geographical mobility - Same house 1 year ago (%) - Hispanic or Latino
Geographical mobility - Same house 1 year ago (%) - American Indian and Alaska Native
Geographical mobility - Same house 1 year ago (%) - Multirace
Geographical mobility - Same house 1 year ago (%) - Other Race
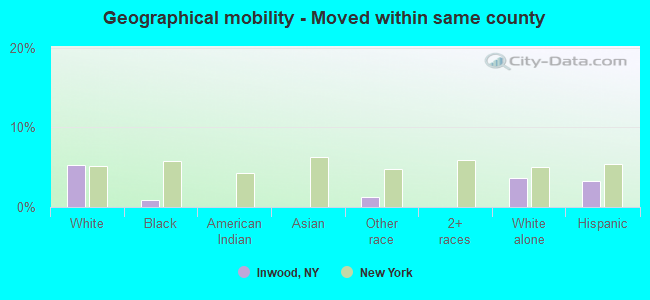
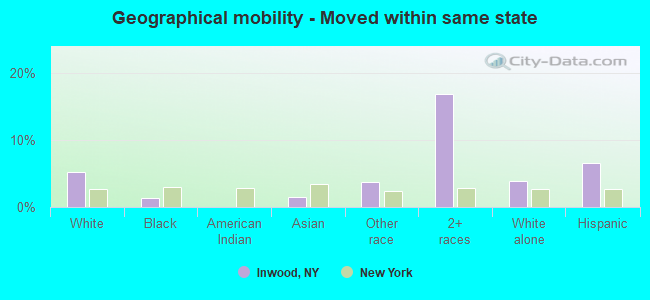
Geographical mobility - Moved within same county (%)
Geographical mobility - Moved within same county (%) - White
Geographical mobility - Moved within same county (%) - Black or African American
Geographical mobility - Moved within same county (%) - Asian
Geographical mobility - Moved within same county (%) - Hispanic or Latino
Geographical mobility - Moved within same county (%) - American Indian and Alaska Native
Geographical mobility - Moved within same county (%) - Multirace
Geographical mobility - Moved within same county (%) - Other Race
Geographical mobility - Moved from different county within same state (%)
Geographical mobility - Moved from different county within same state (%) - White
Geographical mobility - Moved from different county within same state (%) - Black or African American
Geographical mobility - Moved from different county within same state (%) - Asian
Geographical mobility - Moved from different county within same state (%) - Hispanic or Latino
Geographical mobility - Moved from different county within same state (%) - American Indian and Alaska Native
Geographical mobility - Moved from different county within same state (%) - Multirace
Geographical mobility - Moved from different county within same state (%) - Other Race
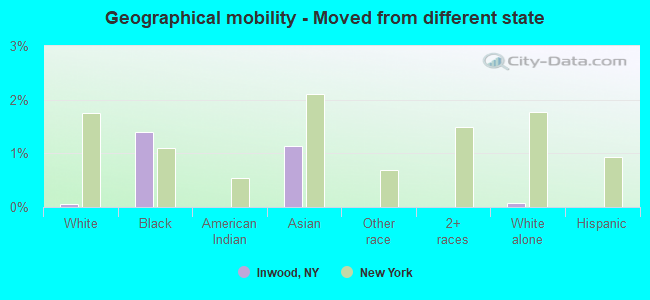
Geographical mobility - Moved from different state (%)
Geographical mobility - Moved from different state (%) - White
Geographical mobility - Moved from different state (%) - Black or African American
Geographical mobility - Moved from different state (%) - Asian
Geographical mobility - Moved from different state (%) - Hispanic or Latino
Geographical mobility - Moved from different state (%) - American Indian and Alaska Native
Geographical mobility - Moved from different state (%) - Multirace
Geographical mobility - Moved from different state (%) - Other Race
Geographical mobility - Moved from abroad (%)
Geographical mobility - Moved from abroad (%) - White
Geographical mobility - Moved from abroad (%) - Black or African American
Geographical mobility - Moved from abroad (%) - Asian
Geographical mobility - Moved from abroad (%) - Hispanic or Latino
Geographical mobility - Moved from abroad (%) - American Indian and Alaska Native
Geographical mobility - Moved from abroad (%) - Multirace
Geographical mobility - Moved from abroad (%) - Other Race
Place of birth for the foreign-born population - Ireland (%)
Place of birth for the foreign-born population - Denmark (%)
Place of birth for the foreign-born population - Norway (%)
Place of birth for the foreign-born population - Sweden (%)
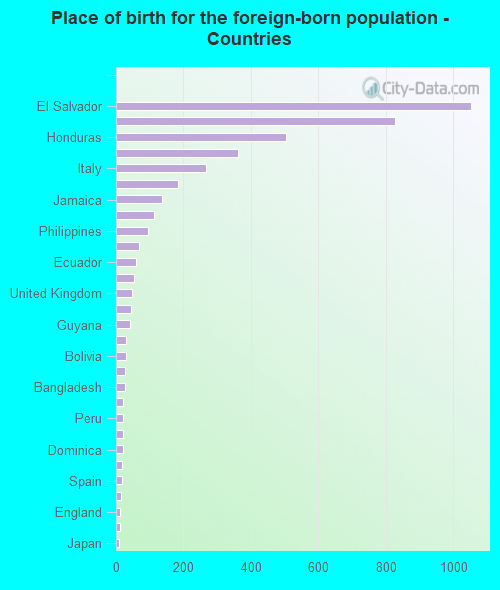
Place of birth for the foreign-born population - United Kingdom (%)
Place of birth for the foreign-born population - England (%)
Place of birth for the foreign-born population - Scotland (%)
Place of birth for the foreign-born population - Other Northern Europe (%)
Place of birth for the foreign-born population - Austria (%)
Place of birth for the foreign-born population - Belgium (%)
Place of birth for the foreign-born population - France (%)
Place of birth for the foreign-born population - Germany (%)
Place of birth for the foreign-born population - Netherlands (%)
Place of birth for the foreign-born population - Switzerland (%)
Place of birth for the foreign-born population - Other Western Europe (%)
Place of birth for the foreign-born population - Greece (%)
Place of birth for the foreign-born population - Italy (%)
Place of birth for the foreign-born population - Portugal (%)
Place of birth for the foreign-born population - Spain (%)
Place of birth for the foreign-born population - Other Southern Europe (%)
Place of birth for the foreign-born population - Albania (%)
Place of birth for the foreign-born population - Belarus (%)
Place of birth for the foreign-born population - Bosnia and Herzegovina (%)
Place of birth for the foreign-born population - Bulgaria (%)
Place of birth for the foreign-born population - Croatia (%)
Place of birth for the foreign-born population - Czechoslovakia (%)
Place of birth for the foreign-born population - Hungary (%)
Place of birth for the foreign-born population - Latvia (%)
Place of birth for the foreign-born population - Lithuania (%)
Place of birth for the foreign-born population - North Macedonia (Macedonia) (%)
Place of birth for the foreign-born population - Moldova (%)
Place of birth for the foreign-born population - Poland (%)
Place of birth for the foreign-born population - Romania (%)
Place of birth for the foreign-born population - Russia (%)
Place of birth for the foreign-born population - Serbia (%)
Place of birth for the foreign-born population - Ukraine (%)
Place of birth for the foreign-born population - Other Eastern Europe (%)
Place of birth for the foreign-born population - China (%)
Place of birth for the foreign-born population - Hong Kong (%)
Place of birth for the foreign-born population - Taiwan (%)
Place of birth for the foreign-born population - Japan (%)
Place of birth for the foreign-born population - Korea (%)
Place of birth for the foreign-born population - Other Eastern Asia (%)
Place of birth for the foreign-born population - Afghanistan (%)
Place of birth for the foreign-born population - Bangladesh (%)
Place of birth for the foreign-born population - India (%)
Place of birth for the foreign-born population - Iran (%)
Place of birth for the foreign-born population - Kazakhstan (%)
Place of birth for the foreign-born population - Nepal (%)
Place of birth for the foreign-born population - Pakistan (%)
Place of birth for the foreign-born population - Sri Lanka (%)
Place of birth for the foreign-born population - Uzbekistan (%)
Place of birth for the foreign-born population - Other South Central Asia (%)
Place of birth for the foreign-born population - Burma (%)
Place of birth for the foreign-born population - Cambodia (%)
Place of birth for the foreign-born population - Indonesia (%)
Place of birth for the foreign-born population - Laos (%)
Place of birth for the foreign-born population - Malaysia (%)
Place of birth for the foreign-born population - Philippines (%)
Place of birth for the foreign-born population - Singapore (%)
Place of birth for the foreign-born population - Thailand (%)
Place of birth for the foreign-born population - Vietnam (%)
Place of birth for the foreign-born population - Other South Eastern Asia (%)
Place of birth for the foreign-born population - Armenia (%)
Place of birth for the foreign-born population - Iraq (%)
Place of birth for the foreign-born population - Israel (%)
Place of birth for the foreign-born population - Jordan (%)
Place of birth for the foreign-born population - Kuwait (%)
Place of birth for the foreign-born population - Lebanon (%)
Place of birth for the foreign-born population - Saudi Arabia (%)
Place of birth for the foreign-born population - Syria (%)
Place of birth for the foreign-born population - Turkey (%)
Place of birth for the foreign-born population - Yemen (%)
Place of birth for the foreign-born population - Other Western Asia (%)
Place of birth for the foreign-born population - Eritrea (%)
Place of birth for the foreign-born population - Ethiopia (%)
Place of birth for the foreign-born population - Kenya (%)
Place of birth for the foreign-born population - Somalia (%)
Place of birth for the foreign-born population - Uganda (%)
Place of birth for the foreign-born population - Zimbabwe (%)
Place of birth for the foreign-born population - Other Eastern Africa (%)
Place of birth for the foreign-born population - Cameroon (%)
Place of birth for the foreign-born population - Congo (%)
Place of birth for the foreign-born population - Democratic Republic of Congo (Zaire) (%)
Place of birth for the foreign-born population - Other Middle Africa (%)
Place of birth for the foreign-born population - Egypt (%)
Place of birth for the foreign-born population - Morocco (%)
Place of birth for the foreign-born population - Sudan (%)
Place of birth for the foreign-born population - Other Northern Africa (%)
Place of birth for the foreign-born population - South Africa (%)
Place of birth for the foreign-born population - Other Southern Africa (%)
Place of birth for the foreign-born population - Cabo Verde (%)
Place of birth for the foreign-born population - Ghana (%)
Place of birth for the foreign-born population - Liberia (%)
Place of birth for the foreign-born population - Nigeria (%)
Place of birth for the foreign-born population - Senegal (%)
Place of birth for the foreign-born population - Sierra Leone (%)
Place of birth for the foreign-born population - Other Western Africa (%)
Place of birth for the foreign-born population - Australia (%)
Place of birth for the foreign-born population - New Zealand (%)
Place of birth for the foreign-born population - Fiji (%)
Place of birth for the foreign-born population - Micronesia (%)
Place of birth for the foreign-born population - Bahamas (%)
Place of birth for the foreign-born population - Barbados (%)
Place of birth for the foreign-born population - Cuba (%)
Place of birth for the foreign-born population - Dominica (%)
Place of birth for the foreign-born population - Dominican Republic (%)
Place of birth for the foreign-born population - Grenada (%)
Place of birth for the foreign-born population - Haiti (%)
Place of birth for the foreign-born population - Jamaica (%)
Place of birth for the foreign-born population - St. Vincent and the Grenadines (%)
Place of birth for the foreign-born population - Trinidad and Tobago (%)
Place of birth for the foreign-born population - West Indies (%)
Place of birth for the foreign-born population - Other Caribbean (%)
Place of birth for the foreign-born population - Belize (%)
Place of birth for the foreign-born population - Costa Rica (%)
Place of birth for the foreign-born population - El Salvador (%)
Place of birth for the foreign-born population - Guatemala (%)
Place of birth for the foreign-born population - Honduras (%)
Place of birth for the foreign-born population - Mexico (%)
Place of birth for the foreign-born population - Nicaragua (%)
Place of birth for the foreign-born population - Panama (%)
Place of birth for the foreign-born population - Other Central America (%)
Place of birth for the foreign-born population - Argentina (%)
Place of birth for the foreign-born population - Bolivia (%)
Place of birth for the foreign-born population - Brazil (%)
Place of birth for the foreign-born population - Chile (%)
Place of birth for the foreign-born population - Colombia (%)
Place of birth for the foreign-born population - Ecuador (%)
Place of birth for the foreign-born population - Guyana (%)
Place of birth for the foreign-born population - Peru (%)
Place of birth for the foreign-born population - Uruguay (%)
Place of birth for the foreign-born population - Venezuela (%)
Place of birth for the foreign-born population - Other South America (%)
Place of birth for the foreign-born population - Canada (%)
Place of birth for the foreign-born population - Other Northern America (%)
Place of birth for the foreign-born population - Other (%)
Latest news about races in Inwood, NY collected exclusively by city-data.com from local newspapers, TV, and radio stations
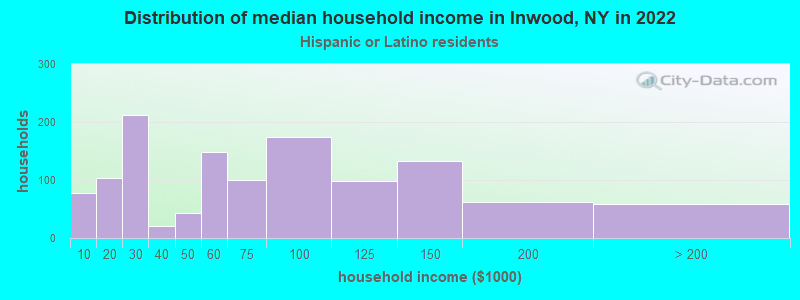
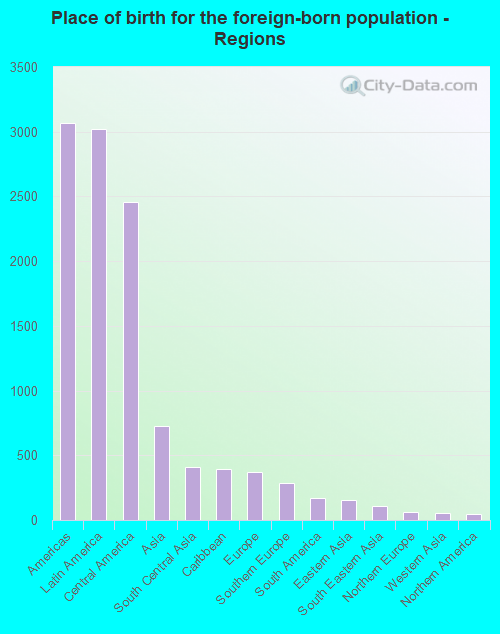
According to 2022 data, the most numerous races in Inwood, NY are White alone (3,124 residents), Hispanic (5,251 residents), and Black alone (1,703 residents). 40.6% of Inwood residents speak English at home. 37.5% of Inwood, NY residents are foreign-born (27.4% born in Latin America, 6.6% born in Asia), which is 41.3% greater than the foreign-born rate of 22.0% across the entire state of New York.
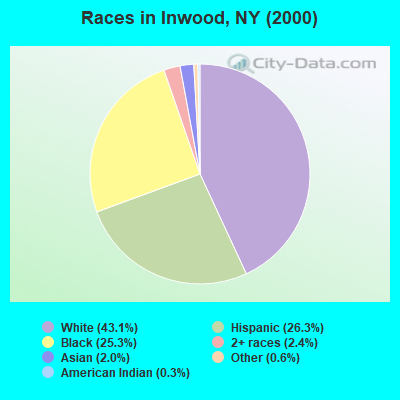
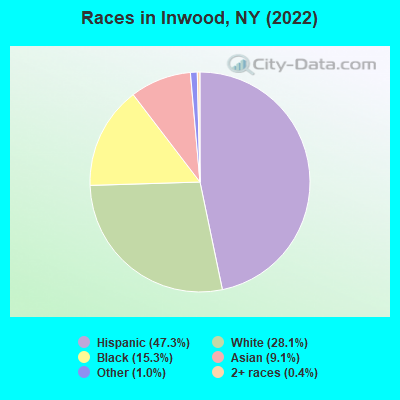
Race distribution in Inwood
2000 2022
11,760,981 62.0% White alone 2,867,583 15.1% Hispanic 2,812,623 14.8% Black alone 1,035,926 5.5% Asian alone 366,116 1.9% Two or more races 75,499 0.4% Other race alone 52,499 0.3% American Indian alone 5,230 0.03% Native Hawaiian and Other
10,408,933 52.9% White alone 3,867,299 19.7% Hispanic 2,633,840 13.4% Black alone 1,776,286 9.0% Asian alone 732,670 3.7% Two or more races 216,110 1.1% Other race alone 35,082 0.2% American Indian alone 6,931 0.04% Native Hawaiian and Other
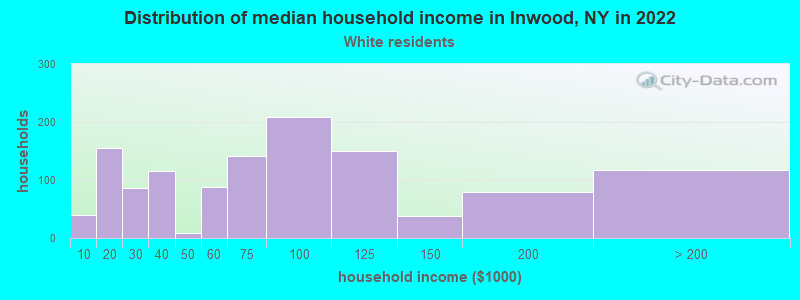
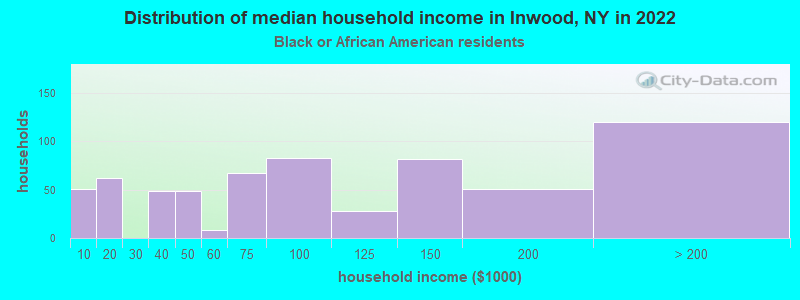
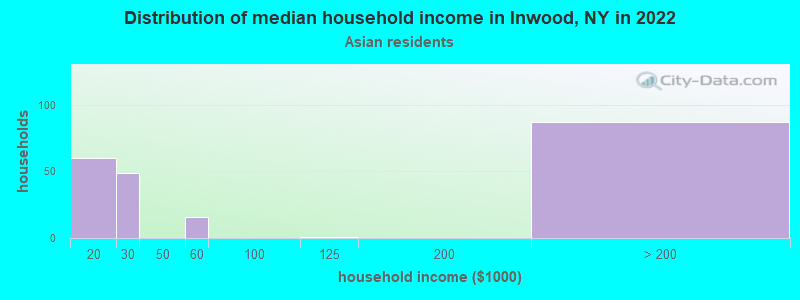
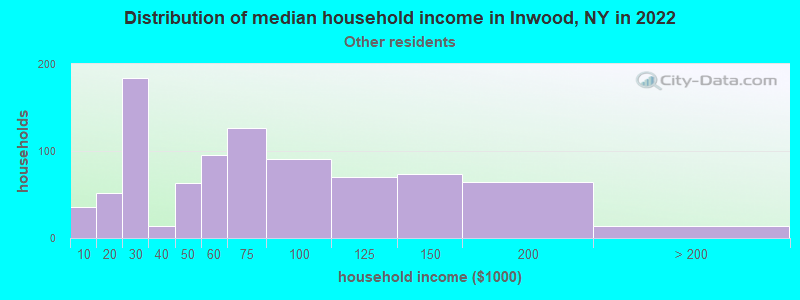
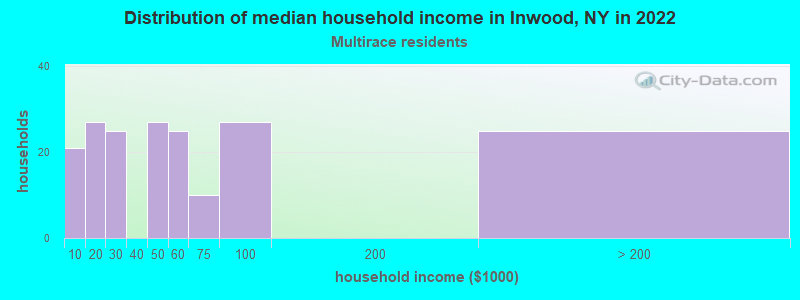
Income and house value in Inwood Median household income in 2022 $70,041 White non-Hispanic householders$81,365 Black householders$62,727 Some other race householders$54,071 Two or more races householders$59,215 Hispanic or Latino race householdersMedian 2022 house value $564,417 White Non-Hispanic householders$520,740 Black or African American householders $745,892 Asian householders$548,115 Some other race householders$673,610 Two or more races householders$529,968 Hispanic or Latino householders
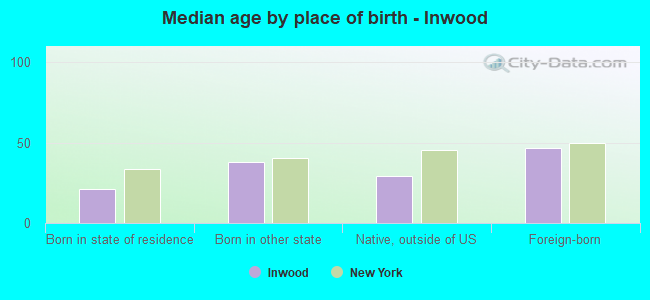
Median age by race in Inwood
32.3 Median age for White residents26.1 39.4 48.8 Median age for Black or African American residents43.7 51.1 -855,158,729.3 Median age for American Indian / Alaska Native residents-607,543,322.5 -837,121,211.3 34.0 Median age for Asian residents34.8 32.5 -487,992,314.6 Median age for Native Hawaiian / Pacific Islander residents-477,502,295.2 -497,387,669.3 27.7 Median age for Other race residents27.2 30.9 33.5 Median age for Two or more races residents32.2 38.5 33.2 Median age for White alone residents26.0 40.8 27.8 Median age for Hispanic or Latino residents26.3 31.2
Owner/renter occupied households by race in Inwood
House owners and renters - White residents 722 58.3% Owner occupied516 41.7% Renter occupiedHouse owners and renters - Black or African American residents 313 52.8% Owner occupied280 47.2% Renter occupiedHouse owners and renters - Asian residents 109 49.7% Owner occupied110 50.3% Renter occupiedHouse owners and renters - Other race residents 188 22.3% Owner occupied654 77.7% Renter occupiedHouse owners and renters - Two or more races residents 76 44.5% Owner occupied95 55.5% Renter occupiedHouse owners and renters - White alone residents 570 60.5% Owner occupied372 39.5% Renter occupiedHouse owners and renters - Hispanic or Latino residents 400 32.2% Owner occupied843 67.8% Renter occupied
Language usage in Inwood
English speakers - Total 40.6% of residents of Inwood speak English at home.
41.0% of residents speak Spanish at home 1,528 37.1% Speak English very well2,588 62.9% Speak English less than very well19.0% of residents speak other language at home 1,191 62.3% Speak English very well722 37.7% Speak English less than very well
English speakers - Born in the United States 88.0% of residents of Inwood speak English at home.
7.8% of residents speak Spanish at home 39 100.0% Speak English less than very well
English speakers - Native, born elsewhere 42.1% of residents of Inwood speak English at home.
45.4% of residents speak Spanish at home 163 91.1% Speak English very well16 8.9% Speak English less than very well8.9% of residents speak other language at home 35 100.0% Speak English very well
English speakers - Foreign-born 10.5% of residents of Inwood speak English at home.
59.5% of residents speak Spanish at home 207 8.1% Speak English very well2,353 91.9% Speak English less than very well30.4% of residents speak other language at home 836 63.8% Speak English very well474 36.2% Speak English less than very well
White (Caucasian) - Speak only English Native:
78.6% (2,054)Foreign-born:
20.5% (200)
White (Caucasian) - Speak another language Native:
18.0% (470)Foreign-born:
77.5% (756)
Black or African American - Speak only English Native:
83.0% (1,184)Foreign-born:
37.7% (130)
Black or African American - Speak another language Native:
17.6% (251)Foreign-born:
62.8% (217)
Asian - Speak only English Native:
83.6% (163)Foreign-born:
5.3% (44)
Asian - Speak another language Native:
18.7% (36)Foreign-born:
96.4% (787)
Other race - Speak only English Native:
8.8% (130)Foreign-born:
2.0% (36)
Other race - Speak another language Native:
86.4% (1,273)Foreign-born:
99.7% (1,849)
Two or more races - Speak only English Native:
28.8% (104)Foreign-born:
18.8% (36)
Two or more races - Speak another language Native:
80.3% (291)Foreign-born:
81.1% (154)
White alone - Speak only English Native:
81.3% (1,910)Foreign-born:
33.9% (145)
White alone - Speak another language Native:
17.4% (409)Foreign-born:
66.1% (283)
Hispanic or Latino - Speak only English Native:
19.3% (385)Foreign-born:
4.2% (108)
Hispanic or Latino - Speak another language Native:
81.3% (1,619)Foreign-born:
95.8% (2,485)
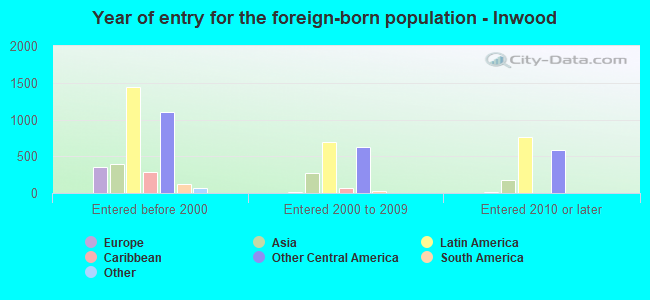
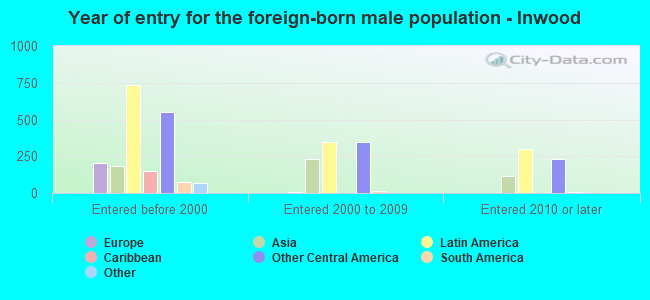
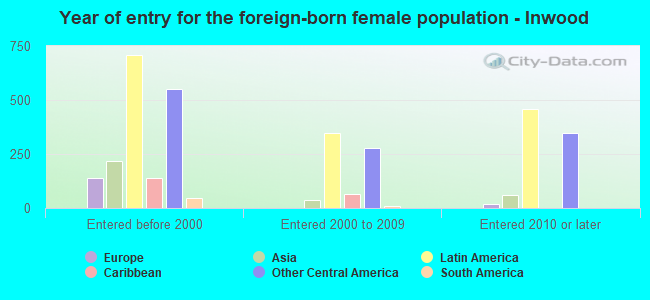
Foreign-born residents in Inwood 4,168 residents are foreign born (27.4% Latin America , 6.6% Asia ).
This city:
37.5%New York:
22.6%
Marital status for residents in Inwood Marital status - White (Caucasian) population 15 years and over
Males 37.6% Never married48.5% Now married2.7% Separated0.5% Widowed10.9% DivorcedFemales 31.4% Never married42.8% Now married3.6% Separated10.7% Widowed11.4% DivorcedWomen who gave birth in the past 12 months Now married:
84.9% (115)Unmarried:
15.1% (21)
Women who did not give birth in the past 12 months Now married:
41.4% (298)Unmarried:
58.6% (422)
Marital status - Black or African American population 15 years and over
Males 48.7% Never married39.4% Now married0.0% Separated2.3% Widowed9.7% DivorcedFemales 54.5% Never married24.0% Now married3.5% Separated7.2% Widowed10.9% DivorcedWomen who did not give birth in the past 12 months Now married:
9.9% (43)Unmarried:
90.1% (393)
Marital status - Asian population 15 years and over
Males 57.2% Never married33.9% Now married0.0% Separated1.8% Widowed7.1% DivorcedFemales 35.3% Never married38.7% Now married2.5% Separated12.1% Widowed11.3% DivorcedWomen who gave birth in the past 12 months Now married:
100.0% (10)Unmarried:
0.0% (0)
Women who did not give birth in the past 12 months Now married:
31.7% (64)Unmarried:
68.3% (138)
Marital status - Other race population 15 years and over
Males 49.6% Never married44.6% Now married0.0% Separated0.0% Widowed5.7% DivorcedFemales 37.8% Never married37.8% Now married5.7% Separated11.6% Widowed7.2% DivorcedWomen who gave birth in the past 12 months Now married:
67.0% (88)Unmarried:
33.0% (43)
Women who did not give birth in the past 12 months Now married:
41.9% (377)Unmarried:
58.1% (523)
Marital status - Two or more races population 15 years and over
Males 22.1% Never married69.9% Now married0.0% Separated0.0% Widowed8.0% DivorcedFemales 39.1% Never married36.7% Now married0.0% Separated7.2% Widowed16.9% DivorcedWomen who did not give birth in the past 12 months Now married:
27.5% (50)Unmarried:
72.5% (132)
Marital status - White alone, not Hispanic / Latino population 15 years and over
Males 34.4% Never married55.5% Now married0.0% Separated0.6% Widowed9.5% DivorcedFemales 25.5% Never married48.0% Now married0.0% Separated11.0% Widowed15.6% DivorcedWomen who gave birth in the past 12 months Now married:
100.0% (90)Unmarried:
0.0% (0)
Women who did not give birth in the past 12 months Now married:
45.9% (197)Unmarried:
54.1% (232)
Marital status - Hispanic or Latino population 15 years and over
Males 46.3% Never married42.5% Now married2.3% Separated0.0% Widowed8.8% DivorcedFemales 40.4% Never married36.6% Now married6.6% Separated10.1% Widowed6.3% DivorcedWomen who gave birth in the past 12 months Now married:
64.7% (111)Unmarried:
35.3% (61)
Women who did not give birth in the past 12 months Now married:
38.0% (478)Unmarried:
62.0% (780)
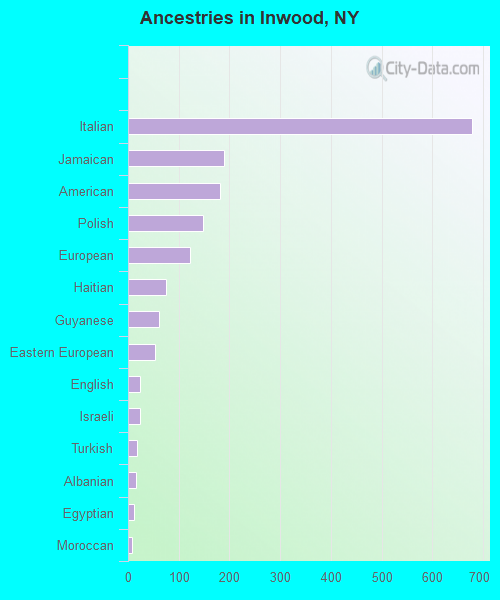
Ancestries in Inwood
678 10.5% Italian190 3.0% Jamaican181 2.8% American148 2.3% Polish122 1.9% European74 1.2% Haitian61 0.9% Guyanese54 0.8% Eastern European24 0.4% English24 0.4% Israeli18 0.3% Turkish15 0.2% Albanian12 0.2% Egyptian7 0.1% Moroccan6 0.09% Finnish
Children Nativity (place of birth) in Inwood
Children under 6 years - Living with two parents Both parents native 292 100.0% NativeBoth parents foreign-born 294 100.0% NativeOne native, one foreign-born parent 141 100.0% NativeChildren under 6 years - Living with one parent Native parent 239 100.0% NativeForeign-born parent 110 100.0% NativeChildren 6 to 17 years - Living with two parents Both parents native 456 100.0% NativeBoth parents foreign-born 277 91.3% Native26 8.7% Foreign-bornOne native, one foreign-born parent 217 100.0% NativeChildren 6 to 17 years - Living with one parent Native parent 361 100.0% NativeForeign-born parent 345 55.6% Native276 44.4% Foreign-born
Grandparents responsible for own grandchildren in Inwood
Grandparents (30 to 59 years) Black or African American 24 100.0% Not responsible for grandchildrenOther race 62 100.0% Not responsible for grandchildrenHispanic or Latino 43 100.0% Not responsible for grandchildren
Grandparents (60 years and over) Black or African American 21 100.0% Not responsible for grandchildrenOther race 18 100.0% Not responsible for grandchildrenHispanic or Latino 84 100.0% Not responsible for grandchildren